Strategi perdagangan kuantitatif hibrid dua penunjuk

Gambaran keseluruhan
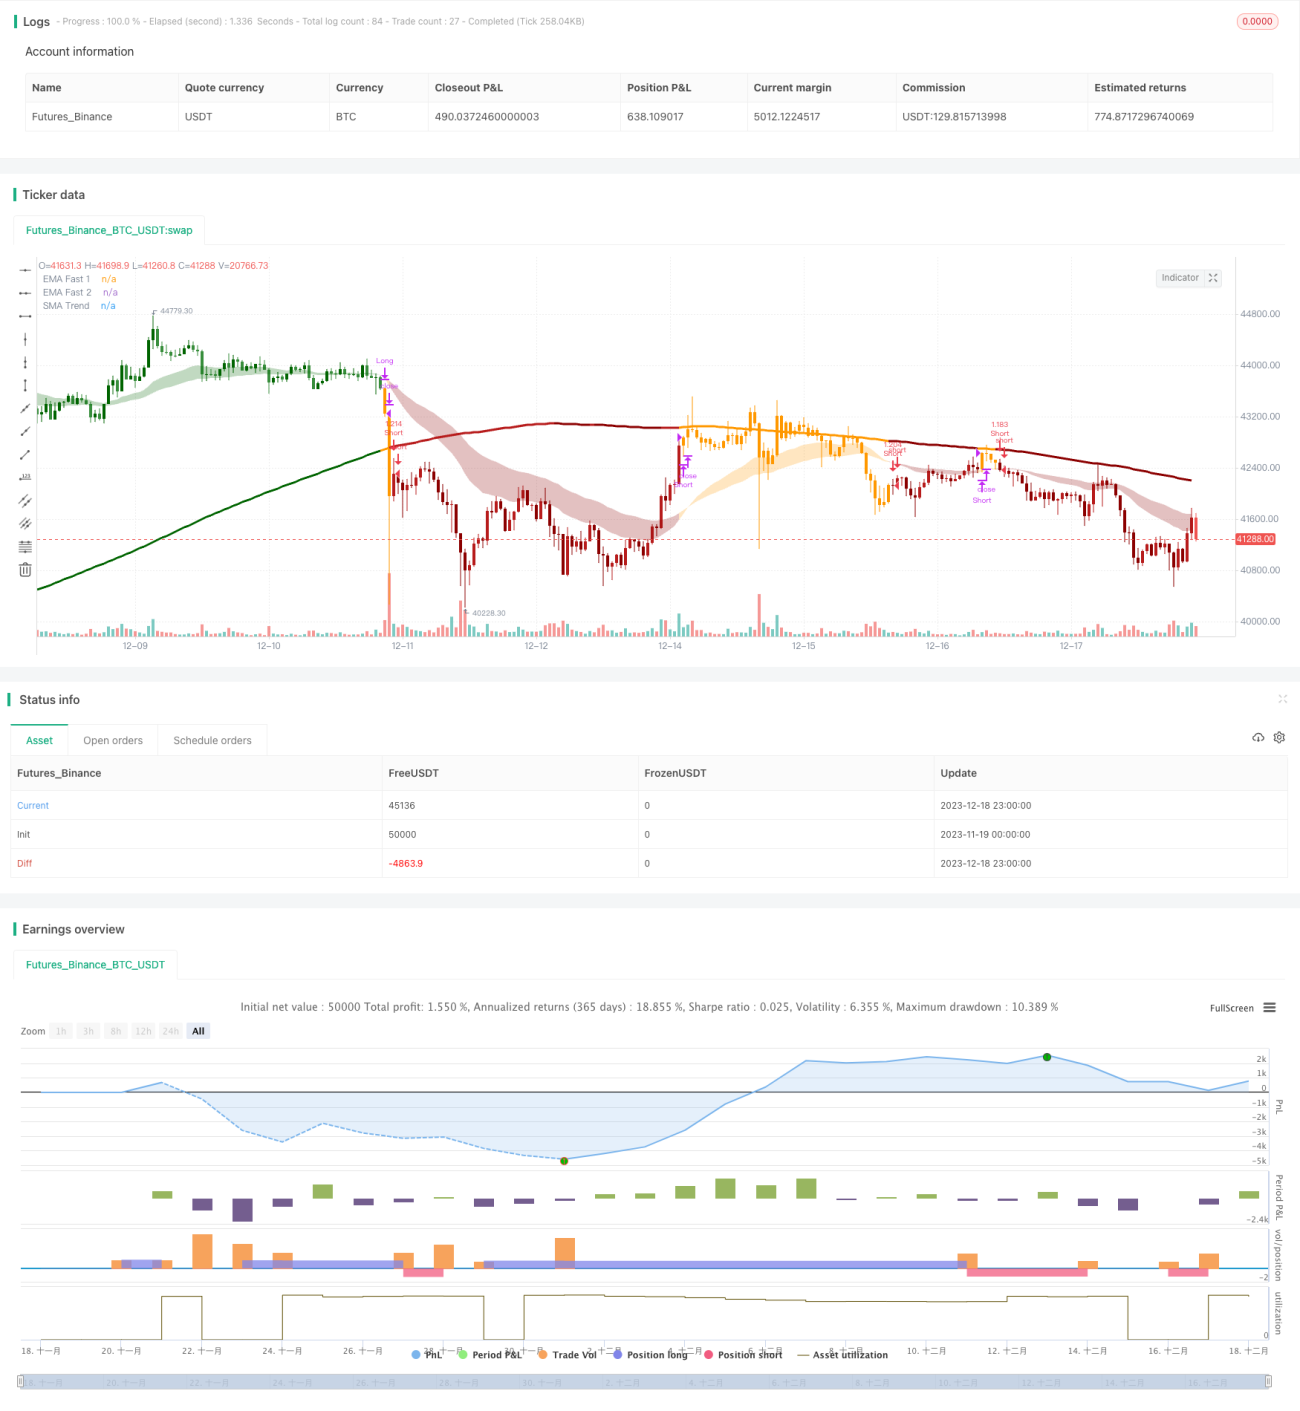
Strategi ini mengenal pasti arah trend dan melakukan perdagangan dengan menggabungkan dua indikator. Pertama, ia menggunakan persilangan dua purata bergerak (gambaran cepat dan garis laju) untuk menilai arah trend jangka pendek; kedua, ia menggunakan ruang saluran dan purata bergerak jangka panjang untuk menilai arah trend utama.
Prinsip Strategi
Strategi ini menggunakan tiga kumpulan indikator untuk membuat keputusan. Pertama, garpu emas garpu cepat EMA ((26 kitaran) dan garpu mati EMA ((50 kitaran) untuk menentukan trend jangka pendek; kedua, mengira julat saluran untuk menentukan sama ada harga menembusi julat itu untuk menentukan kelembapan trend jangka menengah; dan terakhir, mengira garis rata-rata jangka panjang SMA ((200 kitaran), untuk menentukan arah trend utama dengan perbandingan harga.
Secara khusus, logik penghakiman adalah:
-
Persaingan garisan pantas dan garisan pantas (persaingan garisan pantas dan garisan pantas) menentukan arah trend jangka pendek.
-
Jika harga menembusi julat saluran untuk menentukan arah trend jangka menengah. Julat saluran adalah berdasarkan purata jangka panjang ditambah ATR dikurangkan dengan faktor. Jika harga menembusi had atas, ia adalah bullish; jika ia menembusi had bawah, ia adalah bearish.
-
Perbandingan harga dan saiz garis purata jangka panjang untuk menentukan arah trend utama.
Akhirnya, isyarat dagangan akan dikeluarkan hanya apabila ketiga-tiga keputusan pendek, sederhana, dan panjang sama. Keputusan campuran ini dapat menyaring isyarat palsu dengan berkesan dan meningkatkan kestabilan.
Kelebihan Strategik
Ini adalah strategi yang bercampur-campur dengan dua metrik:
-
Ia dapat menyaring isyarat palsu dengan berkesan dan meningkatkan kestabilan. Oleh kerana isyarat perdagangan memerlukan pengesahan hasil pelbagai indikator pendek, sederhana, dan panjang, ia dapat mengelakkan isyarat salah yang disebabkan oleh satu indikator.
-
Fleksibiliti yang tinggi, parameter penunjuk boleh disesuaikan mengikut pasaran. Parameter garis rata-rata dan julat saluran boleh disesuaikan, sesuai dengan keadaan pasaran yang berbeza.
-
Gabungan perdagangan trend dan perdagangan dalam julat. Penunjuk jangka pendek dan menengah menangkap trend, penunjuk jangka panjang menentukan julat, secara keseluruhan menggabungkan kelebihan strategi trend dan pembalikan.
-
Kecekapan penggunaan dana yang tinggi. Hanya apabila keputusan pelbagai indikator diadili sama, dana boleh digunakan dengan berkesan, dan transaksi yang tidak perlu dapat dielakkan.
Risiko Strategik
Strategi ini mempunyai beberapa risiko:
-
Pengaturan parameter berisiko. Periode purata bergerak dan parameter julat saluran memerlukan tetapan yang munasabah, jika tidak betul mungkin tidak dapat mengesan trend dengan berkesan atau menyebabkan terlalu banyak isyarat yang salah.
-
Penunjuk ganda meningkatkan kos peluang perdagangan. Berbanding dengan strategi penunjuk tunggal, mungkin terlepas beberapa peluang perdagangan, tidak dapat masuk dan keluar di tempat terbaik.
-
Strategi berhenti rugi perlu berhati-hati. Mekanisme berhenti rugi yang pecah dalam strategi ini mungkin menyebabkan kerugian yang tidak perlu dan perlu berhati-hati menetapkan nisbah berhenti rugi.
-
Strategi ini lebih sesuai untuk keadaan pasaran yang jelas trend.
Arah pengoptimuman strategi
Strategi ini boleh dioptimumkan dalam beberapa aspek:
-
Uji kombinasi parameter yang berbeza untuk mencari parameter terbaik. Anda boleh mencari tetapan parameter yang optimum dengan menguji lebih banyak data sejarah.
-
Menambah mekanisme penangguhan kerugian yang beradaptasi. Ia boleh digabungkan dengan Indikator Volatiliti untuk menyesuaikan tahap kerugian secara dinamik.
-
Meningkatkan penilaian bantuan penunjuk kuantitatif. Membantu menentukan saiz kedudukan pada titik-titik penting, meningkatkan kecekapan penggunaan dana.
-
Mengoptimumkan logik kemasukan. Pertimbangkan lebih banyak strategi Cost Average untuk kemasukan berpelbagai, mengurangkan risiko kemasukan tunggal.
-
Menggabungkan model pembelajaran mesin untuk menilai keberkesanan dan kesesuaian model.
ringkaskan
Strategi ini dengan cepat dan panjang keputusan tiga indikator dan mekanisme double verification, dapat menghalang isyarat palsu dengan berkesan, meningkatkan kestabilan. Ia juga mempunyai kelebihan perdagangan trend dan perdagangan jarak, penggunaan dana yang tinggi. Ia boleh diperbaiki dengan pelbagai cara seperti pengoptimuman parameter, pengoptimuman stop loss, penggabungan indikator tenaga kuantitatif, dan merupakan strategi kuantiti campuran yang disyorkan.
- 1