Strategi mengikuti trend panjang berdasarkan penunjuk RSI
Gambaran keseluruhan
Strategi ini adalah berdasarkan pada indeks yang agak kuat ((RSI) reka bentuk indikator, untuk membeli RSI rendah dan berhenti pada titik tinggi. Strategi ini menghasilkan isyarat beli apabila RSI adalah lebih rendah daripada garis beli, dan menghasilkan isyarat jual apabila RSI adalah lebih tinggi daripada garis jual. Strategi ini mengoptimumkan prestasi trend, yang dapat mengawal risiko perdagangan dengan berkesan.
Prinsip Strategi
Strategi ini menggunakan RSI untuk menentukan sama ada harga saham terlalu tinggi atau terlalu rendah. RSI digabungkan dengan overbought dan oversold untuk membentuk isyarat beli dan jual. Secara khusus, jika RSI melewati 20 untuk menghasilkan isyarat beli, dan jika RSI melewati 80 untuk menghasilkan isyarat jual.
Setelah memasuki kedudukan berbilang, strategi menetapkan satu garis berhenti awal untuk mengawal risiko ke bawah. Pada masa yang sama, menetapkan dua garis berhenti dengan perkadaran yang berbeza, mengelompokkan berhenti untuk mengunci keuntungan. Secara khusus, pertama-tama berhenti 50% dari kedudukan, harga berhenti adalah 3% dari harga beli; kemudian berhenti 50% dari kedudukan yang tersisa, harga berhenti adalah 5% dari harga beli.
Strategi ini ringkas dan berkesan menggunakan indikator RSI untuk menentukan masa masuk ke pasaran. Pengaturan hentian hentian adalah munasabah dan dapat mengawal risiko dengan berkesan.
Kelebihan Strategik
- Menggunakan RSI untuk menilai kadar kosong, dan mengelakkan kerja berlebihan secara buta
- Parameter RSI telah dioptimumkan untuk memberi kesan yang lebih baik
- Reka bentuk double stop adalah munasabah, boleh mencapai stop beratur dan mengunci lebih banyak keuntungan
- Penutupan awal dan penutupan berturut-turut untuk mengelakkan kerugian besar
Analisis risiko
- Strategi berlainan arah, tidak berkesan dalam pasaran lembu yang tidak dapat mengekalkan keuntungan
- RSI mempunyai kebarangkalian untuk memberi isyarat yang salah, dan isyarat yang salah dapat meningkatkan kerugian
- Terlalu dalam titik henti menyebabkan risiko yang tidak dapat dihentikan
- Tidak ada had untuk jumlah dan peratusan kenaikan saham yang boleh menyebabkan kerugian meningkat
Arah pengoptimuman
- Menapis isyarat RSI dengan penunjuk lain untuk meningkatkan ketepatan isyarat
- Menambah had jumlah dan peratusan penambahan
- Uji kesesuaian RSI
- Mengoptimumkan titik hentian kerugian dan mengurangkan risiko
ringkaskan
Strategi ini menggunakan indikator RSI untuk menilai keadaan, dan menetapkan hentian dan hentian yang munasabah. Ia dapat menilai trend dengan berkesan, mengawal risiko perdagangan, dan sesuai untuk digunakan sebagai strategi penjejakan berbilang kepala. Ia dapat meningkatkan kestabilan strategi dengan cara penapisan isyarat, ujian parameter, pengoptimuman hentian dan sebagainya.
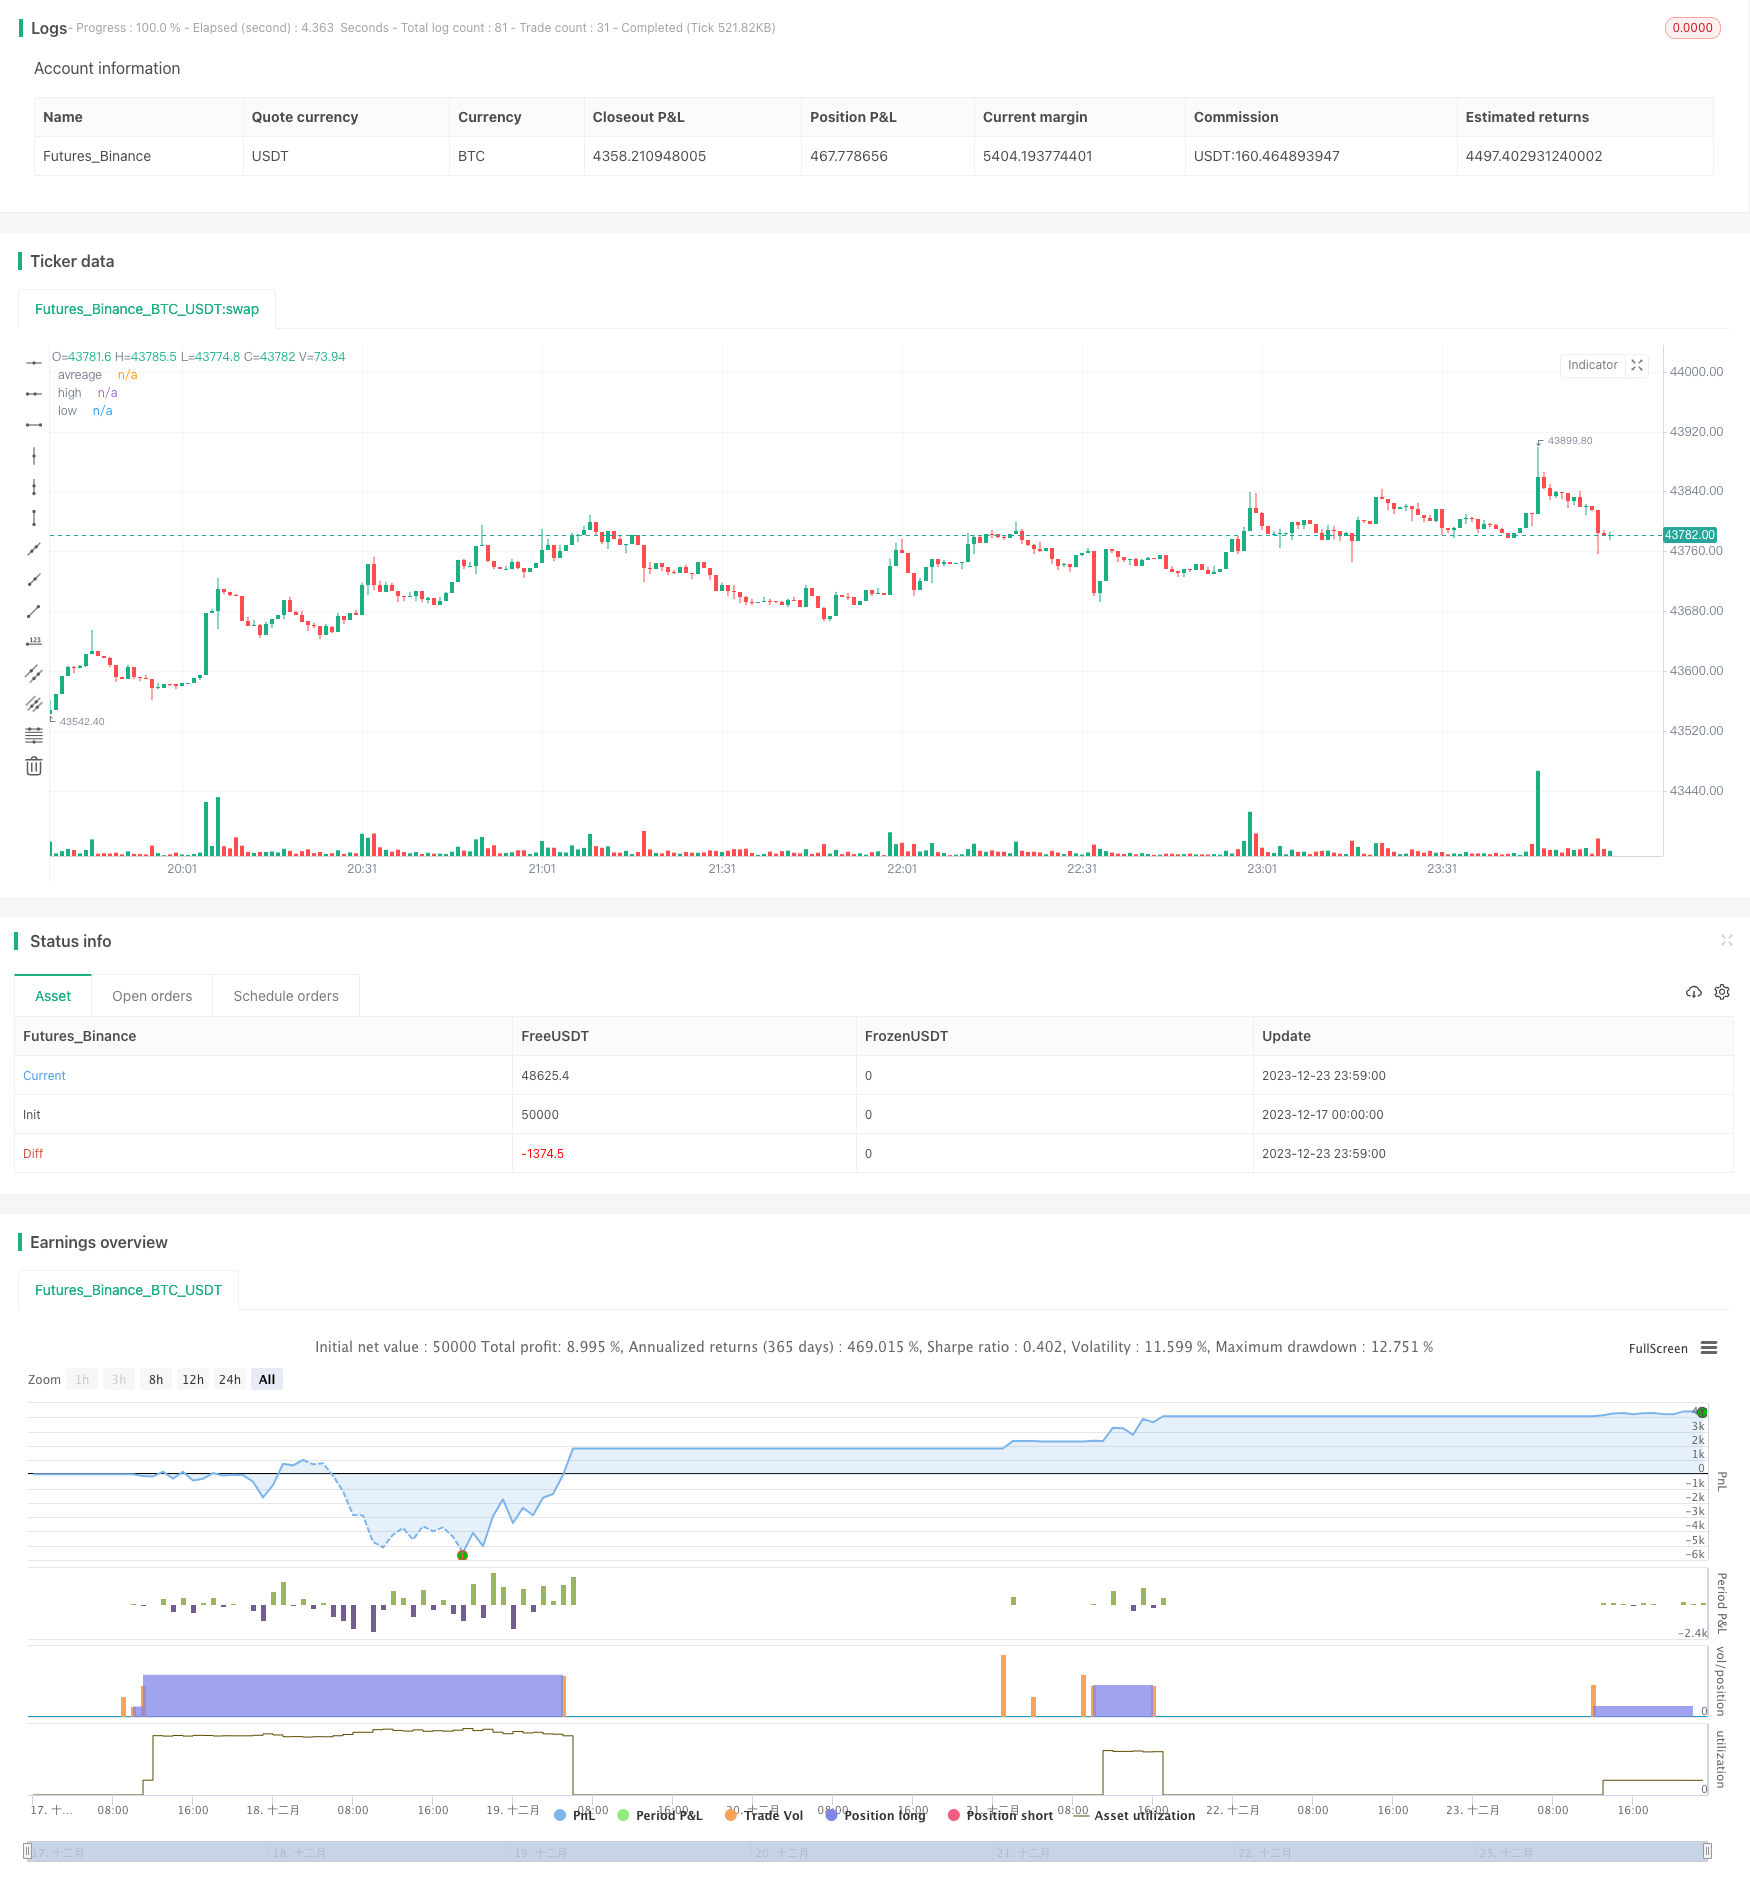
/*backtest
start: 2023-12-17 00:00:00
end: 2023-12-24 00:00:00
period: 1m
basePeriod: 1m
exchanges: [{"eid":"Futures_Binance","currency":"BTC_USDT"}]
*/

// This source code is subject to the terms of the Mozilla Public License 2.0 at https://mozilla.org/MPL/2.0/

//@version=5

strategy(title='RSI Long Strategy', overlay=true, pyramiding=5, initial_capital=10000, default_qty_type=strategy.percent_of_equity, default_qty_value=100, calc_on_order_fills=false, slippage=0, commission_type=strategy.commission.percent, commission_value=0.075)
strat_dir_input = input.string(title='Strategy Direction', defval='long', options=['long', 'short', 'all'])
strat_dir_value = strat_dir_input == 'long' ? strategy.direction.long : strat_dir_input == 'short' ? strategy.direction.short : strategy.direction.all
strategy.risk.allow_entry_in(strat_dir_value)
//INPUTS


length = input(21)
overSold = input(20)
overBought = input(80)
p = close

vrsi = ta.rsi(p, length)
price = close
var bool long = na
var bool short = na

long := ta.crossover(vrsi, overSold)
short := ta.crossunder(vrsi, overBought)

var float last_open_long = na
var float last_open_short = na

last_open_long := long ? close : nz(last_open_long[1])
last_open_short := short ? close : nz(last_open_short[1])
mpoint=(last_open_long+last_open_short)/2

entry_value = last_open_long
entry_value1 = last_open_short

// Rounding levels to min tick
nround(x) =>
    n = math.round(x / syminfo.mintick) * syminfo.mintick
    n
//
disp_panels = input(true, title='Display info panels?')
fibs_label_off = input(40, title='fibs label offset')
fibs_label_size = input.string(size.normal, options=[size.tiny, size.small, size.normal, size.large, size.huge], title='fibs label size')
r1_x = timenow + math.round(ta.change(time) * fibs_label_off)
r1_y = last_open_short
text1 = 'High : ' + str.tostring(nround(last_open_short))
s1_y = last_open_long
text3 = 'low : ' + str.tostring(nround(last_open_long))

R1_label = disp_panels ? label.new(x=r1_x, y=r1_y, text=text1, xloc=xloc.bar_time, yloc=yloc.price, color=color.orange, style=label.style_label_down, textcolor=color.black, size=fibs_label_size) : na
S1_label = disp_panels ? label.new(x=r1_x, y=s1_y, text=text3, xloc=xloc.bar_time, yloc=yloc.price, color=color.lime, style=label.style_label_up, textcolor=color.black, size=fibs_label_size) : na

label.delete(R1_label[1])
label.delete(S1_label[1])
//
plot(mpoint, title='avreage', color=color.new(color.red, 40), style=plot.style_linebr, linewidth=3, trackprice=true, offset=-9999)
plot(last_open_short, title='high', color=color.new(color.red, 40), style=plot.style_linebr, linewidth=3, trackprice=true, offset=-9999)
plot(last_open_long, title='low', color=color.new(color.blue, 40), style=plot.style_linebr, linewidth=3, trackprice=true, offset=-9999)
//
trend = input(false)
if barstate.islast and trend == true
    line z = line.new(bar_index[1], last_open_short[1], bar_index, last_open_short, extend=extend.both, color=color.red, style=line.style_dashed, width=1)
    line f = line.new(bar_index[1], mpoint[1], bar_index, mpoint, extend=extend.both, color=color.blue, style=line.style_dashed, width=1)
    line w = line.new(bar_index[1], last_open_long[1], bar_index, last_open_long, extend=extend.both, color=color.green, style=line.style_dashed, width=1)
    line.delete(z[1])
    line.delete(f[1])
    line.delete(w[1])

//bu = ta.crossover(close, mpoint)
//sz = ta.crossunder(close, mpoint)
//bu1 = ta.crossover(close, last_open_short)
sz1 = ta.crossunder(close, last_open_short)
bu2 = ta.crossover(close, last_open_long)
//sz2 = ta.crossunder(close, last_open_long)
//plotshape(sz, style=shape.triangledown, location=location.abovebar, color=color.new(color.orange, 0), size=size.tiny)
//plotshape(bu, style=shape.triangleup, location=location.belowbar, color=color.new(color.blue, 0), size=size.tiny)
//plotshape(sz1, style=shape.triangledown, location=location.abovebar, color=color.new(color.red, 0), size=size.tiny)
//plotshape(bu1, style=shape.triangleup, location=location.belowbar, color=color.new(color.green, 0), size=size.tiny)
//plotshape(sz2, style=shape.triangledown, location=location.abovebar, color=color.new(color.red, 0), size=size.tiny)
//plotshape(bu2, style=shape.triangleup, location=location.belowbar, color=color.new(color.green, 0), size=size.tiny)

l = bu2
s = sz1
if l
    strategy.entry('buy', strategy.long)
if s
    strategy.entry('sell', strategy.short)
per(pcnt) =>
    strategy.position_size != 0 ? math.round(pcnt / 100 * strategy.position_avg_price / syminfo.mintick) : float(na)
stoploss = input.float(title=' stop loss', defval=5, minval=0.01)
los = per(stoploss)
q1 = input.int(title=' qty_percent1', defval=50, minval=1)
q2 = input.int(title=' qty_percent2', defval=50, minval=1)
tp1 = input.float(title=' Take profit1', defval=3, minval=0.01)
tp2 = input.float(title=' Take profit2', defval=5, minval=0.01)
//tp4 = input.float(title=' Take profit4', defval=5, minval=0.01)
strategy.exit('x1', qty_percent=q1, profit=per(tp1), loss=los)
strategy.exit('x2', qty_percent=q2, profit=per(tp2), loss=los)