Strategi Melintasi Saluran Mudah Alih Vegas
Tarikh penciptaan:
2024-01-02 10:53:06
Akhirnya diubah suai:
2024-01-02 10:53:06
Salin:
7
Bilangan klik:
1491
1
fokus pada
1750
Pengikut
Idea teras strategi ini adalah untuk menilai arah trend jangka pendek dan jangka panjang saham berdasarkan garis rata-rata yang berbeza seperti EMA 36,143,169 dan seterusnya, digabungkan dengan penunjuk MACD untuk menghantar isyarat jual beli. Khususnya, penilaian jangka pendek dengan EMA 5-10 hari, penilaian jangka menengah dengan EMA 20-60 hari, penilaian jangka panjang dengan EMA 120-250 hari, melihat lebih tinggi dan lebih rendah apabila EMA jangka pendek melintasi EMA pertengahan; digabungkan dengan penunjuk kosong MACD untuk menentukan masa jual beli.
Strategi Vegas Tunnel ini berbunyi:
- Menggunakan EMA36 dan EMA43 untuk membuat penilaian trend jangka pendek, yang membentuk saluran merah;
- Menggunakan EMA144 dan EMA169 untuk membuat penilaian trend jangka menengah, yang membentuk saluran hijau;
- Menggunakan EMA576 dan EMA676 untuk membuat penilaian trend jangka panjang, yang membentuk saluran kelabu;
- Apabila harga berhenti pada setiap garis EMA, ia boleh melakukan lebih banyak, dan kemudian menggabungkan indikator MACD ke atas untuk menerobos 0 dan menghantar isyarat beli;
- Apabila harga jatuh di setiap garis rata-rata EMA, ia boleh dibuat kosong, dan kemudian digabungkan dengan penunjuk MACD ke bawah untuk memecahkan 0 dan menghantar isyarat jual.
- Tiga strategi dagangan yang berbeza, masing-masing sesuai dengan tempoh pegangan yang berbeza, dibahagikan kepada tiga strategi dagangan pendek dan panjang berdasarkan tempoh rata-rata EMA yang dilalui.
Kelebihan strategi ini ialah:
- Ia adalah lebih stabil apabila ia digabungkan dengan tiga saluran: pendek, sederhana dan panjang.
- Vegas Channel jelas dan intuitif, mudah untuk menilai trend.
- Dengan menggunakan MACD, anda dapat mengetahui masa terbaik untuk membeli dan menjual.
- Ia adalah satu strategi yang boleh digunakan dengan lebih banyak fleksibiliti.
Risiko utama strategi ini ialah:
- EMA rata-rata menghasilkan ketinggalan ketika harga saham bergelombang dengan kuat, dan kemungkinan besar membuat kesalahan.
- Apabila tiga saluran itu tidak sepadan, terdapat risiko kesilapan operasi.
- Mengendalikan peta masa memerlukan daya tahan mental yang kuat.
Cara untuk menangani masalah ini:
- Anda boleh menyesuaikan kitaran EMA rata-rata dengan lebih sesuai dengan ciri pasaran semasa.
- Menyesuaikan peratusan pegangan sebelum dagangan, mengawal kerugian tunggal.
Ini adalah strategi yang boleh dioptimumkan:
- Vegas Tunnel tidak mencukupi untuk menentukan trend, tetapi ia boleh diperkenalkan sebagai penilaian tambahan untuk Brink Tunnel.
- Penunjuk MACD tidak berkesan untuk pergerakan pergerakan yang tidak stabil, dan boleh digantikan dengan penunjuk KD, RSI dan lain-lain.
- Tambah strategi hentikan kerugian, seperti hentikan aktif apabila harga penutupan jatuh di bawah EMA kritikal.
- Kesan kejatuhan A saham yang besar, boleh dipertimbangkan untuk lindung nilai shorting ETF.
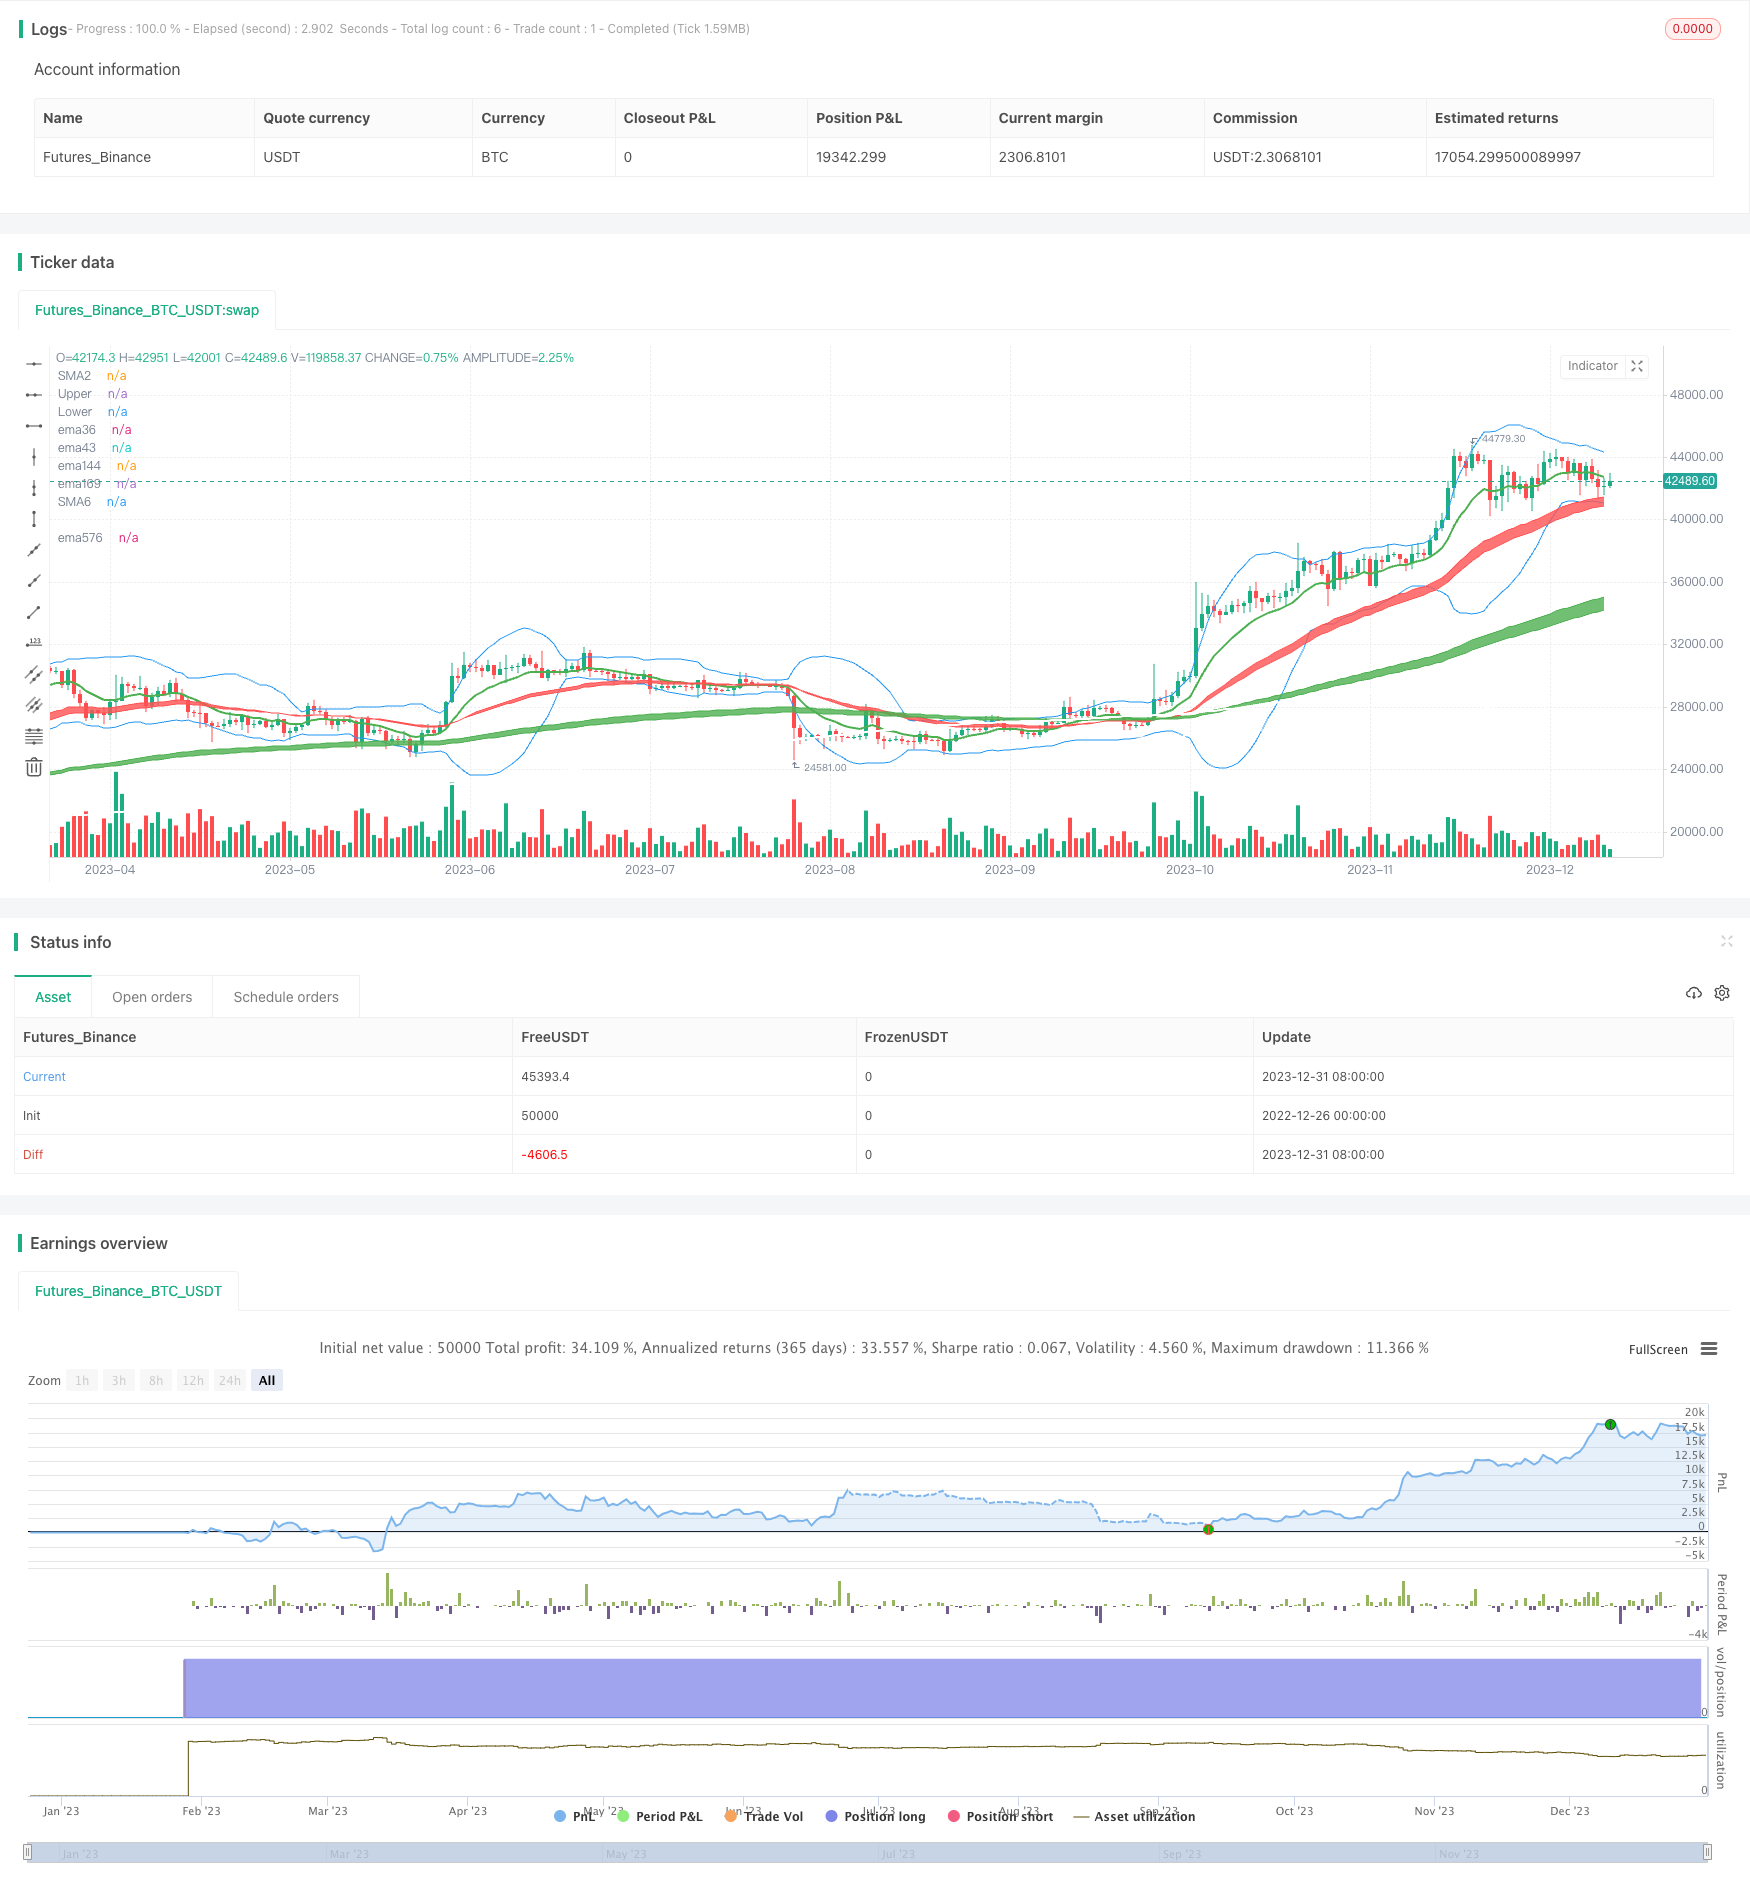
Kod sumber strategi
/*backtest
start: 2022-12-26 00:00:00
end: 2024-01-01 00:00:00
period: 1d
basePeriod: 1h
exchanges: [{"eid":"Futures_Binance","currency":"BTC_USDT"}]
*/

//@version=4

strategy("Vegas Tunnel strategy", overlay=true)
//-------------------------------------------
//-------------------------------------------
// Inputs
useCurrentRes = input(true, title="Use Current Chart Resolution?")
resCustom = input(title="Use Different Timeframe? Uncheck Box Above", type=input.resolution, defval="D")
//tfSet = input(title = "Time Frame", options=["Current","120", "240", "D", "W"], defval="D")
tfSet = useCurrentRes ? timeframe.period : resCustom
maPeriods2 = input(12, "12 EMA")
maPeriods6 = input(240, "240 SMA")
BBlength = input(20, title="BB Length", minval=1)
BBsrc = input(close, title="BB Source")
mult = input(2.0, minval=0.001, maxval=50, title="BB StdDev")
sm2 = security(syminfo.tickerid, tfSet, ema(close, maPeriods2))
sm6 = security(syminfo.tickerid, tfSet, sma(close, maPeriods6))
p2 = plot(sm2, color=color.green, transp=30,  linewidth=2, title="SMA2")
p6 = plot(sm6, color=color.white, transp=30,  linewidth=2, title="SMA6")
//BB
basis = sma(BBsrc, BBlength)
dev = mult * stdev(BBsrc, BBlength)
upper = basis + dev
lower = basis - dev
offset = input(0, "BB Offset", type = input.integer, minval = -500, maxval = 500)
//plot(basis, "Basis", color=color.blue,linewidth, offset = offset)
pBB1 = plot(upper, "Upper", color=color.blue, offset = offset)
pBB2= plot(lower, "Lower", color=color.blue, offset = offset)

//MACD
fast_ma = ema(close, 48)
slow_ma = ema(close, 56)
macd = fast_ma - slow_ma

//vagas隧道
f1=ema(close, 36)
f2=ema(close, 43)
f3=ema(close, 144)
f4=ema(close, 169)
f5=ema(close, 576)
f6=ema(close, 676)
f7=ema(close,2304)
z1=plot(f1,color=color.red, title="ema36",transp=100)
z2=plot(f2,color=color.red, title="ema43",transp=100)
z3=plot(f3,color=color.green, title="ema144",transp=100)
z4=plot(f4,color=color.green, title="ema169",transp=100)
z5=plot(f5,color=color.white, title="ema576",transp=100)
z6=plot(f6,color=color.white, title="ema676",transp=100)
fill(z1, z2, color=color.red,transp=60)
fill(z3, z4, color=color.green,transp=60)
fill(z5, z6, color=color.gray,transp=60)

// Make input options that configure backtest date range
startDate = input(title="Start Date", type=input.integer,
     defval=1, minval=1, maxval=31)
startMonth = input(title="Start Month", type=input.integer,
     defval=1, minval=1, maxval=12)
startYear = input(title="Start Year", type=input.integer,
     defval=2018, minval=1800, maxval=2100)
endDate = input(title="End Date", type=input.integer,
     defval=1, minval=1, maxval=31)
endMonth = input(title="End Month", type=input.integer,
     defval=11, minval=1, maxval=12)
endYear = input(title="End Year", type=input.integer,
     defval=2030, minval=1800, maxval=2100)
// Look if the close time of the current bar
// falls inside the date range
inDateRange =  true

//波段多
if (inDateRange and crossunder(f3,f1))//
    strategy.entry("buy", strategy.long,1, when=macd>0, comment = "買Long-term")
buyclose=crossunder(f3,f5)
strategy.close("buy", when = buyclose, comment = "關Long-term")
//多策略1
if (inDateRange and crossover(low , f3) and macd>0 and f3>f6)
    strategy.entry("buy1", strategy.long,100, comment = "買Mid-term")
buyclose1=crossunder(close,upper*0.999)
if (macd<0 or f3<f6)
    strategy.close("buy1", comment = "關Mid-term")
//strategy.close("buy1",when=cross(basis,close), comment = "關M",qty_percent=50)
strategy.close("buy1", when = buyclose1, comment = "關Mid-term",qty_percent=100)
//多策略3
if (inDateRange and  (macd>0) and crossunder(low,f1) and f1>f4) //
    strategy.entry("buy3", strategy.long,1, comment = "買Short-term")
buyclose3=crossunder(close,upper*0.999)
if (macd<0 or f1<f4)
    strategy.close("buy3", comment = "關Short-term")
strategy.close("buy3", when = buyclose3, comment = "關Short-term")
//多策略4
if (inDateRange and  (macd>0) and crossunder(low,f5) and f4>f5) //
    strategy.entry("buy4", strategy.long,1, comment = "買Long-term")
buyclose4=crossunder(close,upper*0.999)
if (macd<0 or f4<f6)
    strategy.close("buy4", comment = "關Long-term")
strategy.close("buy4", when = buyclose4, comment = "關Long-term")

//空策略1
if (inDateRange and  (macd<0) and crossunder(high,f1) and f1<f3 and f3<f6) //
    strategy.entry("sell1", strategy.short,1, comment = "空Short-term")
sellclose1=crossunder(lower*0.999,close)
if (macd>0 or f1>f4)
    strategy.close("sell1", comment = "關空Short-term")
strategy.close("sell1", when = sellclose1, comment = "關空Short-term")
//空策略2
if (inDateRange and  (macd<0) and crossunder(high,f4) and f4<f6) //
    strategy.entry("sell2", strategy.short,1, comment = "空Mid-term")
sellclose2=crossunder(lower,close)
if (macd>0 or f4>f6)
    strategy.close("sell2", comment = "關空Mid-term")
strategy.close("sell2", when = sellclose2, comment = "關Mid-term")
//空策略3
if (inDateRange and (macd<0) and crossunder(high,f6)) //
    strategy.entry("sell3", strategy.short,1, comment = "空Long-term")
sellclose3=crossunder(lower,close)
if (macd>0 or f6>f7)
    strategy.close("sell3", comment = "關空Long-term")
strategy.close("sell3", when = sellclose3, comment = "關空Long-term")