Adaptive trailing stop trend mengikuti strategi berdasarkan ATR dan RSI
Gambaran keseluruhan
Strategi ini menggabungkan penggunaan jangkauan rata-rata pergerakan sebenar ((ATR), indeks kekuatan relatif ((RSI) dan berhenti bergerak untuk mencapai trend yang menyesuaikan diri. Menggunakan ATR untuk mengira titik berhenti dinamik, menggunakan RSI untuk menentukan arah trend pasaran, berhenti bergerak untuk mengikuti turun naik harga untuk memaksimumkan keuntungan.
Prinsip Strategi
Mengira ATR. ATR mencerminkan turun naik pasaran dan tahap risiko. Strategi ini mengira tahap berhenti dinamik melalui ATR, untuk mencapai berhenti beradaptasi.
Mengira RSI. RSI dapat menentukan fenomena jual beli yang berlebihan di pasaran. Apabila RSI lebih besar daripada 50 adalah bullish, dan kurang daripada 50 adalah bearish.
Hentian bergerak mengesan. Strategi ini berdasarkan kedudukan hentian yang dikira oleh ATR dan arah trend yang dinilai oleh RSI, untuk mencapai hentian bergerak terus mengesan turun naik harga, sambil menjamin hentian, secara beransur-ansur meningkatkan kedudukan hentian, untuk memaksimumkan keuntungan.
Khususnya, apabila RSI lebih besar daripada 50 untuk membuka lebih banyak kedudukan, kurang daripada 50 untuk membuka kosong. Kemudian menggunakan harga hentian yang dikira oleh ATR untuk bergerak berhenti, dan mengesan pergerakan harga.
Analisis kelebihan
Dengan menggunakan ATR untuk mewujudkan penutupan yang sesuai, anda boleh menyesuaikan lebar penutupan mengikut dinamika pasaran yang tidak menentu, dan mengelakkan penutupan yang terlalu besar.
RSI menilai arah trend dengan tepat dan boleh dipercayai untuk mengelakkan perdagangan terjebak dalam pasaran yang bergolak.
Hentian mudah alih mengesan turun naik harga, dapat meningkatkan kedudukan hentian, dan mengikuti trend untuk mendapatkan keuntungan.
Analisis risiko
Tetapan parameter ATR dan RSI perlu dioptimumkan melalui ujian semula, jika tidak, ia akan menjejaskan kesan strategi.
Walaupun terdapat perlindungan hentian kerugian, risiko yang tidak dapat dielakkan adalah risiko yang akan menyebabkan hentian kerugian ditembusi. Kedudukan boleh dikurangkan dengan sewajarnya untuk mengawal risiko.
Strategi bergantung pada parameter pengoptimuman varieti perdagangan yang lebih besar dan memerlukan parameter penyesuaian untuk varieti yang berbeza.
Arah pengoptimuman
Algoritma pembelajaran mesin boleh dipertimbangkan untuk mencapai optimasi penyesuaian parameter.
Tambah modul kawalan kedudukan yang dapat menyesuaikan saiz kedudukan secara dinamik mengikut keadaan pasaran, mengurangkan kebarangkalian untuk memecahkan stop loss.
Menambah indikator trend untuk mengelakkan kehilangan titik balik.
ringkaskan
Strategi ini mengintegrasikan penggunaan modul seperti ATR, RSI dan berhenti bergerak untuk membentuk strategi trend pemantauan yang khas. Dengan pengoptimuman parameter, strategi ini dapat menyesuaikan diri dengan sangat fleksibel untuk pelbagai jenis perdagangan, dan merupakan strategi pemantauan trend umum yang disyorkan. Kesan strategi ini dapat ditingkatkan lagi dengan menambahkan lebih banyak penilaian indikator dan pengoptimuman algoritma pembelajaran mesin.
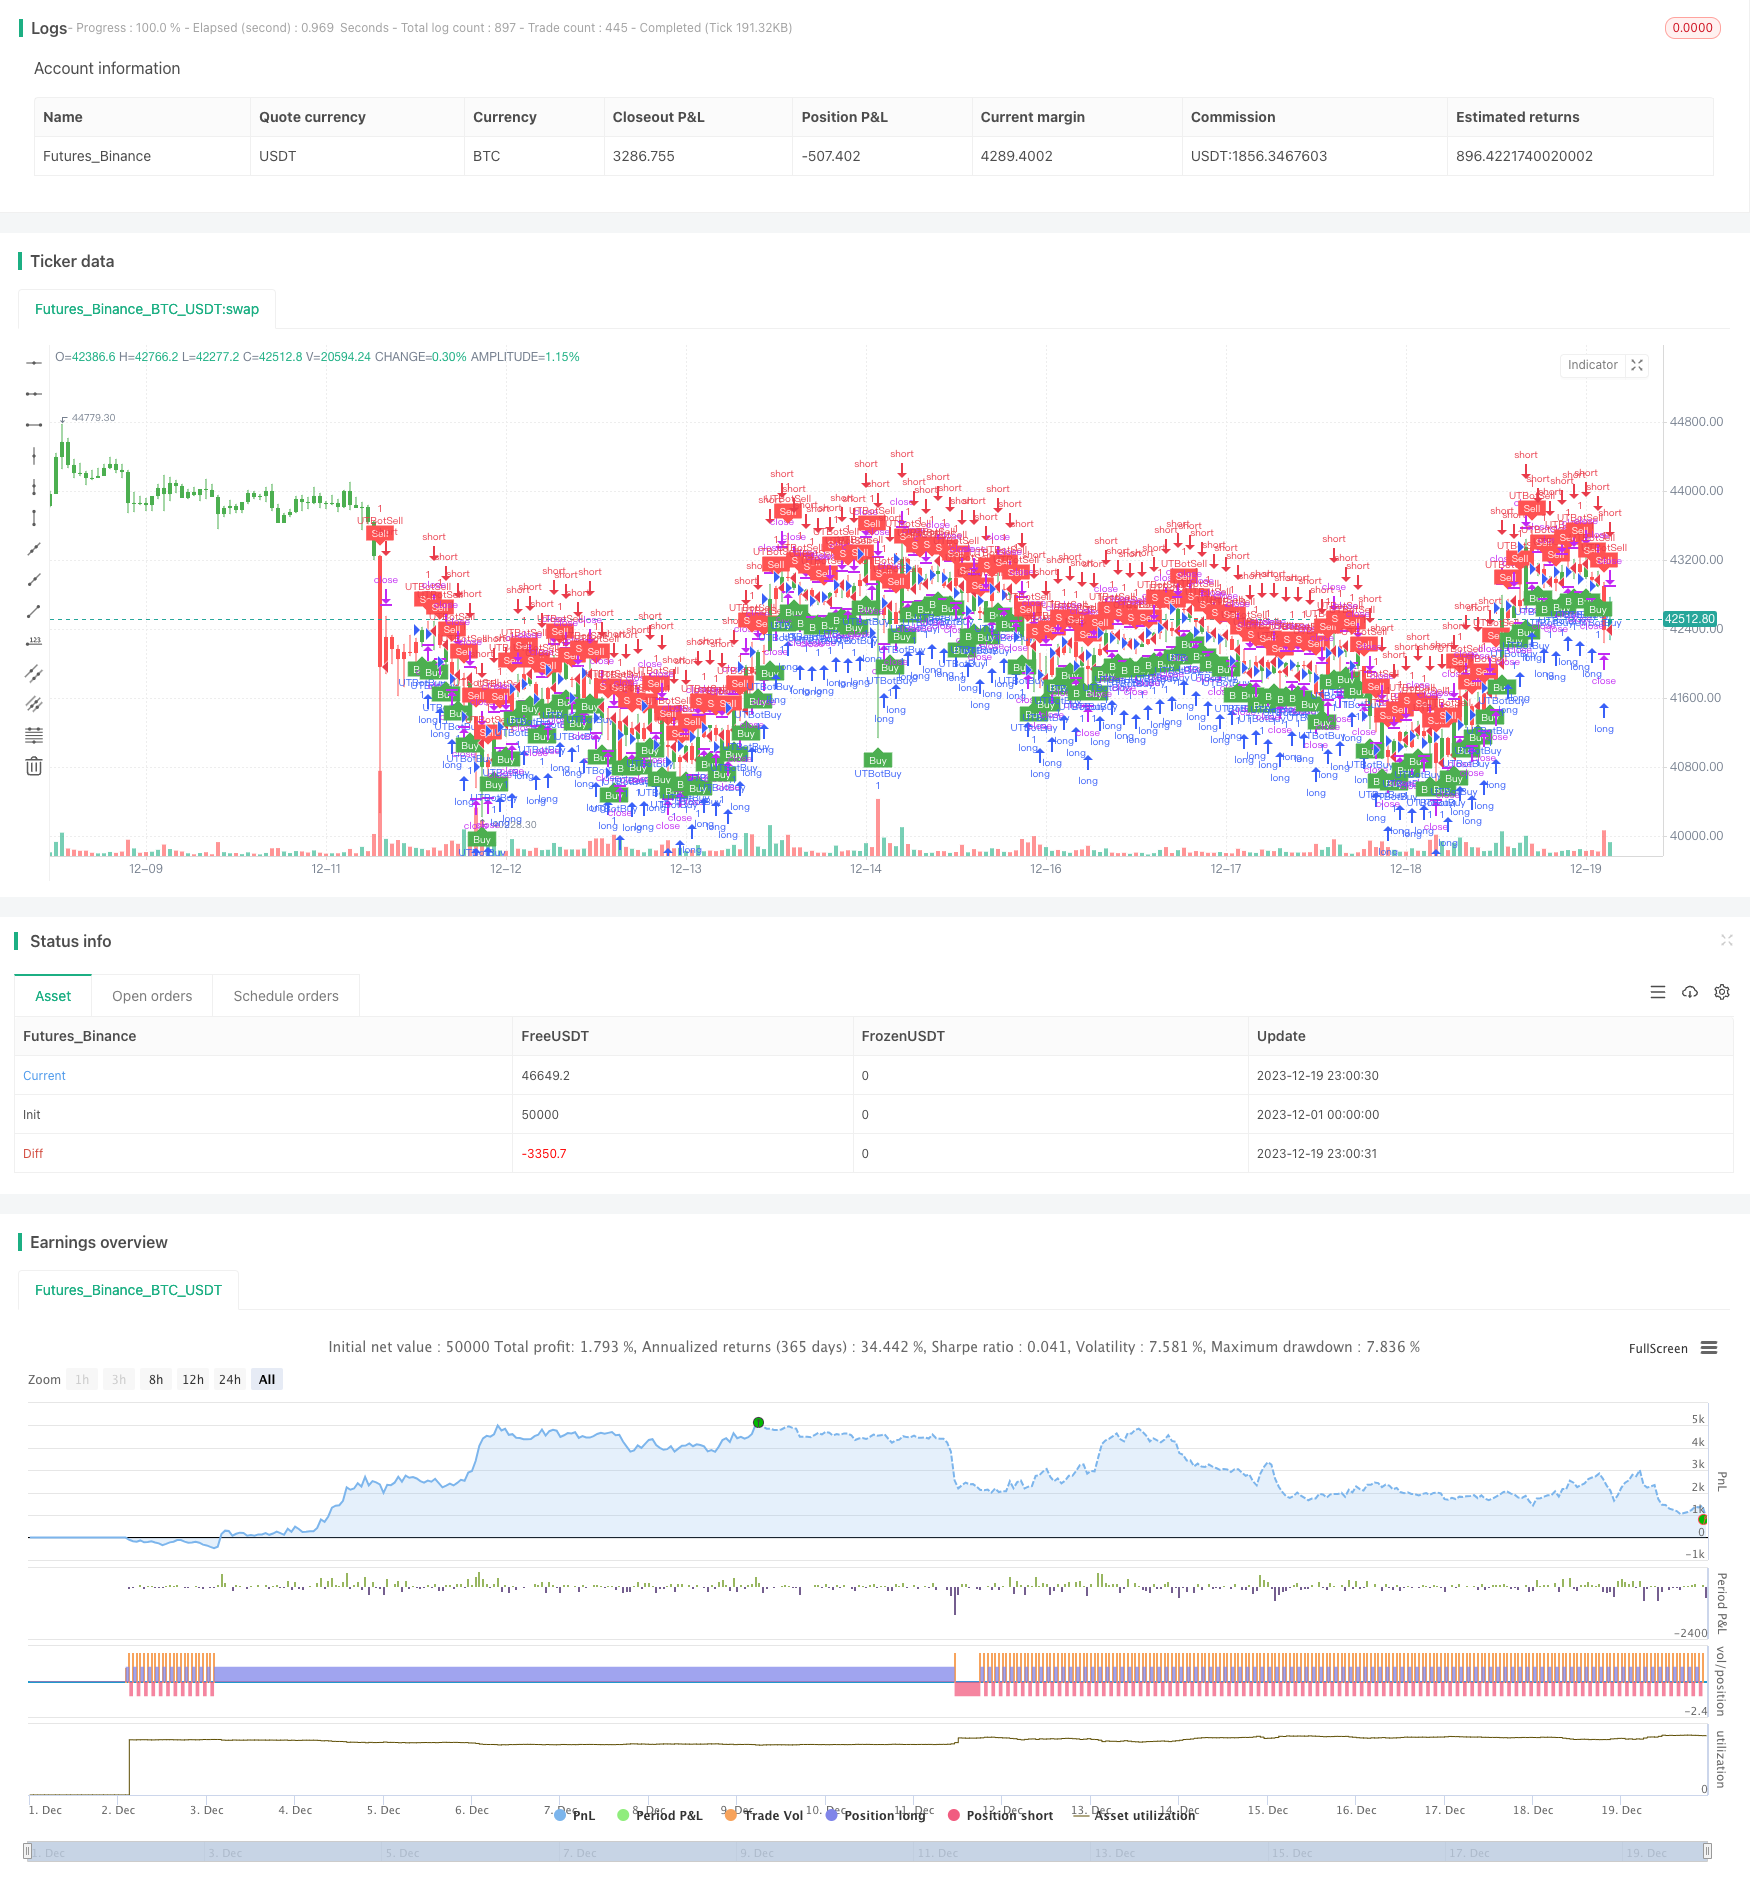
/*backtest
start: 2023-12-01 00:00:00
end: 2023-12-19 23:59:59
period: 1h
basePeriod: 15m
exchanges: [{"eid":"Futures_Binance","currency":"BTC_USDT"}]
*/

//@version=2
strategy(title="UTBot Strategy", overlay = true )

// CREDITS to @HPotter for the orginal code.
// CREDITS to @Yo_adriiiiaan for recently publishing the UT Bot study based on the original code -
// CREDITS to @TradersAITradingPlans for making this Strategy.
// Strategy fixed with Time period by Kirk65.
// I am using this UT bot with 2 hours time frame with god resultss. Alert with "Once per bar" and stoploss 1.5%. If Alerts triggered and price goes against Alert. Stoploss will catch it. Wait until next Alert.
// While @Yo_adriiiiaan mentions it works best on a 4-hour timeframe or above, witch is a lot less risky, but less profitable.

testStartYear = input(2019, "BACKTEST START YEAR", minval = 1980, maxval = 2222)
testStartMonth = input(01, "BACKTEST START MONTH", minval = 1, maxval = 12)
testStartDay = input(01, "BACKTEST START DAY", minval = 1, maxval = 31)
testPeriodStart = timestamp(testStartYear,testStartMonth,testStartDay,0,0)
testStopYear = input(2222, "BACKTEST STOP YEAR", minval=1980, maxval = 2222)
testStopMonth = input(12, "BACKTEST STOP MONTH", minval=1, maxval=12)
testStopDay = input(31, "BACKTEST STOP DAY", minval=1, maxval=31)
testPeriodStop = timestamp(testStopYear, testStopMonth, testStopDay, 0, 0)

testPeriod = true

SOURCE = input(hlc3)
RSILENGTH = input(14, title = "RSI LENGTH")
RSICENTERLINE = input(52, title = "RSI CENTER LINE")
MACDFASTLENGTH = input(7, title = "MACD FAST LENGTH")
MACDSLOWLENGTH = input(12, title = "MACD SLOW LENGTH")
MACDSIGNALSMOOTHING = input(12, title = "MACD SIGNAL SMOOTHING")
a = input(10, title = "Key Vaule. 'This changes the sensitivity'")
SmoothK = input(3)
SmoothD = input(3)
LengthRSI = input(14)
LengthStoch = input(14)
RSISource = input(close)
c = input(10, title="ATR Period")
xATR = atr(c)
nLoss = a * xATR
xATRTrailingStop = iff(close > nz(xATRTrailingStop[1], 0) and close[1] > nz(xATRTrailingStop[1], 0), max(nz(xATRTrailingStop[1]), close - nLoss),
     iff(close < nz(xATRTrailingStop[1], 0) and close[1] < nz(xATRTrailingStop[1], 0), min(nz(xATRTrailingStop[1]), close + nLoss),
     iff(close > nz(xATRTrailingStop[1], 0), close - nLoss, close + nLoss)))
pos =	iff(close[1] < nz(xATRTrailingStop[1], 0) and close > nz(xATRTrailingStop[1], 0), 1,
     iff(close[1] > nz(xATRTrailingStop[1], 0) and close < nz(xATRTrailingStop[1], 0), -1, nz(pos[1], 0)))
color = pos == -1 ? red: pos == 1 ? green : blue
ema= ema(close,1)
above = crossover(ema,xATRTrailingStop )
below = crossover(xATRTrailingStop,ema)
buy = close > xATRTrailingStop and above
sell = close < xATRTrailingStop and below
barbuy = close > xATRTrailingStop
barsell = close < xATRTrailingStop
plotshape(buy, title = "Buy", text = 'Buy', style = shape.labelup, location = location.belowbar, color= green,textcolor = white, transp = 0, size = size.tiny)
plotshape(sell, title = "Sell", text = 'Sell', style = shape.labeldown, location = location.abovebar, color= red,textcolor = white, transp = 0, size = size.tiny)
barcolor(barbuy? green:na)
barcolor(barsell? red:na)
//alertcondition(buy, title='Buy', message='Buy')
//alertcondition(sell, title='Sell', message='Sell')

if (buy)
    strategy.entry("UTBotBuy",strategy.long, when=testPeriod)
if (sell)
    strategy.entry("UTBotSell",strategy.short, when=testPeriod)