Strategi Penunjuk Murphy yang Mengembara Melalui Masa dan Angkasa
Gambaran keseluruhan
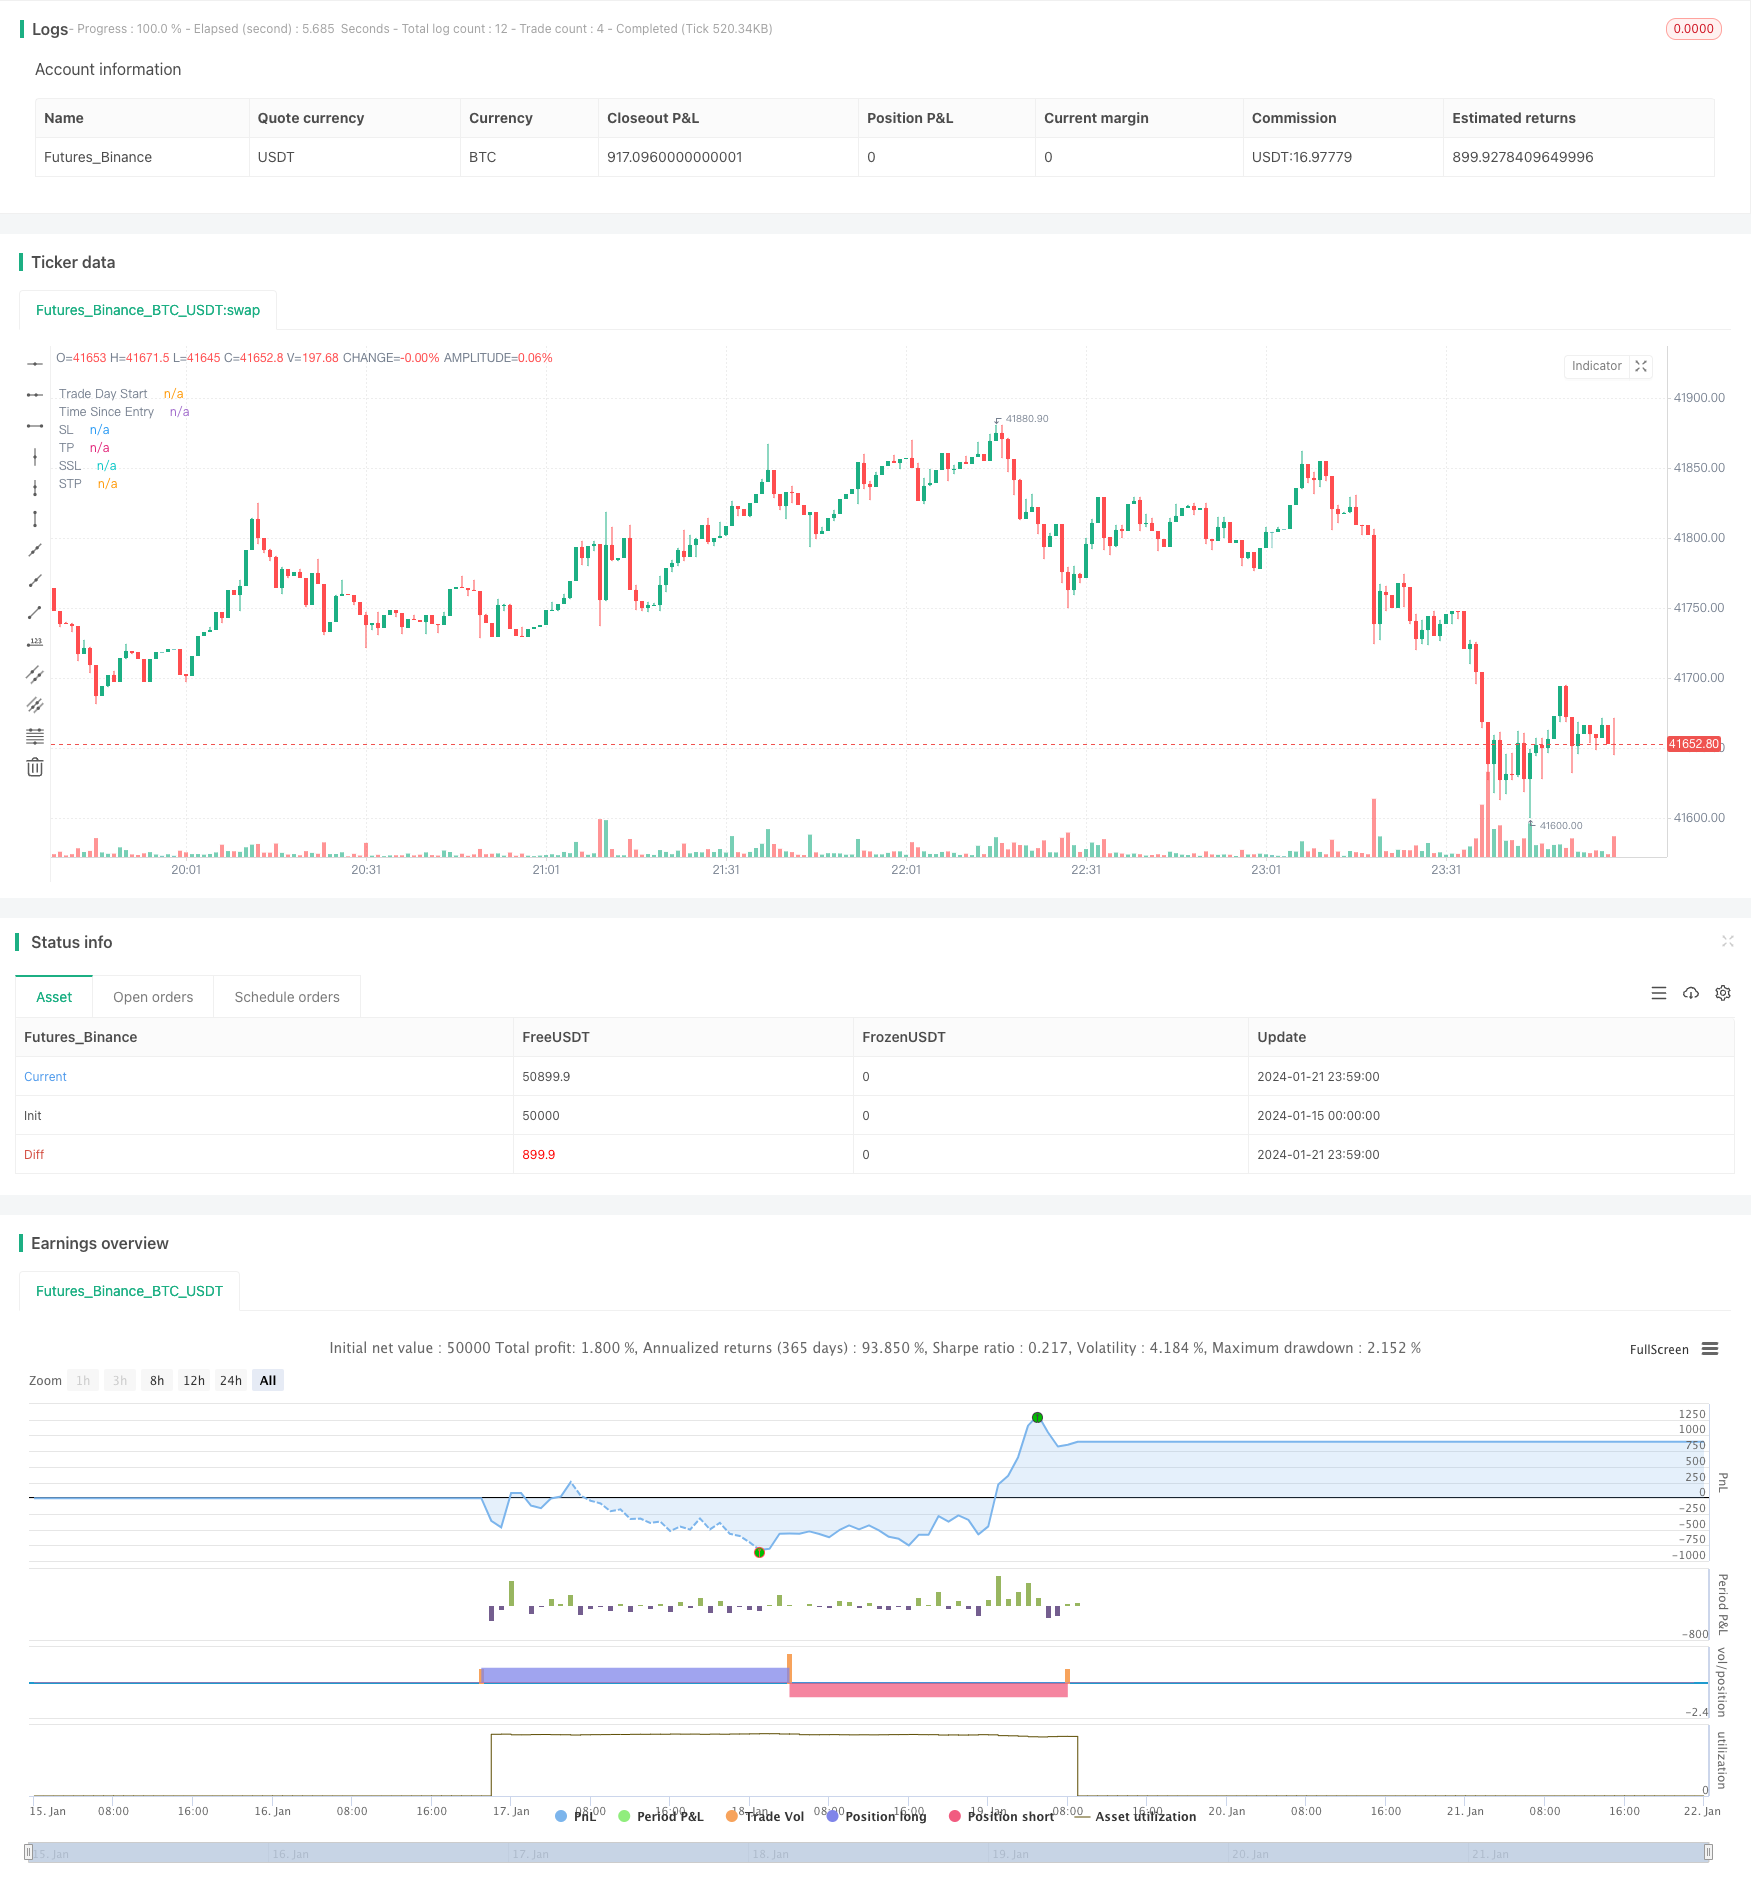
Ini adalah strategi kuantitatif mudah yang menggunakan Morpheus untuk mengenal pasti ikan paus besar di pasaran. Ia berlaku dalam jangka masa 5 minit dan digunakan terutamanya untuk perdagangan cryptocurrency.
Prinsip Strategi
Strategi ini menggunakan indikator Morpheus dengan panjang 3, menetapkan garis overbought menjadi 100 dan garis oversold menjadi 0. Strategi ini menunggu indikator Morpheus mencapai tahap overbought, yang menunjukkan adanya ikan paus besar di pasaran. Jika dua indikator Morpheus melebihi titik beli hari sebelumnya, harga masih dapat mengekalkan momentum, maka ini adalah isyarat masuk ke pasaran.
Apabila indeks Mofi = 100 dan akar K adalah garis besar, masuk lebih banyak. Garis berhenti ditetapkan sebagai titik terendah pada hari perdagangan, berhenti dalam 60 minit selepas masuk.
Untuk melakukan shorting, anda boleh menggunakan logik cermin. Iaitu, apabila indikator Mofi mencapai oversold, apabila garis K akar adalah garis besar, masuklah ke dalam shorting.
Kelebihan Strategik
Penggunaan petunjuk Morpheus dapat mengesan dengan berkesan tingkah laku penimbunan potensi saham ikan paus besar di pasaran, yang mungkin akan terus meningkat.
Dengan menggunakan titik penembusan yang lebih kuat untuk mengenal pasti entiti K, banyak penembusan palsu boleh ditapis.
Dengan menggunakan penapis SMA, anda dapat mengurangkan risiko perdagangan dengan mengelakkan membeli saham yang sedang menurun.
Dengan menggunakan kaedah operasi ultra-pendek dalam sehari, penangguhan 60 minit dapat mengunci keuntungan dengan cepat dan mengurangkan kebarangkalian penarikan balik.
Risiko Strategik
Penunjuk Morpheus mungkin menghasilkan isyarat palsu, menyebabkan kerugian yang tidak perlu. Anda boleh menyesuaikan parameter dengan sewajarnya atau menambah penunjuk lain untuk penapisan.
METHOD 60 minit mungkin terlalu radikal dan tidak sesuai untuk saham yang mempunyai kadar turun naik yang tinggi. Anda boleh menyesuaikan waktu hentian dengan sewajarnya atau menggunakan hentian bergerak untuk mengoptimumkannya.
Tidak mengambil kira risiko kejutan pasaran apabila berlaku peristiwa ekonomi makro utama. Strategi ini harus ditangguhkan dan perdagangan harus diteruskan sehingga pasaran kembali stabil.
Arah pengoptimuman strategi
Kombinasi parameter yang berbeza boleh diuji, seperti menyesuaikan panjang indikator Morpheus, mengoptimumkan parameter kitaran SMA, dan sebagainya.
Cuba tambahkan penunjuk lain untuk kombinasi, seperti saluran BOLL, penunjuk KD, dan lain-lain, untuk melihat sama ada anda boleh meningkatkan ketepatan isyarat.
Ujian untuk melihat sama ada anda boleh mendapatkan keuntungan tunggal yang lebih besar dengan mengurangkan stop loss dengan betul.
Cuba untuk membangunkan versi yang sesuai untuk kitaran lain berdasarkan kerangka strategi ini, seperti versi 15 minit atau 30 minit.
ringkaskan
Strategi ini secara keseluruhan sangat ringkas dan mudah difahami, idea asasnya selaras dengan idea klasik untuk mengesan ikan paus besar. Dengan mengenal pasti titik-titik penting untuk overbought dan oversold dalam indikator Morpheus, dengan penyaringan entiti K-line, banyak bunyi bising dapat disaring. Tambahan penapis SMA juga meningkatkan kestabilan strategi.
60 Minutes Ultra-Short Line Operating Mode boleh menghasilkan keuntungan dengan cepat, tetapi juga membawa risiko operasi yang lebih tinggi. Secara keseluruhan, ini adalah templat strategi kuantitatif yang sangat bernilai dalam peperangan, bernilai kajian dan pengoptimuman yang mendalam, dan juga memberi kita idea yang berharga untuk membangunkan strategi.
/*backtest
start: 2024-01-15 00:00:00
end: 2024-01-22 00:00:00
period: 1m
basePeriod: 1m
exchanges: [{"eid":"Futures_Binance","currency":"BTC_USDT"}]
*/

// This source code is subject to the terms of the Mozilla Public License 2.0 at https://mozilla.org/MPL/2.0/

// From "Crypto Day Trading Strategy" PDF file.

// * I'm using a SMA filter to avoid buying when the price is declining. Time frame was better at 15 min according to my test.

// 1 - Apply the 3 period Money Flow Index indicator to the 5 minute chart, using 0 and 100 as our oversold and overbought boundaries
// 2 - Wait for the MFI to reach overbought levels, that indicates the presence of "big sharks" in the market. Price needs to hold up
// the first two MFI overbought occurrences of the day to be considered as a bullish entry signal.*
// 3 - We buy when the MFI = 100 and the next candle is a bullish candle with short wicks.
// 4 - We place our Stop Loss below the low of the trading day and we Take Profit during the first 60 minutes after taking the trade.

// The logic above can be used in a mirrored fashion to take short entries, this is a custom parameter that can be modified from
// the strategy Inputs panel.

// © tweakerID

//@version=4
strategy("Money Flow Index 5 min Strategy",
     overlay=true )

direction = input(0, title = "Strategy Direction", type=input.integer, minval=-1, maxval=1)
strategy.risk.allow_entry_in(direction == 0 ? strategy.direction.all : (direction < 0 ? strategy.direction.short : strategy.direction.long))

/////////////////////// STRATEGY INPUTS ////////////////////////////////////////
title1=input(true, "-----------------Strategy Inputs-------------------")

i_MFI = input(3, title="MFI Length")
OB=input(100, title="Overbought Level")
OS=input(0, title="Oversold Level")
barsizeThreshold=input(.5, step=.05, minval=.1, maxval=1, title="Bar Body Size, 1=No Wicks")
i_MAFilter = input(true, title="Use MA Trend Filter")
i_MALen = input(80, title="MA Length")
i_timedexit=input(false, title="Use 60 minutes exit rule")
short=input(true, title="Use Mirrored logic for Shorts")

/////////////////////// BACKTESTER /////////////////////////////////////////////
title2=input(true, "-----------------General Inputs-------------------")

// Backtester General Inputs
i_SL=input(true, title="Use Stop Loss and Take Profit")
i_SLType=input(defval="Strategy Stop", title="Type Of Stop", options=["Strategy Stop", "Swing Lo/Hi", "ATR Stop"])
i_SPL=input(defval=10, title="Swing Point Lookback")
i_PercIncrement=input(defval=3, step=.1, title="Swing Point SL Perc Increment")*0.01
i_ATR = input(14, title="ATR Length")
i_ATRMult = input(5, step=.1, title="ATR Multiple")
i_TPRRR = input(2.2, step=.1, title="Take Profit Risk Reward Ratio")
TS=input(false, title="Trailing Stop")

// Bought and Sold Boolean Signal
bought = strategy.position_size > strategy.position_size[1]
 or strategy.position_size < strategy.position_size[1]

// Price Action Stop and Take Profit
LL=(lowest(i_SPL))*(1-i_PercIncrement)
HH=(highest(i_SPL))*(1+i_PercIncrement)
LL_price = valuewhen(bought, LL, 0)
HH_price = valuewhen(bought, HH, 0)
entry_LL_price = strategy.position_size > 0 ? LL_price : na
entry_HH_price = strategy.position_size < 0 ? HH_price : na
tp=strategy.position_avg_price + (strategy.position_avg_price - entry_LL_price)*i_TPRRR
stp=strategy.position_avg_price - (entry_HH_price - strategy.position_avg_price)*i_TPRRR

// ATR Stop
ATR=atr(i_ATR)*i_ATRMult
ATRLong = ohlc4 - ATR
ATRShort = ohlc4 + ATR
ATRLongStop = valuewhen(bought, ATRLong, 0)
ATRShortStop = valuewhen(bought, ATRShort, 0)
LongSL_ATR_price = strategy.position_size > 0 ? ATRLongStop : na
ShortSL_ATR_price = strategy.position_size < 0 ? ATRShortStop : na
ATRtp=strategy.position_avg_price + (strategy.position_avg_price - LongSL_ATR_price)*i_TPRRR
ATRstp=strategy.position_avg_price - (ShortSL_ATR_price - strategy.position_avg_price)*i_TPRRR


// Strategy Stop
DayStart = time == timestamp("UTC", year, month, dayofmonth, 0, 0, 0)
plot(DayStart ? 1e9 : na, style=plot.style_columns, color=color.silver, transp=80, title="Trade Day Start")
float LongStop = valuewhen(DayStart,low,0)*(1-i_PercIncrement)
float ShortStop = valuewhen(DayStart,high,0)*(1+i_PercIncrement)
float StratTP = strategy.position_avg_price + (strategy.position_avg_price - LongStop)*i_TPRRR
float StratSTP = strategy.position_avg_price - (ShortStop - strategy.position_avg_price)*i_TPRRR

/////////////////////// STRATEGY LOGIC /////////////////////////////////////////

MFI=mfi(close,i_MFI)
barsize=high-low
barbodysize=close>open?(open-close)*-1:(open-close)
shortwicksbar=barbodysize>barsize*barsizeThreshold
SMA=sma(close, i_MALen)
MAFilter=close > SMA
timesinceentry=(time - valuewhen(bought, time, 0)) / 60000
timedexit=timesinceentry == 60

BUY = MFI[1] == OB and close > open and shortwicksbar and (i_MAFilter ? MAFilter : true)
bool SELL = na
if short
    SELL := MFI[1] == OS and close < open and shortwicksbar and (i_MAFilter ? not MAFilter : true)

//Debugging Plots
plot(timesinceentry, transp=100, title="Time Since Entry")

//Trading Inputs
DPR=input(true, "Allow Direct Position Reverse")
reverse=input(false, "Reverse Trades")

// Entries
if reverse
    if not DPR
        strategy.entry("long", strategy.long, when=SELL and strategy.position_size == 0)
        strategy.entry("short", strategy.short, when=BUY and strategy.position_size == 0)
    else
        strategy.entry("long", strategy.long, when=SELL)
        strategy.entry("short", strategy.short, when=BUY)
else
    if not DPR
        strategy.entry("long", strategy.long, when=BUY and strategy.position_size == 0)
        strategy.entry("short", strategy.short, when=SELL and strategy.position_size == 0)
    else
        strategy.entry("long", strategy.long, when=BUY)
        strategy.entry("short", strategy.short, when=SELL)
if i_timedexit
    strategy.close_all(when=timedexit)

SL= i_SLType == "Swing Lo/Hi" ? entry_LL_price : i_SLType == "ATR Stop" ? LongSL_ATR_price : LongStop
SSL= i_SLType == "Swing Lo/Hi" ? entry_HH_price : i_SLType == "ATR Stop" ? ShortSL_ATR_price : ShortStop
TP= i_SLType == "Swing Lo/Hi" ? tp : i_SLType == "ATR Stop" ? ATRtp : StratTP
STP= i_SLType == "Swing Lo/Hi" ? stp : i_SLType == "ATR Stop" ? ATRstp : StratSTP

//TrailingStop
dif=(valuewhen(strategy.position_size>0 and strategy.position_size[1]<=0, high,0))
 -strategy.position_avg_price
trailOffset     = strategy.position_avg_price - SL
var tstop = float(na)
if strategy.position_size > 0
    tstop := high- trailOffset - dif
    if tstop<tstop[1]
        tstop:=tstop[1]
else
    tstop := na
StrailOffset     = SSL - strategy.position_avg_price
var Ststop = float(na)
Sdif=strategy.position_avg_price-(valuewhen(strategy.position_size<0
 and strategy.position_size[1]>=0, low,0))
if strategy.position_size < 0
    Ststop := low+ StrailOffset + Sdif
    if Ststop>Ststop[1]
        Ststop:=Ststop[1]
else
    Ststop := na

strategy.exit("TP & SL", "long", limit=TP, stop=TS? tstop : SL, when=i_SL)
strategy.exit("TP & SL", "short", limit=STP, stop=TS? Ststop : SSL, when=i_SL)

/////////////////////// PLOTS //////////////////////////////////////////////////

plot(i_SL and strategy.position_size > 0 and not TS ? SL : i_SL and strategy.position_size > 0 and TS ? tstop : na , title='SL', style=plot.style_cross, color=color.red)
plot(i_SL and strategy.position_size < 0 and not TS ? SSL : i_SL and strategy.position_size < 0 and TS ? Ststop : na , title='SSL', style=plot.style_cross, color=color.red)
plot(i_SL and strategy.position_size > 0 ? TP : na, title='TP', style=plot.style_cross, color=color.green)
plot(i_SL and strategy.position_size < 0 ? STP : na, title='STP', style=plot.style_cross, color=color.green)
// Draw price action setup arrows
plotshape(BUY ? 1 : na, style=shape.triangleup, location=location.belowbar,
 color=color.green, title="Bullish Setup", size=size.auto)
plotshape(SELL ? 1 : na, style=shape.triangledown, location=location.abovebar,
 color=color.red, title="Bearish Setup", size=size.auto)