Strategi momentum terobosan berdasarkan salib emas purata bergerak
Gambaran keseluruhan
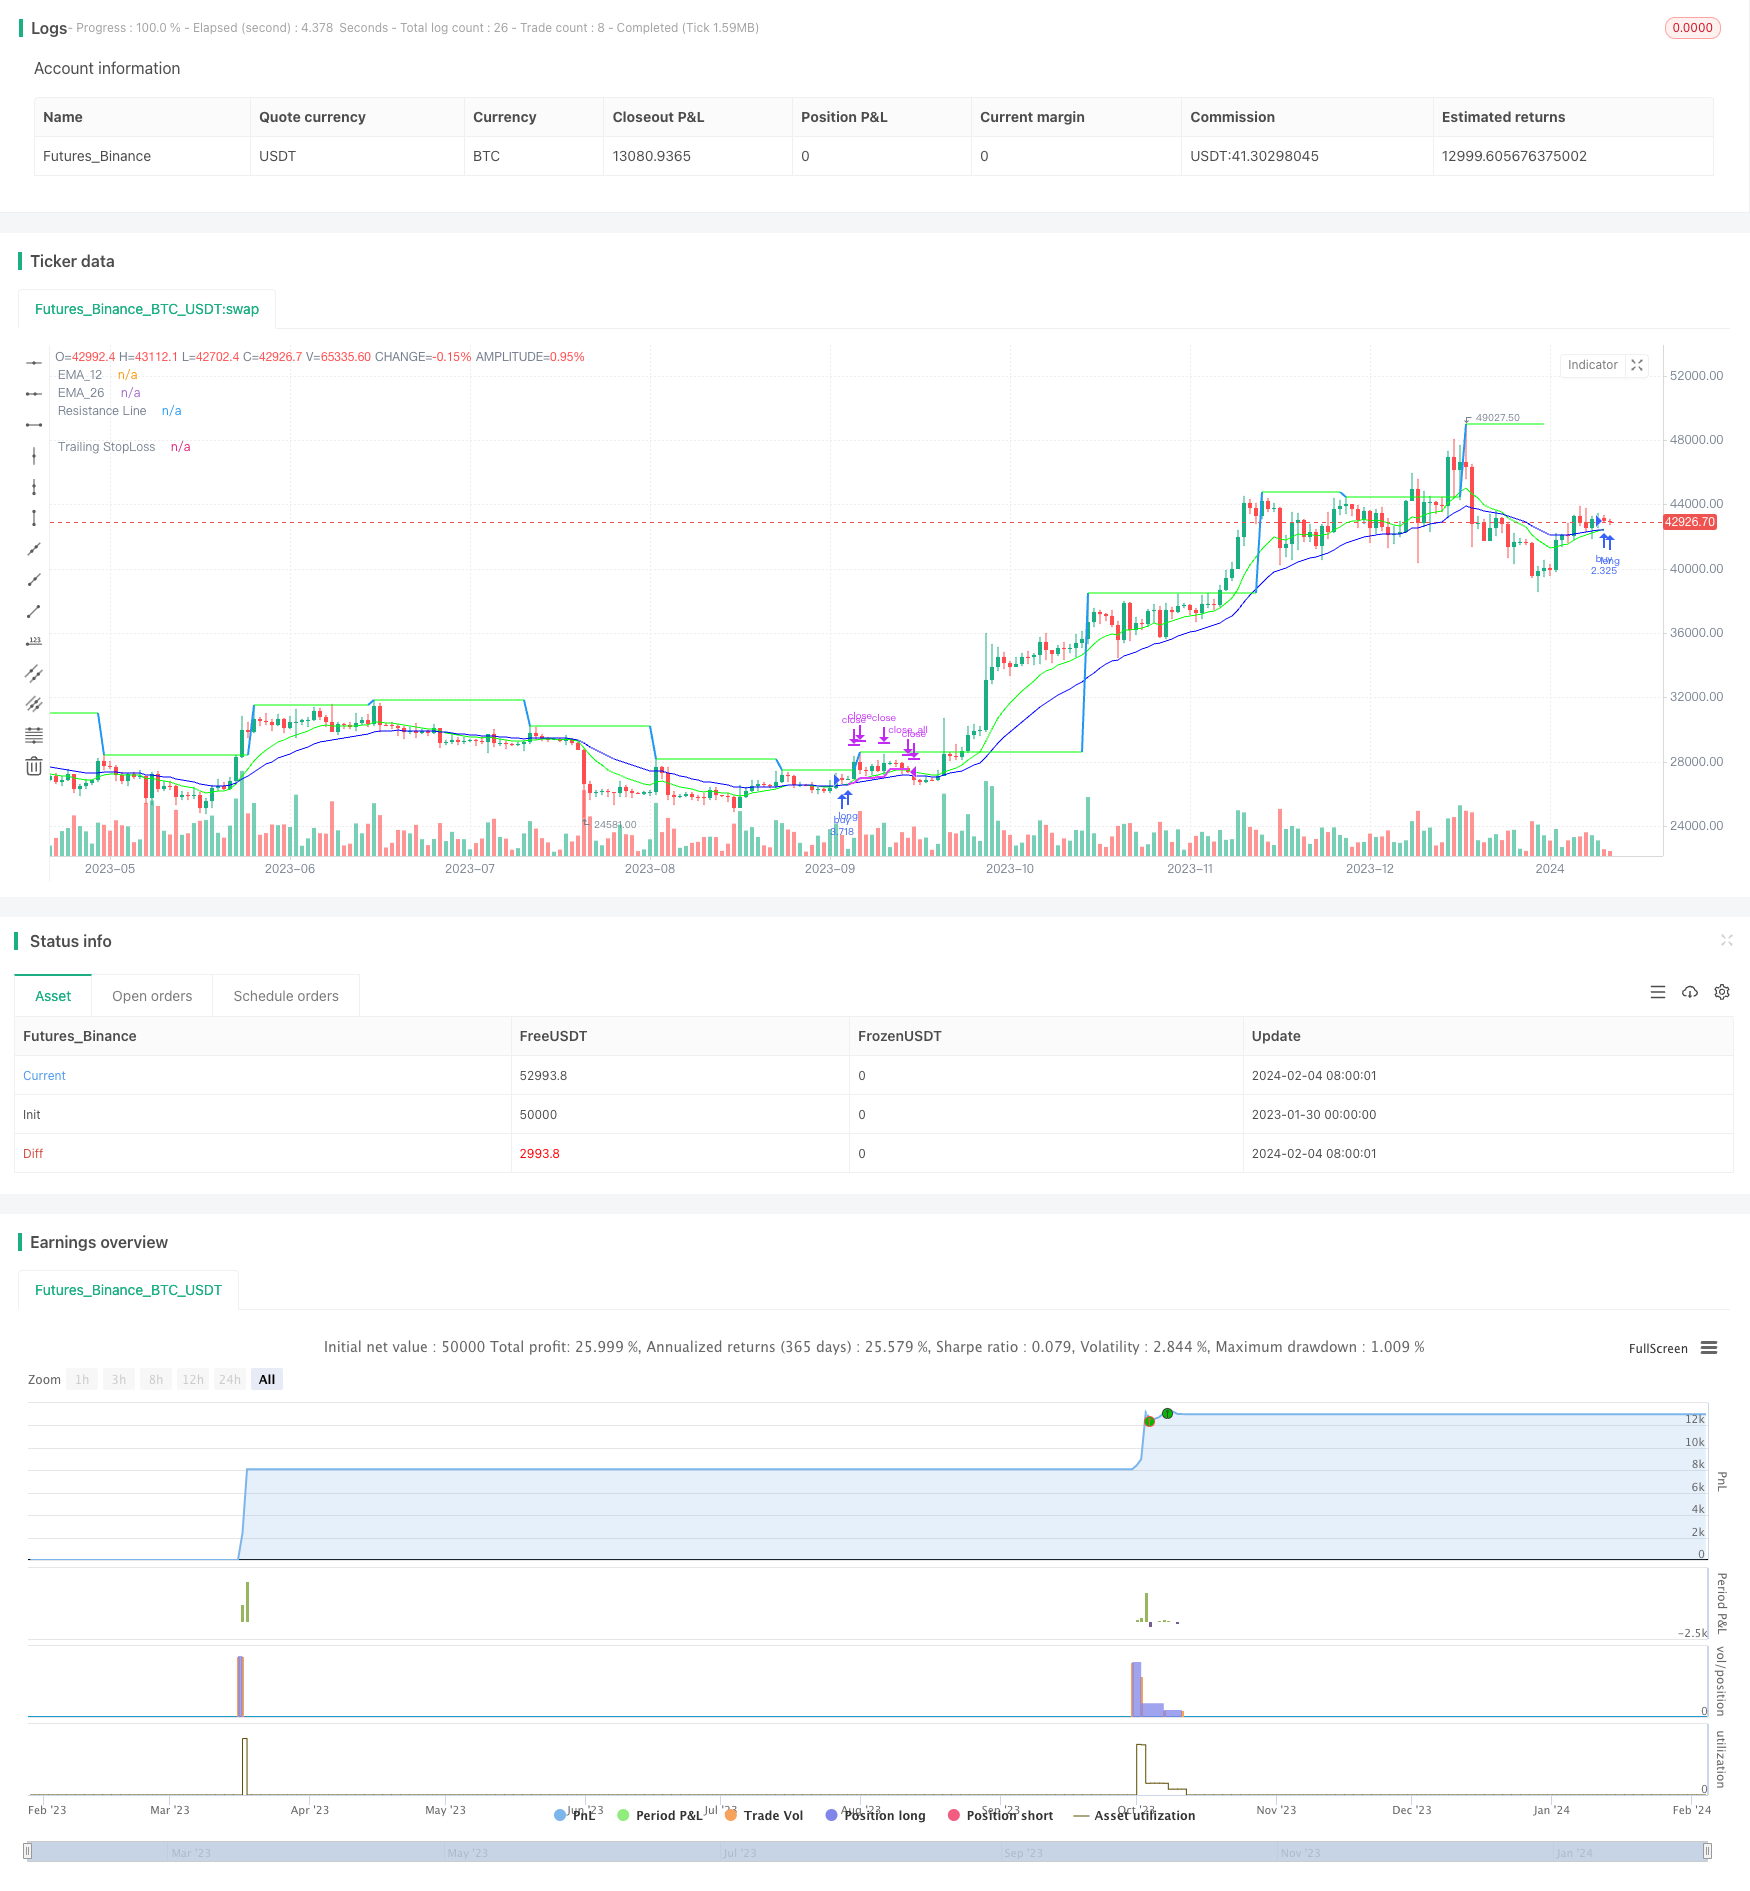
Strategi ini berdasarkan purata bergerak indeks 12 hari (EMA) dan EMA 26 hari sebagai isyarat masuk. Untuk menyaring penembusan palsu, strategi ini juga memperkenalkan indikator MACD untuk menentukan trend pasaran dan indikator RSI untuk menentukan sama ada ia berada di kawasan overbought oversold.
Dalam hal hentikan kerugian, strategi menawarkan tiga pilihan: hentikan pengesanan, hentikan keselarasan, dan pemisah keselarasan. Dalam hal hentikan, strategi menawarkan dua sasaran hentikan berturut-turut.
Prinsip Strategi
Isyarat masuk
- 12 hari EMA di atas 26 hari EMA membentuk garpu emas
- Indeks MACD adalah positif dan garis MACD lebih tinggi daripada garis isyarat
- RSI dalam julat yang ditetapkan
- Harga penutupan lebih tinggi daripada EMA 21 dan SMA 7
Pengesahan kemasukan
- Penilaian pilihan: Harga menembusi tahap rintangan dinamik
Cara untuk menghentikan kerugian
- Tracking Stop Loss: Peratusan Tracking Stop Loss yang ditetapkan mengikut harga masuk dan Tracking Stop Loss
- Hentian purata: harga penutupan jatuh di bawah Hentian SMA 7
- Fork mati: 12 hari di bawah EMA, 26 hari di bawah EMA
Cara untuk berhenti
- Tetapkan dua sasaran penghentian berturut-turut, menjual sebahagian jumlah apabila penghentian pertama dicetuskan, dan menjual jumlah penuh apabila penghentian kedua dicetuskan
Kelebihan Strategik
- Penggunaan sistem penapisan linear untuk memfilterkan isyarat yang salah, meningkatkan ketepatan masuk
- Pelbagai pilihan penutupan yang sesuai untuk pelbagai jenis peniaga
- Dinamika Tracking Stop Loss Mencapai Kawalan Risiko
- Matlamat untuk menangkal penarikan dan mengunci sebahagian daripada keuntungan
Risiko Strategik
- Indeks EMA menghasilkan lebih banyak isyarat palsu apabila pasaran bergolak
- Tracking Stop Loss mungkin diserang selepas penembusan
- Hentian mati garpu rata-rata tidak dapat dihentikan tepat pada masanya apabila trend berbalik
Langkah-langkah yang diambil:
- Kaedah ini digunakan untuk menilai trend sebenar pasaran dengan menggunakan MACD.
- Menyesuaikan besarnya kerugian pengesanan
- Penangguhan pilihan atau gabungan
Arah pengoptimuman strategi
- Optimumkan parameter EMA untuk menentukan kombinasi parameter terbaik
- Uji cara dan parameter yang berbeza untuk mencari penyelesaian yang terbaik
- Uji parameter penangguhan yang berbeza untuk mengoptimumkan penangguhan
- Kaedah ini juga digunakan untuk menentukan masa masuk ke dalam permainan.
- Penyesuaian mengikut varieti dan parameter kitaran
ringkaskan
Strategi ini menggunakan sistem garis rata sebagai isyarat perdagangan utama, membantu penapisan masuk dengan penunjuk seperti MACD, RSI. Cara berhenti dan sasaran berhenti telah ditetapkan secara optimum, boleh disesuaikan dengan parameter untuk menyesuaikan pelbagai jenis pelabur. Ruang pengoptimuman strategi masih besar, boleh diuji dan diperbaiki dari pelbagai dimensi seperti isyarat masuk, cara berhenti, sasaran berhenti, dan sebagainya.
/*backtest
start: 2023-01-30 00:00:00
end: 2024-02-05 00:00:00
period: 1d
basePeriod: 1h
exchanges: [{"eid":"Futures_Binance","currency":"BTC_USDT"}]
*/

// This source code is subject to the terms of the Mozilla Public License 2.0 at https://mozilla.org/MPL/2.0/
// © AbdulRahimShama
//@version=5


strategy('12/26-IT strategy', overlay=true,initial_capital = 100000)


Show_Only_12_26_Crossover_Entry = input.bool(true, group = "Entry_Exit Criteria")
Show_12_26_Crossover_and_resistance_Entry = input.bool(false, group = "Entry_Exit Criteria")


Show_TSL_StopLoss = input.bool(true, group = "Entry_Exit Criteria")
Show_Crossdown_StopLoss = input.bool(true, group = "Entry_Exit Criteria")
Show_SMA7_StopLoss = input.bool(false, group = "Entry_Exit Criteria")


////////////////////////////////////////////////
////////////////TARGETS INPUT
////////////////////////////////////////////////

////////Target1

TargetPerc1 = input.float(title="Target (%)", minval=0,defval=5, group="Target-1") / 100
TargetPrice1 = strategy.position_avg_price * (1 + TargetPerc1)
Target1_exit_qty = input.int(50, group="Target-1",tooltip = "% qty to sell when Target1 is reached")


////////Target2

TargetPerc2 = input.float(title="Target (%)", minval=0,defval=10, group="Target-2") / 100
TargetPrice2 = strategy.position_avg_price * (1 + TargetPerc2)
Target2_exit_qty = input.int(100, group="Target-2",tooltip = "% qty to sell when Target2 is reached")


////////////////////////////////////////////////
////////////////TRAILING STOP LOSS
////////////////////////////////////////////////


TSLsource = input(low, title="TSL Source", group="Trailing StopLoss")

longTrailPerc = input.float(title='Trail Long Loss (%)', minval=0.0, step=0.1, defval=1, group="Trailing StopLoss") * 0.01

TrailStopPrice = 0.0

TrailStopPrice := if strategy.position_size > 0
    sPIVOT_highValue = TSLsource * (1 - longTrailPerc)
    math.max(sPIVOT_highValue, TrailStopPrice[1])
else
    0

TSL = close < TrailStopPrice
plot(series=strategy.position_size > 0 and Show_TSL_StopLoss ? TrailStopPrice : na, color=color.new(color.fuchsia, 0), style=plot.style_linebr, linewidth=2, title='Trailing StopLoss')


////////////////////////////////////////////////
////////////////Moving Averages
////////////////////////////////////////////////


EMA_12=ta.ema(close, 12)
EMA_26=ta.ema(close, 26)
EMA_21=ta.ema(close,21)

plot(EMA_12, title="EMA_12", color=color.rgb(0, 255, 0), offset=0, linewidth=1)
plot(EMA_26, title="EMA_26", color=color.rgb(0, 0, 255), offset=0, linewidth=1)
plot(Show_SMA7_StopLoss ? ta.sma(close,7) : na, title="SMA_7", color=color.rgb(255, 0, 0), offset=0, linewidth=1)


////////////////////////////////////////////////
////////////////RESISTANCE INPUT and PLOTTING
////////////////////////////////////////////////

CrossOverLookbackCandles = input.int(10, group= "RESISTANCE")

resistanceSRC = input(high, group= "RESISTANCE")
resistanceLEFT = input(10, group= "RESISTANCE")
resistanceRIGHT = input(10, group= "RESISTANCE")

hih = ta.pivothigh(resistanceSRC, resistanceLEFT, resistanceRIGHT)
top = ta.valuewhen(hih, resistanceSRC[resistanceRIGHT], 0)

res = plot(top, color=top != top[1] ? na : color.new(#00ff00, 50), offset=-resistanceLEFT, linewidth=2, title="Resistance Line")

EMA_12_Low = ta.lowest(EMA_12, CrossOverLookbackCandles)
EMA_26_Low = ta.lowest(EMA_26, CrossOverLookbackCandles)


////////////////////////////////////////////////
////////////////RSI INPUT and PLOTTING
////////////////////////////////////////////////
RSI = ta.rsi(close, 14)
RSILowerRange = input.int(50, tooltip = "RSI value should be ABOVE this value for entry", group = "RSI")
RSIUpperRange = input.int(70, tooltip = "RSI value should be BELOW this value for entry", group = "RSI")


////////////////////////////////////////////////
////////////////MACD
////////////////////////////////////////////////
fast_length = 12
slow_length = 26
MACD_src = close
signal_length = 9

fast_ma = ta.ema(MACD_src, fast_length)
slow_ma = ta.ema(MACD_src, slow_length)
macd = fast_ma - slow_ma
signal = ta.ema(macd, signal_length)
hist = macd - signal


////////////////////////////////////////////////
////////////////ENTRY CRITERIA
////////////////////////////////////////////////


BUYVALUE= input(100000, tooltip = "Buy qty displayed on chart will be based on this value")

BASEENTRY = macd > signal and RSI > RSILowerRange and RSI < RSIUpperRange and close > EMA_21 and close > ta.sma(close, 7)


Entry= ta.crossover(EMA_12, EMA_26) and BASEENTRY
Entry2 = ta.crossover(close, top) and EMA_12_Low < EMA_26_Low and EMA_12 > EMA_26 and RSI < 70

////////////////////////////////////////////////
////////////////BUY SELL STRATEGY
////////////////////////////////////////////////

if ((Entry and Show_Only_12_26_Crossover_Entry))
    strategy.entry("buy", strategy.long, qty=BUYVALUE/close)

if (Entry2 and Show_12_26_Crossover_and_resistance_Entry)
    strategy.entry("buy", strategy.long, qty=BUYVALUE/close)

strategy.exit("Tg1", "buy", limit=TargetPrice1, qty_percent = Target1_exit_qty)
strategy.exit("Tg2", "buy", limit=TargetPrice2, qty_percent = Target2_exit_qty)


if TSL and Show_TSL_StopLoss and close < EMA_12
    strategy.close_all ("sl")

if ta.crossunder(EMA_12, EMA_26) and Show_Crossdown_StopLoss
    strategy.close_all ("sl")

if ta.crossunder(close, ta.sma(close, 7)) and Show_SMA7_StopLoss
    strategy.close_all ("sl")