Estratégia Super Momentum


Data de criação: 2023-11-06 09:24:02 última modificação: 2023-11-06 09:24:02
cópia: 0 Cliques: 696
1
focar em
1617
Seguidores

Estratégia Super Momentum

Visão geral

A estratégia de super-dinâmica combina vários indicadores de dinâmica para comprar ou vender quando vários indicadores de dinâmica estão acima ou abaixo ao mesmo tempo. A estratégia pode capturar a tendência de preços com mais precisão, combinando vários indicadores de dinâmica, evitando os sinais errados causados por um único indicador.

Princípio da estratégia

A estratégia usa simultaneamente quatro indicadores de RMI da Everget e um indicador de oscilação do movimento de Chande. O indicador RMI é baseado no cálculo da dinâmica dos preços e pode determinar a força de alta e baixa dos preços. O Chande MO, por sua vez, calcula as mudanças de preço para determinar a sobrevenda e a sobrevenda do mercado.

A operação de compra é executada quando o RMI5 atravessa sua linha de compra, o RMI4 atravessa sua linha de compra, o RMI3 atravessa sua linha de compra, o RMI2 atravessa sua linha de compra, o RMI1 atravessa sua linha de compra e o Chande MO atravessa sua linha de compra.

Quando o RMI5 atravessa a linha de venda, o RMI4 atravessa a linha de venda, o RMI3 atravessa a linha de venda, o RMI2 atravessa a linha de venda, o RMI1 atravessa a linha de venda e o Chande MO atravessa a linha de venda, a operação de venda é realizada.

O RMI5 é configurado na direção oposta aos outros indicadores RMI, o que permite uma melhor identificação de tendências e operações em pirâmide.

Análise de vantagens

  • A integração de vários indicadores permite uma avaliação mais precisa das tendências, evitando sinais errôneos de um único indicador

  • Indicadores com múltiplos períodos de tempo para identificar tendências em níveis maiores

  • O indicador RMI inverso pode auxiliar na identificação de tendências e na operação da pirâmide

  • Chande MO ajuda a evitar erros de transação em caso de sobrevenda

Análise de Riscos

  • Excesso de combinações de indicadores, configuração de parâmetros complicada, precisa de testes cuidadosos e otimização

  • Múltiplos indicadores podem gerar sinais errados

  • A frequência de transações pode ser menor em vários indicadores

  • A necessidade de se preocupar se os parâmetros indicadores são adequados para diferentes variedades e condições de mercado

Direção de otimização

  • Configuração de parâmetros de indicadores de teste e parâmetros de otimização para aumentar a estabilidade da estratégia

  • Tentar aumentar ou diminuir alguns indicadores para avaliar o impacto na qualidade do sinal

  • Algumas condições de filtragem podem ser introduzidas para evitar sinais errados em determinadas situações de mercado

  • Ajustar a posição da linha de compra e venda do indicador para encontrar a melhor combinação de parâmetros

  • Considerar a inclusão de um mecanismo de impedimento para controlar o risco

Resumir

Esta estratégia aumenta a capacidade de julgamento sobre as tendências do mercado através da aplicação integrada de vários indicadores dinâmicos. Mas a configuração de parâmetros é complexa e precisa de testes cuidadosos de otimização, melhoria contínua e ajuste. Se usado corretamente, espera-se obter melhores sinais de negociação, com uma certa vantagem em acompanhar as tendências do mercado.
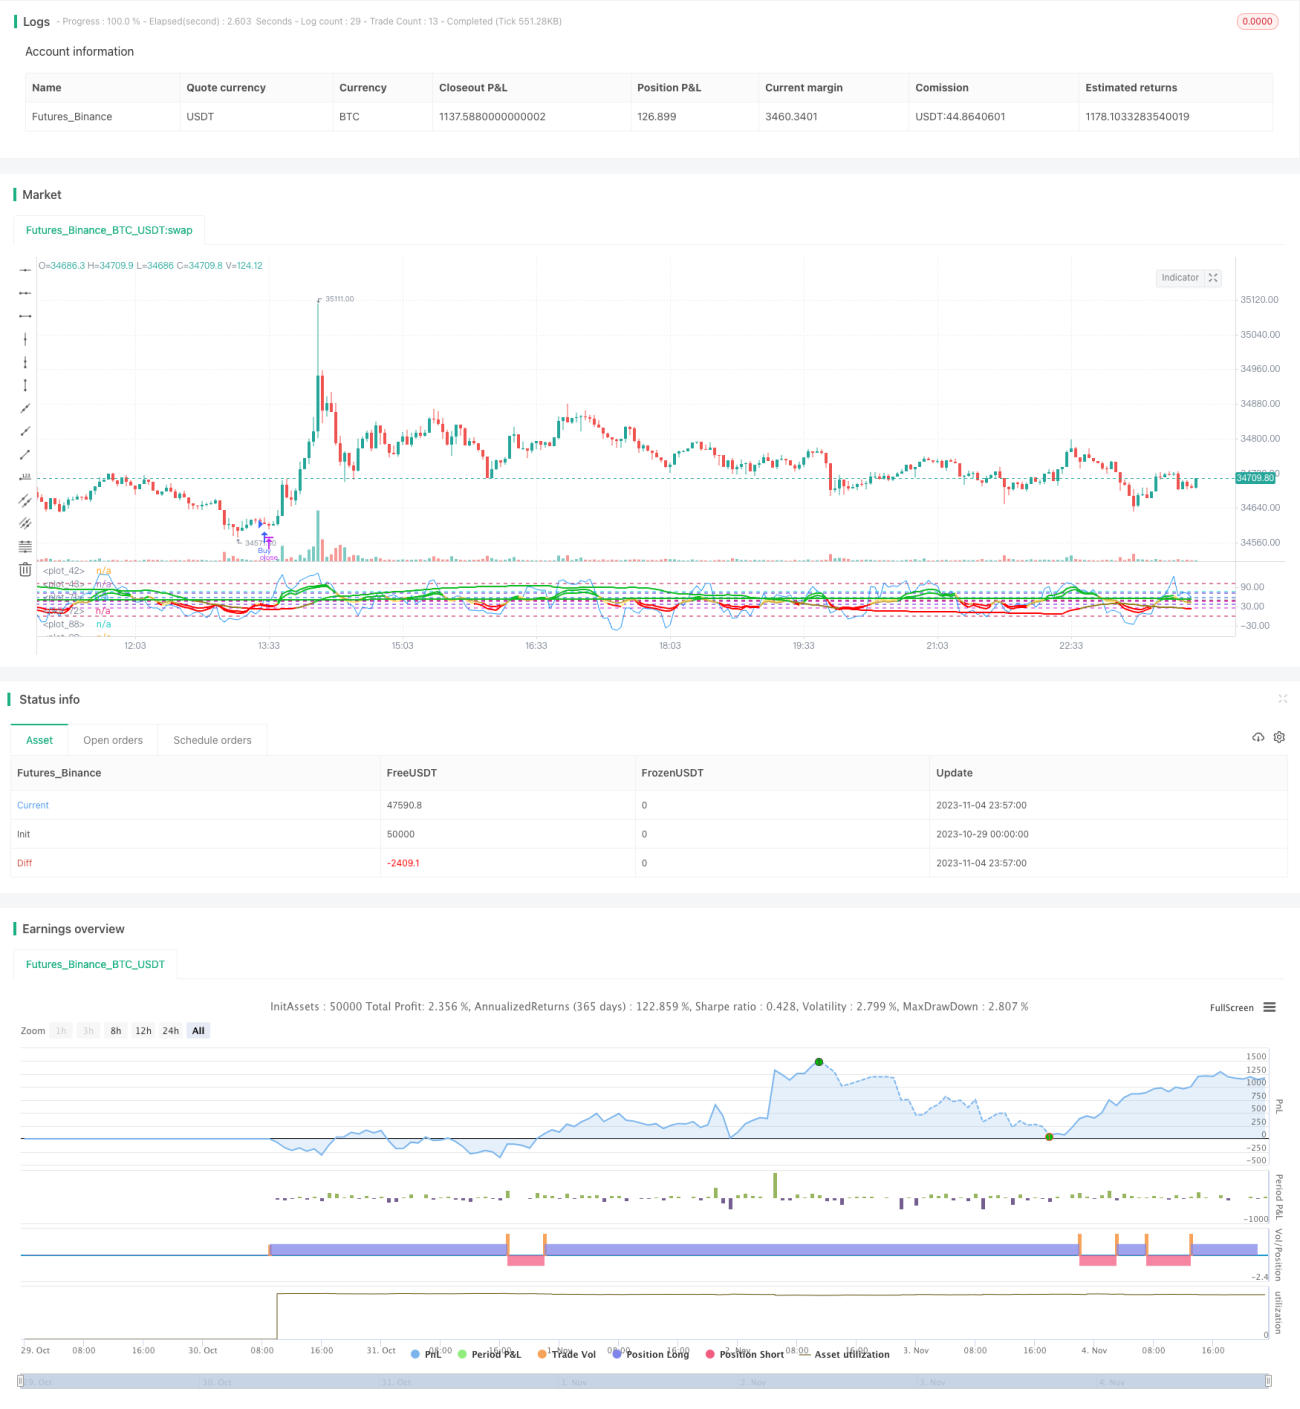
Código-fonte da estratégia
/*backtest
start: 2023-10-29 00:00:00
end: 2023-11-05 00:00:00
period: 3m
basePeriod: 1m
exchanges: [{"eid":"Futures_Binance","currency":"BTC_USDT"}]
*/

//@version=4
strategy(title="Super Momentum Strat", shorttitle="SMS", format=format.price, precision=2)

//* Backtesting Period Selector | Component *//
//* https://www.tradingview.com/script/eCC1cvxQ-Backtesting-Period-Selector-Component *//
//* https://www.tradingview.com/u/pbergden/ *//
//* Modifications made *//
testStartYear = input(2021, "Backtest Start Year") 
testStartMonth = input(1, "Backtest Start Month")
testStartDay = input(1, "Backtest Start Day")
testPeriodStart = timestamp(testStartYear,testStartMonth,testStartDay,0,0)

testStopYear = input(999999, "Backtest Stop Year")
testStopMonth = input(9, "Backtest Stop Month")
testStopDay = input(26, "Backtest Stop Day")
testPeriodStop = timestamp(testStopYear,testStopMonth,testStopDay,0,0)

testPeriod() => true
/////////////// END - Backtesting Period Selector | Component ///////////////


src = input(close, "Price", type = input.source)
highlightBreakouts = input(title="Highlight Overbought/Oversold Breakouts ?", type=input.bool, defval=true)

CMOlength = input(9, minval=1, title="Alpha Chande Momentum Length")


//CMO
momm = change(src)
f1(m) => m >= 0.0 ? m : 0.0
f2(m) => m >= 0.0 ? 0.0 : -m
m1 = f1(momm)
m2 = f2(momm)
sm1 = sum(m1, CMOlength)
sm2 = sum(m2, CMOlength)
percent(nom, div) => 100 * nom / div
chandeMO = percent(sm1-sm2, sm1+sm2)+50
plot(chandeMO, "Chande MO", color=color.blue)

obLevel = input(75, title="Chande Sellline")
osLevel = input(25, title="Chande Buyline")
hline(obLevel, color=#0bc4d9)
hline(osLevel, color=#0bc4d9)


///
///RMIS 
//
// Copyright (c) 2018-present, Alex Orekhov (everget)
// Relative Momentum Index script may be freely distributed under the MIT license.
//
///
///


//RMI1
length1 = input(title="RMI1 Length", type=input.integer, minval=1, defval=8)
momentumLength1 = input(title="RMI1 Momentum ", type=input.integer, minval=1, defval=3)
up1 = rma(max(change(src, momentumLength1), 0), length1)
down1 = rma(-min(change(src, momentumLength1), 0), length1)

rmi1 = down1 == 0 ? 100 : up1 == 0 ? 0 : 100 - (100 / (1 + up1 / down1))

obLevel1 = input(57, title="RMI1 Sellline")
osLevel1 = input(37, title="RMI1 Buyline")

rmiColor1 = rmi1 > obLevel1 ? #0ebb23 : rmi1 < osLevel1 ? #ff0000 : #ffe173
plot(rmi1, title="RMI 1", linewidth=2, color=rmiColor1, transp=0)
hline(obLevel1, color=#0b57d9)
hline(osLevel1, color=#0b57d9)


//RMI2
length2 = input(title="RMI2 Length", type=input.integer, minval=1, defval=12)
momentumLength2 = input(title="RMI2 Momentum ", type=input.integer, minval=1, defval=3)
up2 = rma(max(change(src, momentumLength1), 0), length2)
down2 = rma(-min(change(src, momentumLength1), 0), length2)

rmi2 = down2 == 0 ? 100 : up1 == 0 ? 0 : 100 - (100 / (1 + up2 / down2))

obLevel2 = input(72, title="RMI2 Sellline")
osLevel2 = input(37, title="RMI2 Buyline")

rmiColor2 = rmi1 > obLevel1 ? #0ebb23 : rmi2 < osLevel2 ? #ff0000 : #c9ad47
plot(rmi2, title="RMI 2", linewidth=2, color=rmiColor2, transp=0)
hline(obLevel2, color=#5a0bd9)
hline(osLevel2, color=#5a0bd9)

//RMI3
length3 = input(title="RMI3 Length", type=input.integer, minval=1, defval=30)
momentumLength3 = input(title="RMI3 Momentum ", type=input.integer, minval=1, defval=53)
up3 = rma(max(change(src, momentumLength3), 0), length3)
down3 = rma(-min(change(src, momentumLength3), 0), length3)

rmi3 = down3 == 0 ? 100 : up3 == 0 ? 0 : 100 - (100 / (1 + up3 / down3))

obLevel3 = input(46, title="RMI3 Sellline")
osLevel3 = input(24, title="RMI3 Buyline")

rmiColor3 = rmi3 > obLevel3 ? #0ebb23 : rmi3 < osLevel3 ? #ff0000 : #967d20
plot(rmi3, title="RMI 3", linewidth=2, color=rmiColor3, transp=0)
hline(obLevel3, color=#cf0bd9)
hline(osLevel3, color=#cf0bd9)
//RMI4
length4 = input(title="RMI4 Length", type=input.integer, minval=1, defval=520)
momentumLength4 = input(title="RMI4 Momentum ", type=input.integer, minval=1, defval=137)
up4 = rma(max(change(src, momentumLength4), 0), length4)
down4 = rma(-min(change(src, momentumLength4), 0), length4)

rmi4 = down4 == 0 ? 100 : up4 == 0 ? 0 : 100 - (100 / (1 + up4 / down4))

obLevel4 = input(0, title="RMI4 Sellline")
osLevel4 = input(100, title="RMI4 Buyline")

rmiColor4 = rmi4 > obLevel4 ? #0ebb23 : rmi4 < osLevel4 ? #ff0000 : #7a630b
plot(rmi4, title="RMI 4", linewidth=2, color=rmiColor4, transp=0)
hline(obLevel4, color=#bd1150)
hline(osLevel4, color=#bd1150)


//RMI5
length5 = input(title="RMI5 Length", type=input.integer, minval=1, defval=520)
momentumLength5 = input(title="RMI5 Momentum ", type=input.integer, minval=1, defval=137)
up5 = rma(max(change(src, momentumLength5), 0), length5)
down5 = rma(-min(change(src, momentumLength5), 0), length5)

rmi5 = down5 == 0 ? 100 : up4 == 0 ? 0 : 100 - (100 / (1 + up5 / down5))

buy5 = input(0, title="RMI5 Buy Above")
sell5 = input(47, title="RMI5 Sell Below")

rmiColor5 = rmi5 > buy5 ? #0ebb23 : rmi5 < sell5 ? #ff0000 : #7a630b
plot(rmi5, title="RMI 5", linewidth=2, color=rmiColor5, transp=0)
hline(buy5, color=#bd1150)
hline(sell5, color=#bd1150)
///
///END RMIS 
//
// 
// Relative Momentum Index script may be freely distributed under the MIT license.
//
///
///

hline(50, color=#C0C0C0, linestyle=hline.style_dashed, title="Zero Line")

//alerts


longcondition1 = crossover(chandeMO, osLevel)
shortcondition1 = crossunder(chandeMO, obLevel)
longcondition2 = rmi5>buy5 and rmi4<osLevel4 and rmi3<osLevel3 and rmi2<osLevel2 and rmi1<osLevel1 and longcondition1
shortcondition2 =  rmi5<sell5 and rmi4>obLevel4 and rmi3>obLevel3 and rmi2>obLevel2 and rmi1>obLevel1 and shortcondition1

if testPeriod()
    if longcondition2
        strategy.entry("Buy", strategy.long)
    if shortcondition2
        strategy.entry("Sell", strategy.short)