Negociação quantitativa: estratégias precisas de longo e curto prazo


Data de criação: 2023-12-07 16:19:11 última modificação: 2023-12-07 16:19:11
cópia: 0 Cliques: 938
1
focar em
1619
Seguidores

Negociação quantitativa: estratégias precisas de longo e curto prazo

Visão geral

Este artigo apresenta principalmente uma estratégia de negociação quantitativa baseada no canal de Brin, o indicador ADX combinado com a linha K para julgamento de muitos espaços. A estratégia usa o canal de Brin para julgar a tendência e a volatilidade do mercado, e combina o indicador ADX para julgar a tendência do mercado forte.

Princípio da estratégia

    1. A direção da tendência do mercado é julgada com base na trajetória ascendente e descendente do canal de Brin. Os preços estão acima da trajetória ascendente como a tendência de mais cabeça, e abaixo da trajetória descendente como a tendência de cabeça.
    1. A largura de banda do canal de Brin reflete a volatilidade e o risco do mercado. A largura de banda de Brin indica que quanto mais o mercado é turbulento, maior o risco, e é melhor evitar a construção de posições.
    1. O indicador ADX julga a tendência do mercado forte ou fraca. Quando o valor ADX é maior que 25, ele indica a tendência, o que determina a direção do canal de Boolean para escolher a direção de construção de posições. Quando o ADX é menor que 25, ele indica a tendência de choque, então deve-se evitar a negociação.
    1. Após a decisão de fazer mais curto prazo, o ponto de parada é definido de acordo com o indicador ATR. O ATR é usado para medir a amplitude de flutuação do mercado e a distância de parada é definida de acordo com o múltiplo ATR.
    1. A travessia é definida de acordo com a rota de subida e descida de Brin. A travessia com mais cabeças é definida de acordo com a rota de subida e a travessia com cabeças vazias é definida de acordo com a rota de subida. A travessia com mais cabeças é definida de acordo com a rota de subida e a travessia com cabeças vazias é definida de acordo com o ATR.
    1. Gerenciamento de perdas e perdas entre o ponto de parada e o ponto de parada, configuração de stop loss móvel para bloquear o lucro.

Vantagens estratégicas

  1. A combinação do canal de Brin e a direção de julgamento do indicador ADX permite a determinação clara do excesso de espaço e a criação de posições seletivas, evitando transações inúteis em situações de turbulência.

  2. Utilizando a largura de banda de Brin para avaliar o risco de flutuação, quando a banda de Brin se estreita, as chances são altas, mas o risco é menor. Evite negociar quando a banda de Brin se torna mais larga.

  3. A configuração ATR de Stop Loss permite que o risco seja controlado, evitando o máximo possível que o Stop Loss seja perseguido.

  4. De acordo com a configuração do canal de Brin, não há risco de um pára-quedas de pára-quedas.

  5. A parada móvel é uma parada em tempo real após o lucro para garantir o lucro e continuar a seguir a tendência.

Risco estratégico

  1. A presença de pressão no canal de Brin e no indicador ADX é possível. Se ocorrer um desvio, pode ocasionar um erro de julgamento.

  2. O ATR apenas reflete oscilações históricas e não prevê oscilações futuras. O risco de um real stop loss ser seguido ainda existe.

  3. A regionalização do Canal de Brin é subjetiva, podendo ocorrer a perda de oportunidades.

  4. A parada móvel só pode ser realizada no disco, existindo o risco de não poder ser movida durante o intervalo.

  5. Risco de adequação dos dados de retrospectiva. É difícil replicar os relatórios de teste no mercado real.

Otimização de Estratégia

  1. A integração de mais indicadores para a confiança mútua, evita que o canal de Brin e o indicador ADX apresentem falsos sinais.

  2. O stop ATR pode ser adicionado ao stop de salto ou ao stop de configuração de volatilidade do mercado com o uso de algoritmos de aprendizado profundo.

  3. Otimizar os parâmetros de passagem do Canal de Brin para que ele possa abraçar uma maior oportunidade de mercado.

  4. A utilização de sistemas de negociação programados mais eficientes para a detenção de perdas móveis sem vigilância.

  5. O teste deve ser feito em períodos de tempo mais longos e com mais combinações de variedades para garantir a robustez da estratégia.

Resumir

Esta estratégia integra vários sinais de indicadores, como o canal de Brin, o indicador ADX, a construção de posições seletivas após a determinação da direção clara da tendência, e a utilização do indicador ATR para otimizar a configuração de stop loss e o controle máximo do risco e da taxa de ganho, é uma estratégia de negociação quantitativa recomendada. Vemos que a estratégia ainda tem muito espaço para otimização, esperando a produção de futuras versões de geração.
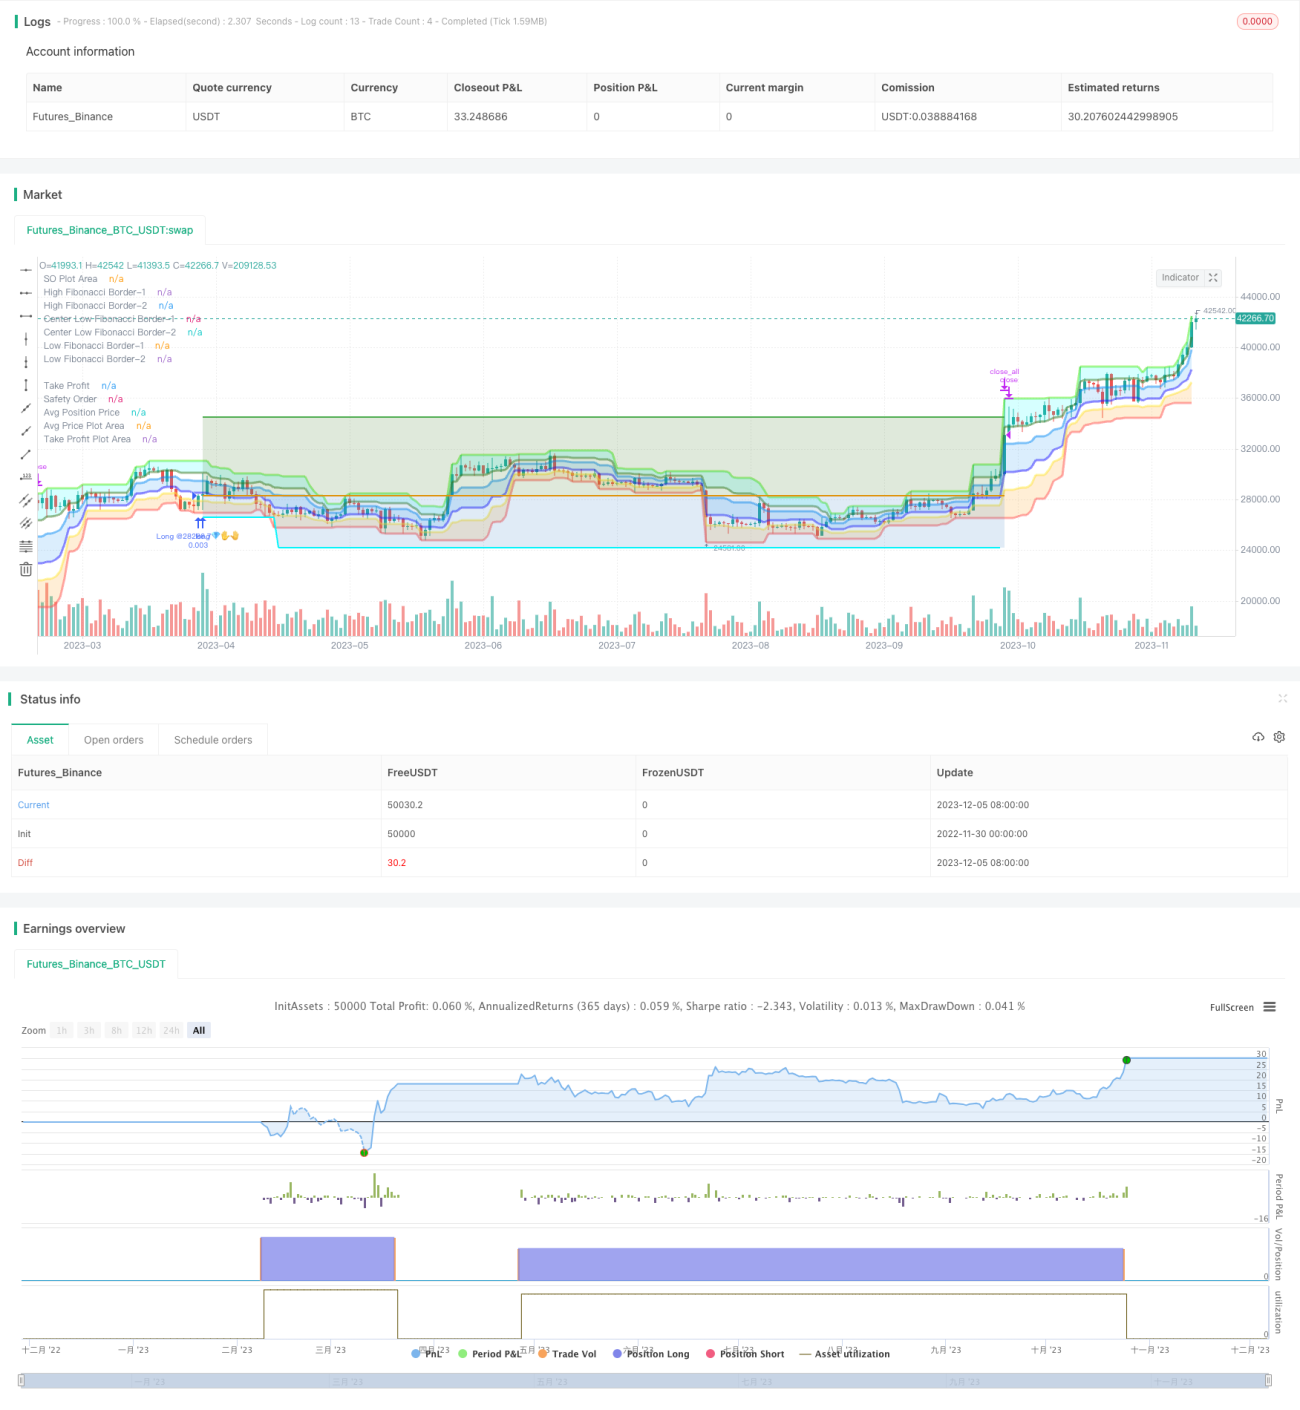
Código-fonte da estratégia
/*backtest
start: 2022-11-30 00:00:00
end: 2023-12-06 00:00:00
period: 1d
basePeriod: 1h
exchanges: [{"eid":"Futures_Binance","currency":"BTC_USDT"}]
*/

// © Fibonacci Zone DCA Strategy - R3c0nTrader ver 2022-06-12
// For backtesting with 3Commas DCA Bot settings
// Thank you "eykpunter" for granting me permission to use "Fibonacci Zones" to create this strategy
// Thank you "junyou0424" for granting me permission to use "DCA Bot with SuperTrend Emulator" which I used for adding bot inputs, calculations, and strategy
//@version=5
strategy('Fibonacci Zone DCA Strategy - R3c0nTrader', shorttitle='Fibonacci Zone DCA Strategy', overlay=true )

// Strategy Inputs
// Start and End Dates
i_startTime = input(defval=timestamp('01 Jan 2015 00:00 +0000'), title='Start Time', group="Date Range")
i_endTime = input(defval=timestamp('31 Dec 2050 23:59 +0000'), title='End Time', group="Date Range")
inDateRange = true

// Fibonacci Settings
sourceInput = input.source(close, "Source", group="Trade Entry Settings")
per = input(14, title='Fibonacci length', tooltip='Number of bars to look back. Recommended for beginners to set ADX Smoothing and DI Length to the same value as this.', group="Trade Entry Settings")
hl = ta.highest(high, per)  //High Line (Border)
ll = ta.lowest(low, per)  //Low Line  (Border)
dist = hl - ll  //range of the channel    
hf = hl - dist * 0.236  //Highest Fibonacci line
cfh = hl - dist * 0.382  //Center High Fibonacci line
cfl = hl - dist * 0.618  //Center Low Fibonacci line
lf = hl - dist * 0.764  //Lowest Fibonacci line

// ADX Settings
lensig = input.int(14, title="ADX Smoothing", tooltip='Fibonacci signals work best when market is trending. ADX is used to measure trend strength. Default value is 14. Recommend for beginners to match this with Fibonacci length and DI Length',minval=1, maxval=50, group="Trade Entry Settings")
len = input.int(14, minval=1, title="DI Length", tooltip='Fibonacci signals work best when market is trending. DI Length is used to calculate ADX to measure trend strength. Default value is 14. Recommend for beginners to match this with Fibonacci length and ADX Smoothing.', group="Trade Entry Settings")
adx_min = input.int(25, title='Min ADX value to open trade', tooltip='Use this to set the minium ADX value (trend strength) to open trade. 25 or higher is recommended for beginners. 0 to 20 is a weak trend. 25 to 35 is a strong trend. 35 to 45 is a very strong trend. 45 to 100 is an extremely strong trend.', group="Trade Entry Settings")
up = ta.change(high)
down = -ta.change(low)
plusDM = na(up) ? na : (up > down and up > 0 ? up : 0)
minusDM = na(down) ? na : (down > up and down > 0 ? down : 0)
trur = ta.rma(ta.tr, len)
di_plus = fixnan(100 * ta.rma(plusDM, len) / trur)
di_minus = fixnan(100 * ta.rma(minusDM, len) / trur)
sum = di_plus + di_minus
adx = 100 * ta.rma(math.abs(di_plus - di_minus) / (sum == 0 ? 1 : sum), lensig)
fib_choice = input.string("2-Higher than the top of the Downtrend Fib zone", title="Open a trade when the price moves:", options=["1-To the bottom of Downtrend Fib zone", "2-Higher than the top of the Downtrend Fib zone", "3-Higher than the bottom of Ranging Fib Zone", "4-Higher than the top of Ranging Fib Zone", "5-Higher than the bottom of Uptrend Fib Zone", "6-To the top of Uptrend Fib Zone"],
   tooltip='There are three fib zones. The options are listed from the bottom zone to the top zone. The bottom zone is the Downtrend zone; the middle zone is the Ranging zone; The top fib zone is the Uptrend zone;',
   group="Trade Entry Settings")
di_choice = input.bool(false, title="Only open trades on bullish +DI (Positive Directional Index)? (off for contrarian traders)", tooltip=
   'Default is disabled. If you want to be more selective (you want a bullish confirmation), enable this and it will only open trades when the +DI (Positive Directional Index) is higher than the -DI (Negative Directional Index). Contrarian traders (buy the dip) should leave this disabled', 
   group="Trade Entry Settings")
di_min = input.int(0, title='Min +DI value to open trade', 
   tooltip='Default is zero. Use this to set the minium +DI value to open the trade. Try incrementing this value if you want to be more selective and filter for more bullish moves (e.g. 20-25). For Contrarian traders, uncheck "Only open trades on bullish DI" option and set Min +DI to zero', 
   group="Trade Entry Settings")
di_max = input.int(100, title='Max +DI value to open trade', tooltip='Default is 100. Use this to set the maxium +DI value to open trade. For Contrarian traders, uncheck "Only open trades on bullish DI" option and try a Max +DI value no higher than 20 or 25', group="Trade Entry Settings")
di_inrange = di_plus >= di_min and di_plus <= di_max

// Truncate function
truncate(number, decimals) =>
    factor = math.pow(10, decimals)
    int(number * factor) / factor

//Declare take_profit
take_profit = float(0.22)

// Take Profit Drop-down menu option
tp_choice = input.string("Target Take Profit (%)", title="Take profit using:", options=["Target Take Profit (%)", "High Fibonacci Border-1", "High Fibonacci Border-2"], tooltip=
   'Select how to exit your trade and take profit. Then specify below this option the condition to exit. "High Fibonacci Border-1" is the top-most Fibonacci line in the green uptrend zone. "High Fibonacci Border-2" is the bottom Fibonacci line in the green uptrend zone. You can find these lines on the "Style" tab and toggle them off/on to locate these lines for more clarity', 
   group="Trade Exit Settings")
if tp_choice == "Target Take Profit (%)"
    take_profit := input.float(22.0, title='Target Take Profit (%)', step=0.5, minval=0.0, tooltip='Only used if "Target Take Profit (%)" is selected above.', group="Trade Exit Settings") / 100
    take_profit
else if tp_choice == "High Fibonacci Border-1"
    take_profit := float(hl)
    take_profit
else if tp_choice == "High Fibonacci Border-2"
    take_profit := float(hf)
    take_profit

trailing = input.float(0.0, title='Trailing deviation. Default= 0.0 (%)', step=0.5, minval=0.0, group="Trade Exit Settings") / 100
base_order = input(100.0, title='Base order', group="Trade Entry Settings")
safe_order = input(200.0, title='Safety order', group="Trade Entry Settings")
price_deviation = input.float(6.0, title='Price deviation to open safety orders (%)', step=0.25, minval=0.0, group="Trade Entry Settings") / 100
safe_order_volume_scale = input.float(2.0, step=0.5, title='Safety order volume scale', group="Trade Entry Settings")
safe_order_step_scale = input.float(1.4, step=0.1, title='Safety order step scale', group="Trade Entry Settings")
max_safe_order = input(5, title='Max safety orders', group="Trade Entry Settings")

var current_so = 0
var initial_order = 0.0
var previous_high_value = 0.0
var original_ttp_value = 0.0

// Calculate our key levels
take_profit_level = strategy.position_avg_price * (1 + take_profit)

if tp_choice == "Target Take Profit (%)"
    take_profit_level := strategy.position_avg_price * (1 + take_profit)
else
    take_profit_level := take_profit

fib_trigger = bool(false)
if fib_choice == "2-Higher than the top of the Downtrend Fib zone"
    fib_trigger := ta.crossover(sourceInput, lf)
else if fib_choice == "1-To the bottom of Downtrend Fib zone"
    fib_trigger := sourceInput <= ll
else if fib_choice == "3-Higher than the bottom of Ranging Fib Zone"
    fib_trigger := ta.crossover(sourceInput, cfl)
else if fib_choice == "4-Higher than the top of Ranging Fib Zone"
    fib_trigger := ta.crossover(sourceInput, cfh)
else if fib_choice == "5-Higher than the bottom of Uptrend Fib Zone"
    fib_trigger := ta.crossover(sourceInput, hf)
else if fib_choice == "6-To the top of Uptrend Fib Zone"
    fib_trigger := sourceInput >= hl


// If option enabled for enter trades only when DI is positive, then open trade based on user settings
if di_choice == true and strategy.position_size == 0 and sourceInput > 0 and inDateRange and fib_trigger and adx >= adx_min and di_plus > di_minus and di_inrange
    strategy.entry('Long @' + str.tostring(sourceInput)+'💎✋🤚', strategy.long, qty=base_order / sourceInput)
    initial_order := sourceInput
    current_so := 1
    previous_high_value := 0.0
    fib_trigger := false
    original_ttp_value := 0
    original_ttp_value
    
// Open First Position when candle source value crosses above the 'Low Fibonacci Border-1'
else if di_choice == false and strategy.position_size == 0 and sourceInput > 0 and inDateRange and fib_trigger and adx >= adx_min and di_inrange
    strategy.entry('Long @' + str.tostring(sourceInput)+'💎✋🤚', strategy.long, qty=base_order / sourceInput)
    initial_order := sourceInput
    current_so := 1
    previous_high_value := 0.0
    fib_trigger := false
    original_ttp_value := 0
    original_ttp_value
    
threshold = 0.0
    
if safe_order_step_scale == 1.0
    threshold := initial_order - initial_order * price_deviation * safe_order_step_scale * current_so
    threshold

else if current_so <= max_safe_order
    threshold := initial_order - initial_order * ((price_deviation * math.pow(safe_order_step_scale, current_so) - price_deviation) / (safe_order_step_scale - 1))
    threshold

else if current_so > max_safe_order
    threshold := initial_order - initial_order * ((price_deviation * math.pow(safe_order_step_scale, max_safe_order) - price_deviation) / (safe_order_step_scale - 1))
    threshold
    
// Average down when lowest candle value crosses below threshold
if current_so > 0 and low <= threshold and current_so <= max_safe_order and previous_high_value == 0.0
    // Trigger a safety order at the Safety Order "threshold" price
    strategy.entry('😨🙏 SO ' + str.tostring(current_so) + '@' + str.tostring(threshold), direction=strategy.long, qty=safe_order * math.pow(safe_order_volume_scale, current_so - 1) / threshold)
    current_so += 1
    current_so

// Take Profit!
// Take profit when take profit level is equal to or higher than the high of the candle
if take_profit_level <= high and strategy.position_size > 0 or previous_high_value > 0.0
    if trailing > 0.0
        if previous_high_value > 0.0
            if high >= previous_high_value
                previous_high_value := sourceInput
                previous_high_value
            else
                previous_high_percent = (previous_high_value - original_ttp_value) * 1.0 / original_ttp_value
                current_high_percent = (high - original_ttp_value) * 1.0 / original_ttp_value
                if previous_high_percent - current_high_percent >= trailing
                    strategy.close_all(comment='Close (trailing) @' + str.tostring(truncate(current_high_percent * 100, 3)) + '%')
                    current_so := 0
                    previous_high_value := 0
                    original_ttp_value := 0
                    original_ttp_value
        else
            previous_high_value := high
            original_ttp_value := high
            original_ttp_value
    else
        strategy.close_all(comment='💰 Close @' + str.tostring(high))
        current_so := 0
        previous_high_value := 0
        original_ttp_value := 0
        original_ttp_value

// Plot Fibonacci Areas
fill(plot(hl, title='High Fibonacci Border-1', color=color.new(#53ed0f, 50), linewidth=3), plot(hf, title='High Fibonacci Border-2', color=color.new(#38761d, 50), linewidth=3), color=color.new(#00FFFF, 80), title='Uptrend Fibonacci Zone @ 23.6%')  //uptrend zone
fill(plot(cfh, title='Center Low Fibonacci Border-1', color=color.new(#0589f4, 50), linewidth=3), plot(cfl, title='Center Low Fibonacci Border-2', color=color.new(#2018ff, 50), linewidth=3), color=color.new(color.blue, 80), title='Ranging Fibonacci Zone @ 61.8%')  // ranging zone
fill(plot(lf, title='Low Fibonacci Border-1', color=color.new(color.yellow, 50), linewidth=3), plot(ll, title='Low Fibonacci Border-2', color=color.new(color.red, 50), linewidth=3), color=color.new(color.orange, 80), title='Downtrend Fibonacci Zone @ 76.4%')  //down trend zone

// Plot TP
plot(strategy.position_size > 0 ? take_profit_level : na, style=plot.style_linebr, color=color.green, linewidth=2, title="Take Profit")

// Plot All Safety Order lines except for last one as bright blue
plot(strategy.position_size > 0 and current_so <= max_safe_order and current_so > 0 ? threshold : na, style=plot.style_linebr, color=color.new(#00ffff,0), linewidth=2, title="Safety Order")

// Plot Last Safety Order Line as Red
plot(strategy.position_size > 0 and current_so > max_safe_order ? threshold : na, style=plot.style_linebr, color=color.red, linewidth=2, title="No Safety Orders Left")

// Plot Average Position Price Line as Orange
plot(strategy.position_size > 0 ? strategy.position_avg_price : na, style=plot.style_linebr, color=color.orange, linewidth=2, title="Avg Position Price")

// Fill TP Area and SO Area
h1 = plot(strategy.position_avg_price, color=color.new(#000000,100), title="Avg Price Plot Area", display=display.none, editable=false)
h2 = plot(take_profit_level, color=color.new(#000000,100), title="Take Profit Plot Area", display=display.none, editable=false)
h3 = plot(threshold, color=color.new(#000000,100), title="SO Plot Area", display=display.none, editable=false)

// Fill TP Area and SO Area
fill(h1,h2,color=color.new(#38761d,80), title="Take Profit Plot Area")
// Current SO Area
fill(h1,h3,color=color.new(#3d85c6,80), title="SO Plot Area")