Estratégia de filtragem de análise de correção de índice

Visão geral
A estratégia usa uma combinação de modelagem e média móvel de índice para implementar um filtro de tendência fortemente aleatório para determinar a direção da posição. A estratégia primeiro calcula se o preço é dividido por um saldo de um número definido de 0 e, se for 0, um sinal de negociação é emitido. Este sinal fica em branco se estiver abaixo da média móvel do índice; se estiver acima da média móvel do índice, faça mais. A estratégia combina a aleatoriedade das operações matemáticas com o julgamento de tendências de indicadores técnicos, usando verificação de cruzamento entre diferentes indicadores periódicos, filtrando efetivamente o comportamento aleatório que impacta parcialmente o preço.
Princípio da estratégia
- Configure o valor de entrada de preço a para o preço de fechamento close, que pode ser alterado; configure o valor de divisão b para 4, que pode ser alterado.
- Calcule o restante de a dividido por b, modulo, para determinar se o restante é 0。
- O indicador MALen é definido como uma média móvel de 70 ciclos, que serve como um indicador de tendências de preços de médio e longo prazo.
- Quando o resíduo modulo é 0, o sinal de negociação é gerado, e a relação com a EMA determina a direção. Quando o preço atravessa a linha EMA acima, o sinal de compra é gerado. Quando o preço atravessa a linha EMA abaixo, o sinal de venda é gerado.
- As entradas de negociação entram em posições de compra ou venda de acordo com a direção do sinal. A estratégia pode limitar a abertura de posições reversíveis para controlar o número de negociações.
- A condição de parada é definida de acordo com três tipos de parada: parada fixa, parada ATR e parada de variação de preço. A condição de parada é a inversão da parada.
- Pode-se escolher se usar o Stop Loss móvel para bloquear mais lucros, não sendo usado por padrão.
Análise de vantagens
- A aleatoriedade da simulação evita a influência das oscilações de preços e, em combinação com o julgamento de tendências de médias móveis, pode filtrar efetivamente alguns sinais inativos.
- As médias móveis exponenciais são usadas como indicadores de tendências de médio e longo prazo, em combinação com sinais de curto prazo de operações modulares, permitindo verificação em vários níveis e evitando sinais falsos.
- A configuração de parâmetros personalizáveis é muito flexível, permitindo ajustar os parâmetros de acordo com diferentes mercados, procurando a melhor combinação de parâmetros.
- A integração de várias formas de parar perdas permite controlar o risco e, ao mesmo tempo, estabelece condições de parada para bloquear os lucros.
- Apoia a abertura de posição inversa direta, permitindo a troca de posições sem problemas. Também é possível desativar esta função para reduzir o número de transações.
Análise de Riscos
- A configuração inadequada dos parâmetros pode resultar na geração de sinais de transação excessivos, aumentando a frequência de transação e os custos de deslizamento.
- A média móvel é o único indicador de tendências que pode gerar atraso e perder o momento de uma reversão de preço.
- O método de parada fixa pode ser muito mecânico e não pode ser adaptado às flutuações do mercado.
- A abertura de posições diretamente reversíveis aumenta a frequência de ajustes de posições e aumenta os custos e riscos de negociação.
Direção de otimização
- Pode-se testar diferentes indicadores de linha média em vez da EMA, ou combinar o uso da EMA com outras linhas médias para ver se a taxa de lucro pode ser melhorada.
- Pode-se tentar combinar filtros de cálculo de módulos com outras estratégias, como bandas de brinquedo, K-linhas, etc., para formar filtros mais estáveis.
- Pode-se estudar a forma de se adaptar ao stop loss, ajustando a distância de stop loss de acordo com a volatilidade do mercado.
- Pode-se definir o número de transações ou o limite de perda para limitar o número de posições abertas diretamente para trás.
Resumir
A estratégia permite uma combinação eficaz de filtragem aleatória com o julgamento de tendências de médias móveis por meio de operações de simulação. A configuração de parâmetros é flexível e pode ser ajustada e otimizada de acordo com diferentes condições de mercado, resultando em sinais de negociação mais confiáveis. Ao mesmo tempo, integra vários mecanismos de controle de risco de perda, bem como parada e parada móvel para bloquear os lucros.
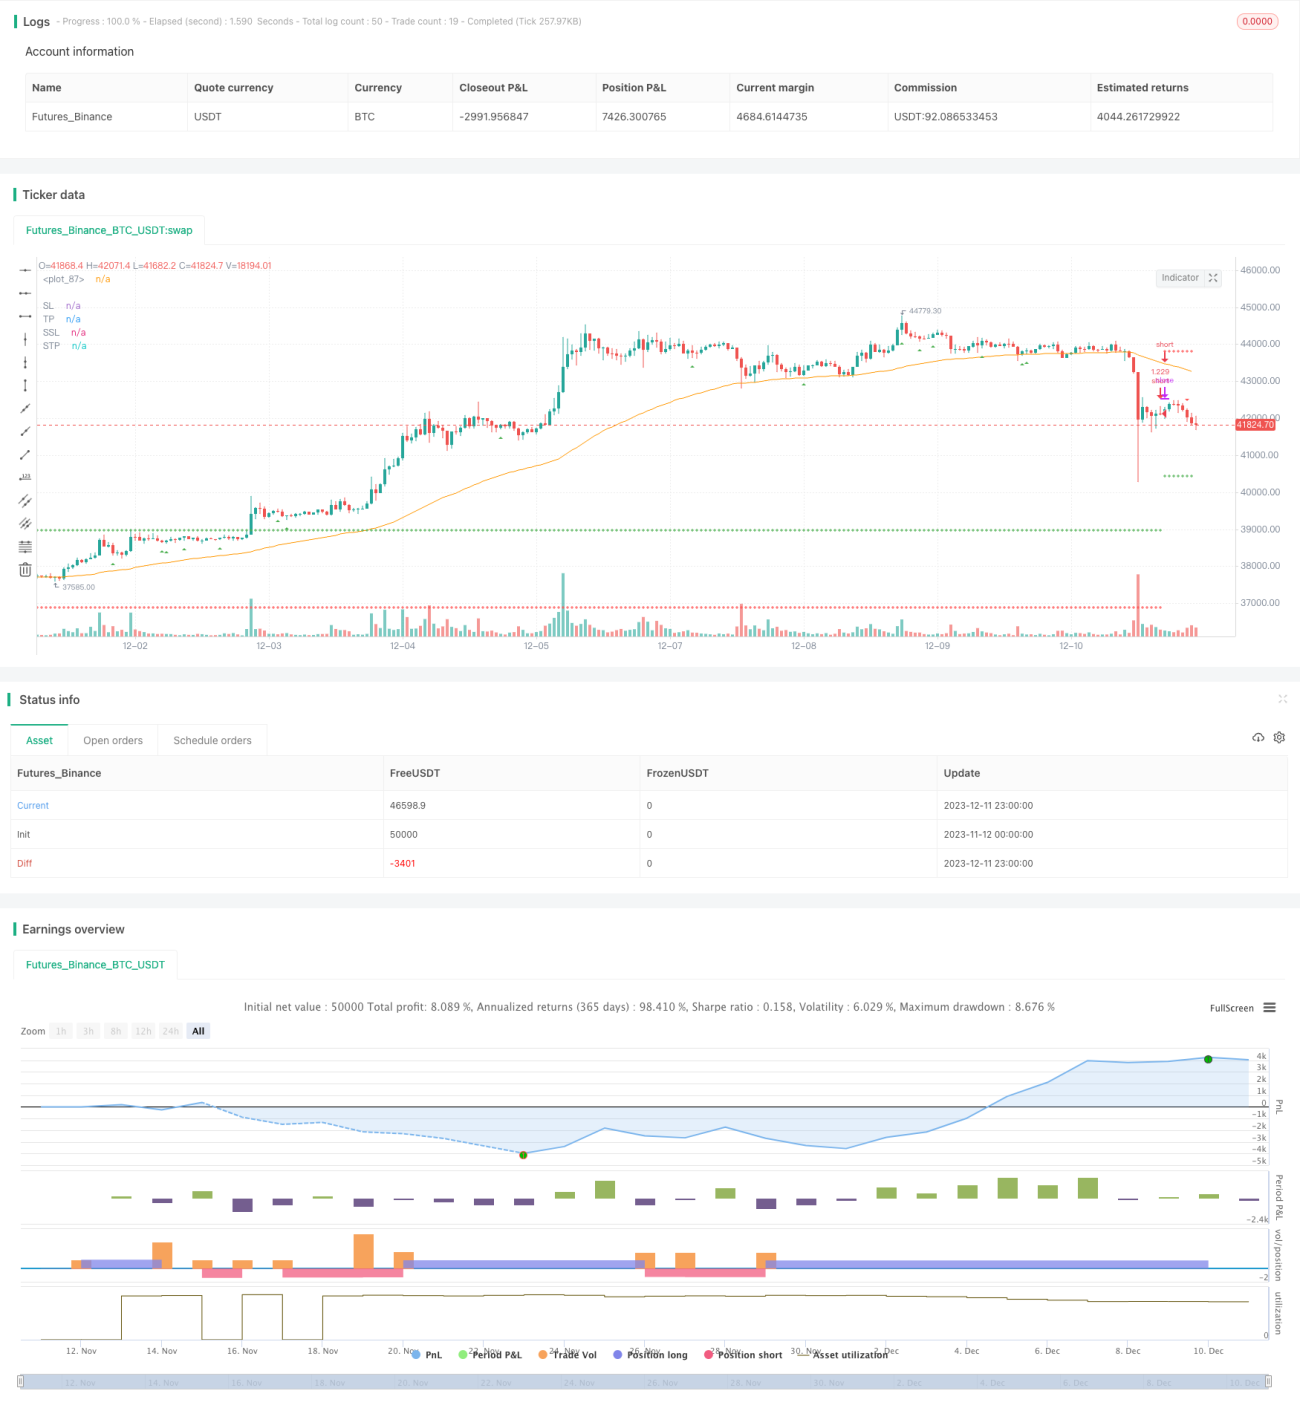
/*backtest
start: 2023-11-12 00:00:00
end: 2023-12-12 00:00:00
period: 1h
basePeriod: 15m
exchanges: [{"eid":"Futures_Binance","currency":"BTC_USDT"}]
*/

// This source code is subject to the terms of the Mozilla Public License 2.0 at https://mozilla.org/MPL/2.0/
// © tweakerID

// To understand this strategy first we need to look into the Modulo (%) operator. The modulo returns the remainder numerator - 1