Estratégia de reversão de tendência ideológica dinâmica

Visão geral
A estratégia de reversão de tendência de ideologia dinâmica usa a regressão linear para prever o preço e, em combinação com a ideologia que forma a média móvel, gera sinais de negociação. Produz um sinal de compra quando o preço previsto atravessa a média móvel de baixo para cima; Produz um sinal de venda quando o preço previsto atravessa a média móvel de cima para baixo, para capturar a reversão de tendência.
Princípio da estratégia
- Regressão linear do preço das ações calculado com base no volume de transações, obtendo o valor previsto do preço
- Calculando a média móvel em diferentes condições
- Quando o preço previsto atravessa a média móvel de baixo para cima, gera um sinal de compra
- Quando o preço previsto atravessa a média móvel de cima para baixo, gera um sinal de venda
- O indicador MACD e o tempo de reversão da tendência
Os sinais acima são combinados com vários tipos de confirmação, evitando falsas rupturas, o que aumenta a precisão do sinal.
Análise de vantagens
- Utilização de regressão linear para melhorar a precisão do sinal de previsão de tendências de preços
- A combinação de média móvel com a ideologia para capturar a reversão da tendência
- Regressão linear com base no volume de transações é mais econômica
- Combinação de indicadores como MACD para a confirmação múltipla, reduzindo os falsos sinais
Análise de Riscos
- A regressão linear pode ter um grande impacto nos resultados.
- A configuração da média móvel também afeta a qualidade do sinal
- O risco de falsos sinais, apesar do mecanismo de confirmação
- O código pode ser ainda mais otimizado para reduzir o número de transações e aumentar a taxa de lucro
Direção de otimização
- Parâmetros de otimização de regressão linear e média móvel
- Aumentar as condições de confirmação e reduzir a taxa de falsidade
- Combinação de mais fatores para avaliar a inversão da qualidade da tendência
- Optimizar a estratégia de stop loss e reduzir o risco de transações individuais
Resumir
A estratégia de reversão de tendência da ideologia dinâmica integra a previsão de regressão linear e a formação de médias móveis para capturar o momento da reversão de tendência. Comparado a um único indicador, a estratégia tem maior confiabilidade. Ao mesmo tempo, a estratégia pode melhorar ainda mais a qualidade do sinal e os níveis de lucro por meio de ajustes de parâmetros e otimização de condições de confirmação.
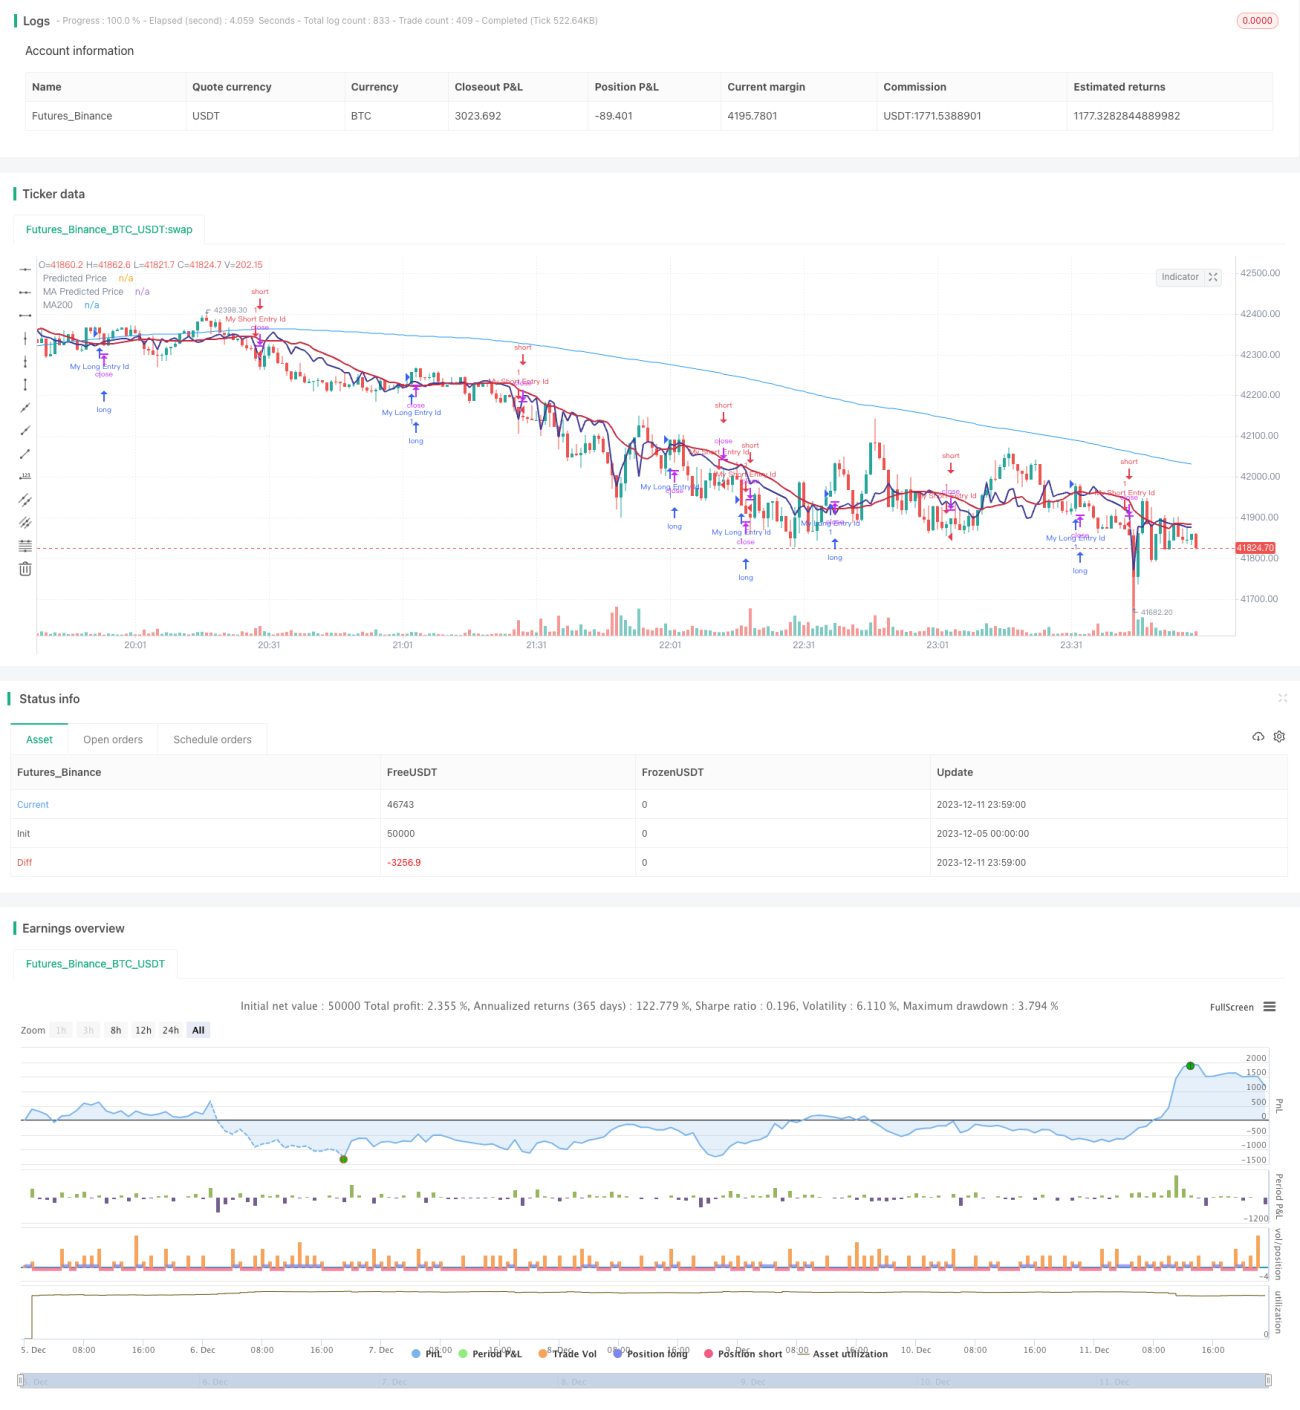
/*backtest
start: 2023-12-05 00:00:00
end: 2023-12-12 00:00:00
period: 1m
basePeriod: 1m
exchanges: [{"eid":"Futures_Binance","currency":"BTC_USDT"}]
*/

// This source code is subject to the terms of the Mozilla Public License 2.0 at https://mozilla.org/MPL/2.0/
// © stocktechbot
//@version=5
strategy("Linear Cross", overlay=true, margin_long=100, margin_short=0)- 1