Estratégia de negociação quantitativa baseada nos indicadores de tendência TRSI e SUPER

Visão geral
Esta estratégia combina um indicador relativamente forte (TRSI) e um indicador de tendência super (SUPER Trend) para formar um conjunto mais completo de estratégias de negociação quantitativa. A estratégia é usada principalmente para capturar tendências de linha média e longa, enquanto os indicadores de curto prazo são usados para filtrar os sinais de negociação de ruído.
Princípio da estratégia
- Calcular o TRSI para determinar se o mercado está em um estado de sobrecompra ou sobrevenda, emitindo um sinal de compra e venda
- Filtração de sinais de ruído usando o indicador SUPER Trend para confirmar a tendência fundamental
- Configurar um Stop Loss em diferentes fases da tabela de ganhos
Concretamente, a estratégia primeiro calcula o indicador TRSI para determinar se há áreas de sobrevenda no mercado, e depois calcula o indicador SUPER Trend para determinar a direção da grande tendência. A combinação dos dois emite um sinal de negociação.
Análise de vantagens
A estratégia tem as seguintes vantagens:
- Combinação de vários indicadores para melhorar a precisão do sinal.
- Aplica-se a negociação de tendências de linhas médias e longas. Os sinais de supercompra e supervenda são propensos a uma reversão de tendência.
- O Stop Loss Stop Set é razoável, o retorno de lucro em diferentes fases e a retirada de fundos em diferentes proporções, o controle eficaz do risco.
Análise de Riscos
A estratégia também apresenta alguns riscos:
- A situação é muito complicada, e a maioria das pessoas não tem dinheiro para investir, mas não têm dinheiro para investir.
- O parâmetro TRSI está mal configurado, podendo ter perdido um intervalo de super-compra e super-venda.
- Os parâmetros SUPER Trend não estão configurados corretamente e podem emitir sinais errados.
- O espaço de parada é grande demais para controlar o risco de forma eficaz.
Para responder a esses riscos, podemos fazer otimizar as seguintes coisas:
Direção de otimização
- A combinação de mais indicadores de curto prazo para identificar mais oportunidades de negociação.
- Ajustar os parâmetros TRSI para reduzir o intervalo de erro.
- Testar e otimizar os parâmetros da SUPER Trend.
- Configure um stop-loss flutuante e acompanhe o stop-loss em tempo real.
Resumir
Esta estratégia combina vários indicadores, como o TRSI e a SUPER Trend, para formar uma estratégia de negociação quantitativa mais completa. Pode identificar de forma eficaz a tendência de linha média e longa, ao mesmo tempo em que configura o risco de controle de stop loss.
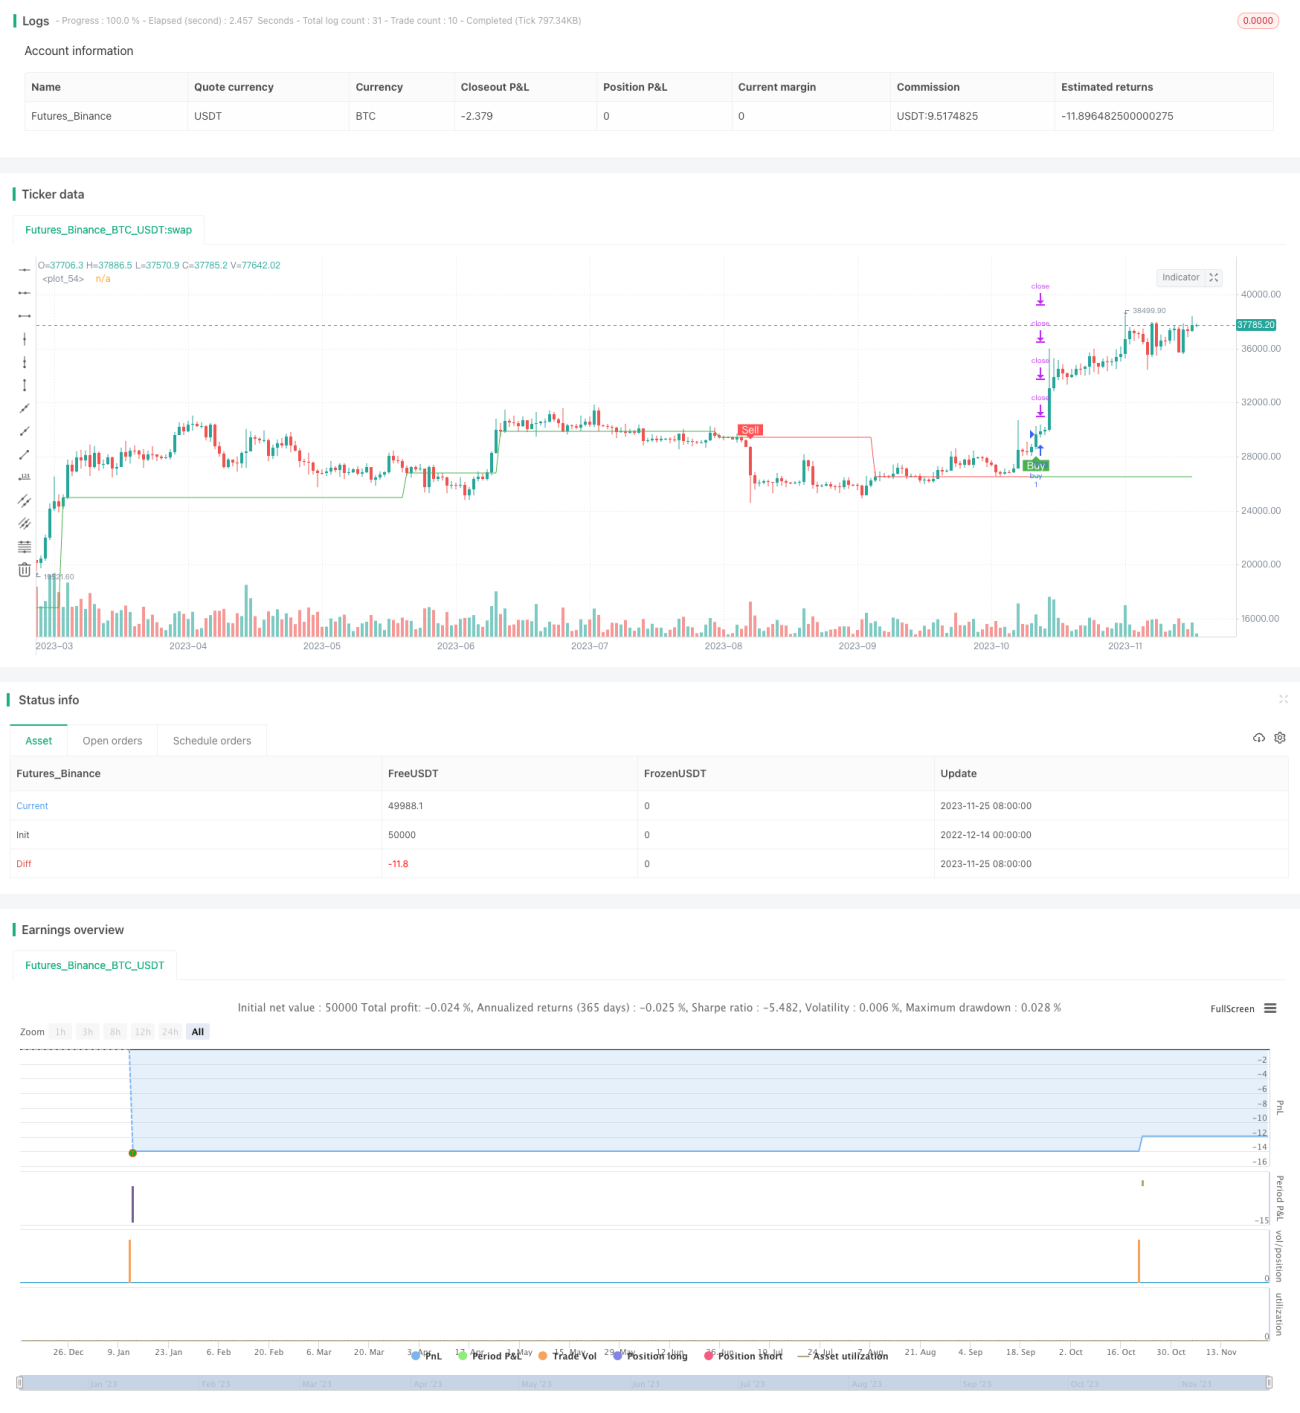
/*backtest
start: 2022-12-14 00:00:00
end: 2023-11-26 05:20:00
period: 1d
basePeriod: 1h
exchanges: [{"eid":"Futures_Binance","currency":"BTC_USDT"}]
*/


//@version=4
strategy(title = "SuperTREX strategy", overlay = true)
strat_dir_input = input(title="Strategy Direction", defval="long", options=["long", "short", "all"])- 1