Indicador RSI combinado com estratégia de negociação de Bandas de Bollinger

Uma visão geral da estratégia
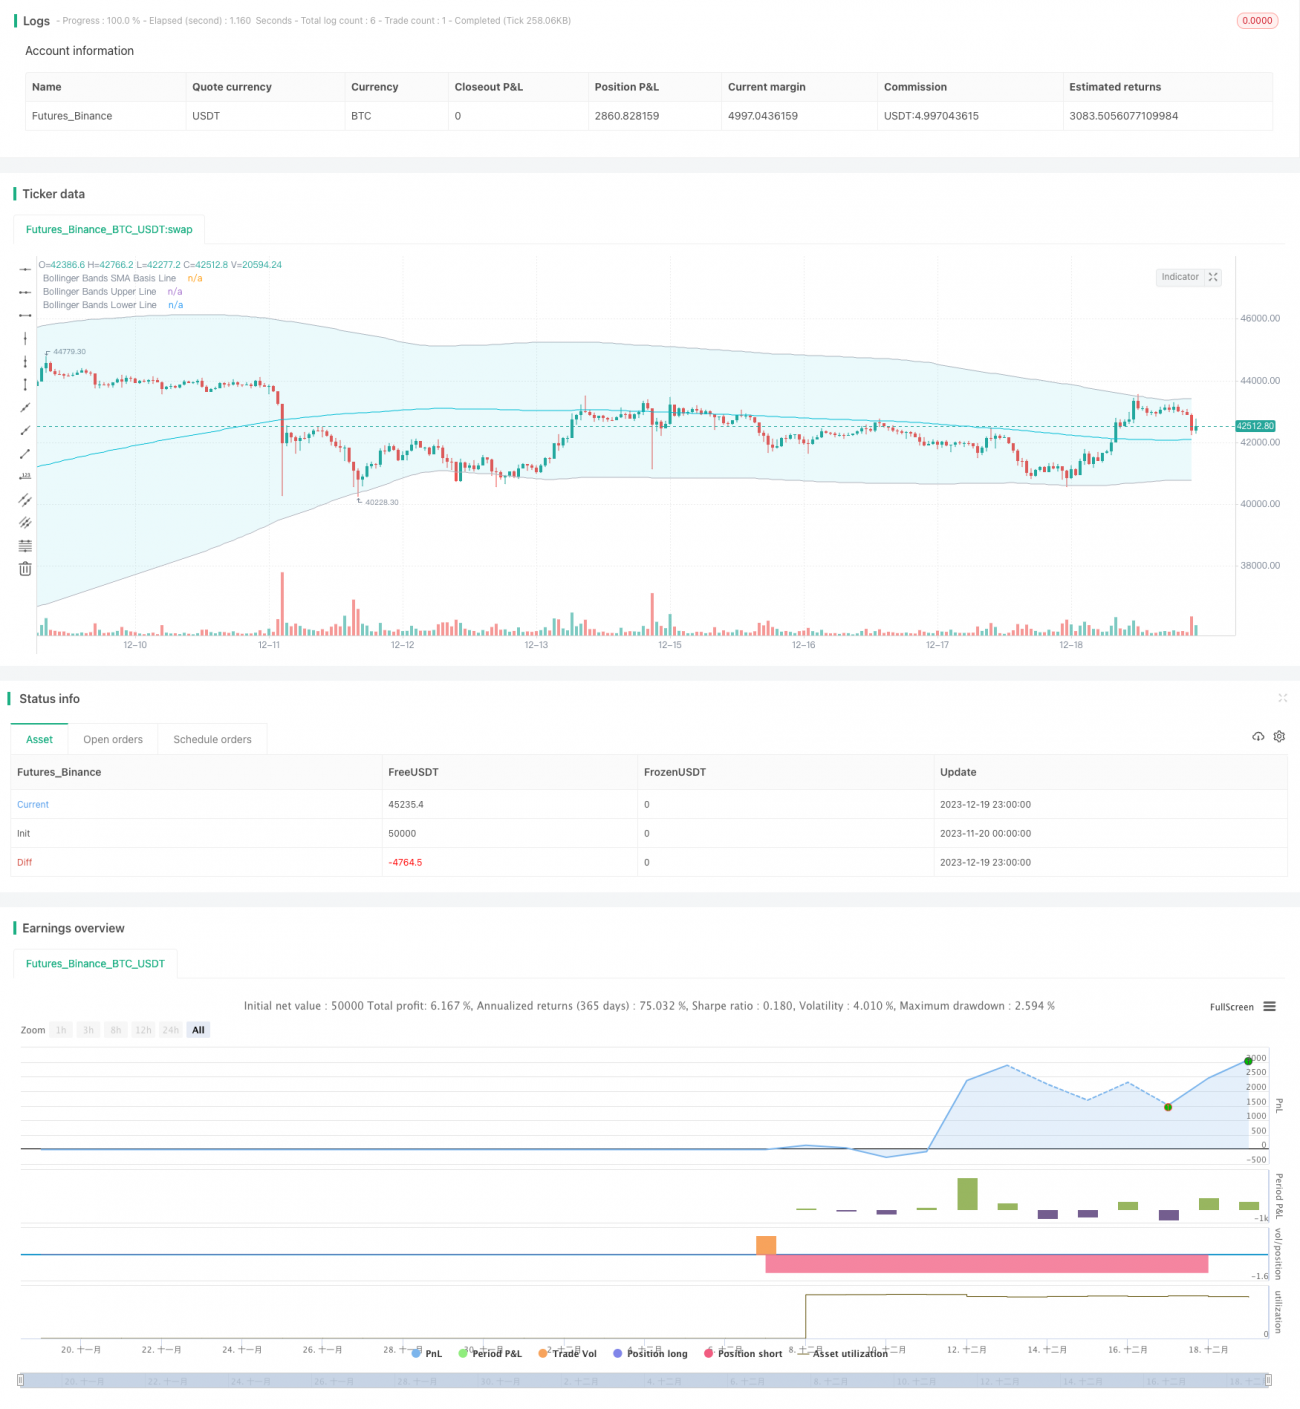
Esta estratégia é chamada de estratégia de stop loss do RSI Bollinger Bands TP/SL. Esta estratégia combina o RSI com o indicador de Bollinger Bands para posicionar a tendência e realizar transações de ruptura.
2. Princípios de estratégia
1. O RSI determina a reversão
O indicador RSI pode determinar se uma ação está em um intervalo de overbought e oversold. Quando o RSI é maior do que a linha de overbought definida, é um overbought, quando é menor do que a linha de overbought definida, é um oversold. Esta estratégia define a linha de overbought como 50 e a linha de oversold como 50.
2. Tendências de julgamento de Brin.
A faixa de Brin calcula a diferença padrão do preço das ações e obtém a trajetória ascendente e descendente das ações. A trajetória ascendente é a linha de resistência e a trajetória descendente é a linha de suporte.
3. A combinação do RSI com o indicador de correlação
Quando o indicador RSI aparece um sinal de inversão inferior, enquanto o preço da ação quebra a faixa de Brin para baixo, considere que o mercado se reverte de baixo para cima, fazendo mais; Quando o indicador RSI aparece um sinal de inversão superior, enquanto o preço da ação cai acima da faixa de Brin, considere que o mercado se reverte de cima para baixo, fazendo o zero.
Três, vantagens estratégicas
1. Filtragem de duplo indicador para aumentar a precisão do sinal
Os indicadores RSI e Brinks são usados para determinar tendências e pontos de reversão. Usados em conjunto, eles podem melhorar a precisão de identificação de verdadeiros sinais de compra e venda e evitar falsas rupturas.
2. Controle de risco do mecanismo de suspensão
A estratégia estabelece um ponto de parada e um ponto de parada para o preço de entrada.(1 + Stop Loss Ratio), o ponto de parada é o preço de entrada(1- Stop Loss Ratio); por outro lado, o shorting pode ser usado para bloquear o lucro, evitar perdas e controlar o risco.
3. Direção de compra e venda personalizada
A estratégia pode optar por apenas fazer mais, apenas fazer menos ou negociar em dois sentidos, o usuário pode escolher diferentes direções de acordo com a situação do mercado, controlando o risco com flexibilidade.
Riscos estratégicos
1. Parâmetros sensíveis à faixa de Bryn
O tamanho padrão da faixa de brinquedos afeta a largura da faixa de brinquedos, afetando a geração de sinais de negociação. Se os parâmetros forem configurados incorretamente, um grande número de sinais errados pode ser gerado.
2. Risco de perda de estacionamento
Se ocorrer uma reversão em V, a configuração de stop loss pode ser muito radical, causando prejuízos desnecessários.
3. Parâmetros sensíveis ao RSI
Os parâmetros do RSI também afetam a forma da curva RSI. Se os parâmetros do RSI estiverem erroneamente definidos, a precisão do sinal de inversão do RSI será reduzida.
Cinco, estratégias de otimização
1. Optimizar o RSI
É possível testar mais variedades de parâmetros de comprimento RSI para encontrar a melhor combinação de parâmetros.
2. Optimizar os parâmetros da faixa de Bryn
É possível testar mais tamanhos de faixa de Bryn e parâmetros de desvio padrão para encontrar a melhor combinação de parâmetros.
3. Teste diferentes proporções de stop loss
Os melhores parâmetros de stop-loss podem ser encontrados através da retrospectiva.
VI. Conclusão
Esta estratégia utiliza um conjunto de indicadores RSI e indicadores de Brinch para determinar tendências e reversões, juntamente com o controle de risco do mecanismo de stop-loss, que pode identificar automaticamente os pontos de compra e venda e parar o stop-loss a tempo. A estratégia também possui alguns riscos e pode ser melhorada principalmente por meio de métodos como otimização de parâmetros.
- 1