Estratégia de alta e baixa de criptomoeda com base em vários indicadores
Visão geral
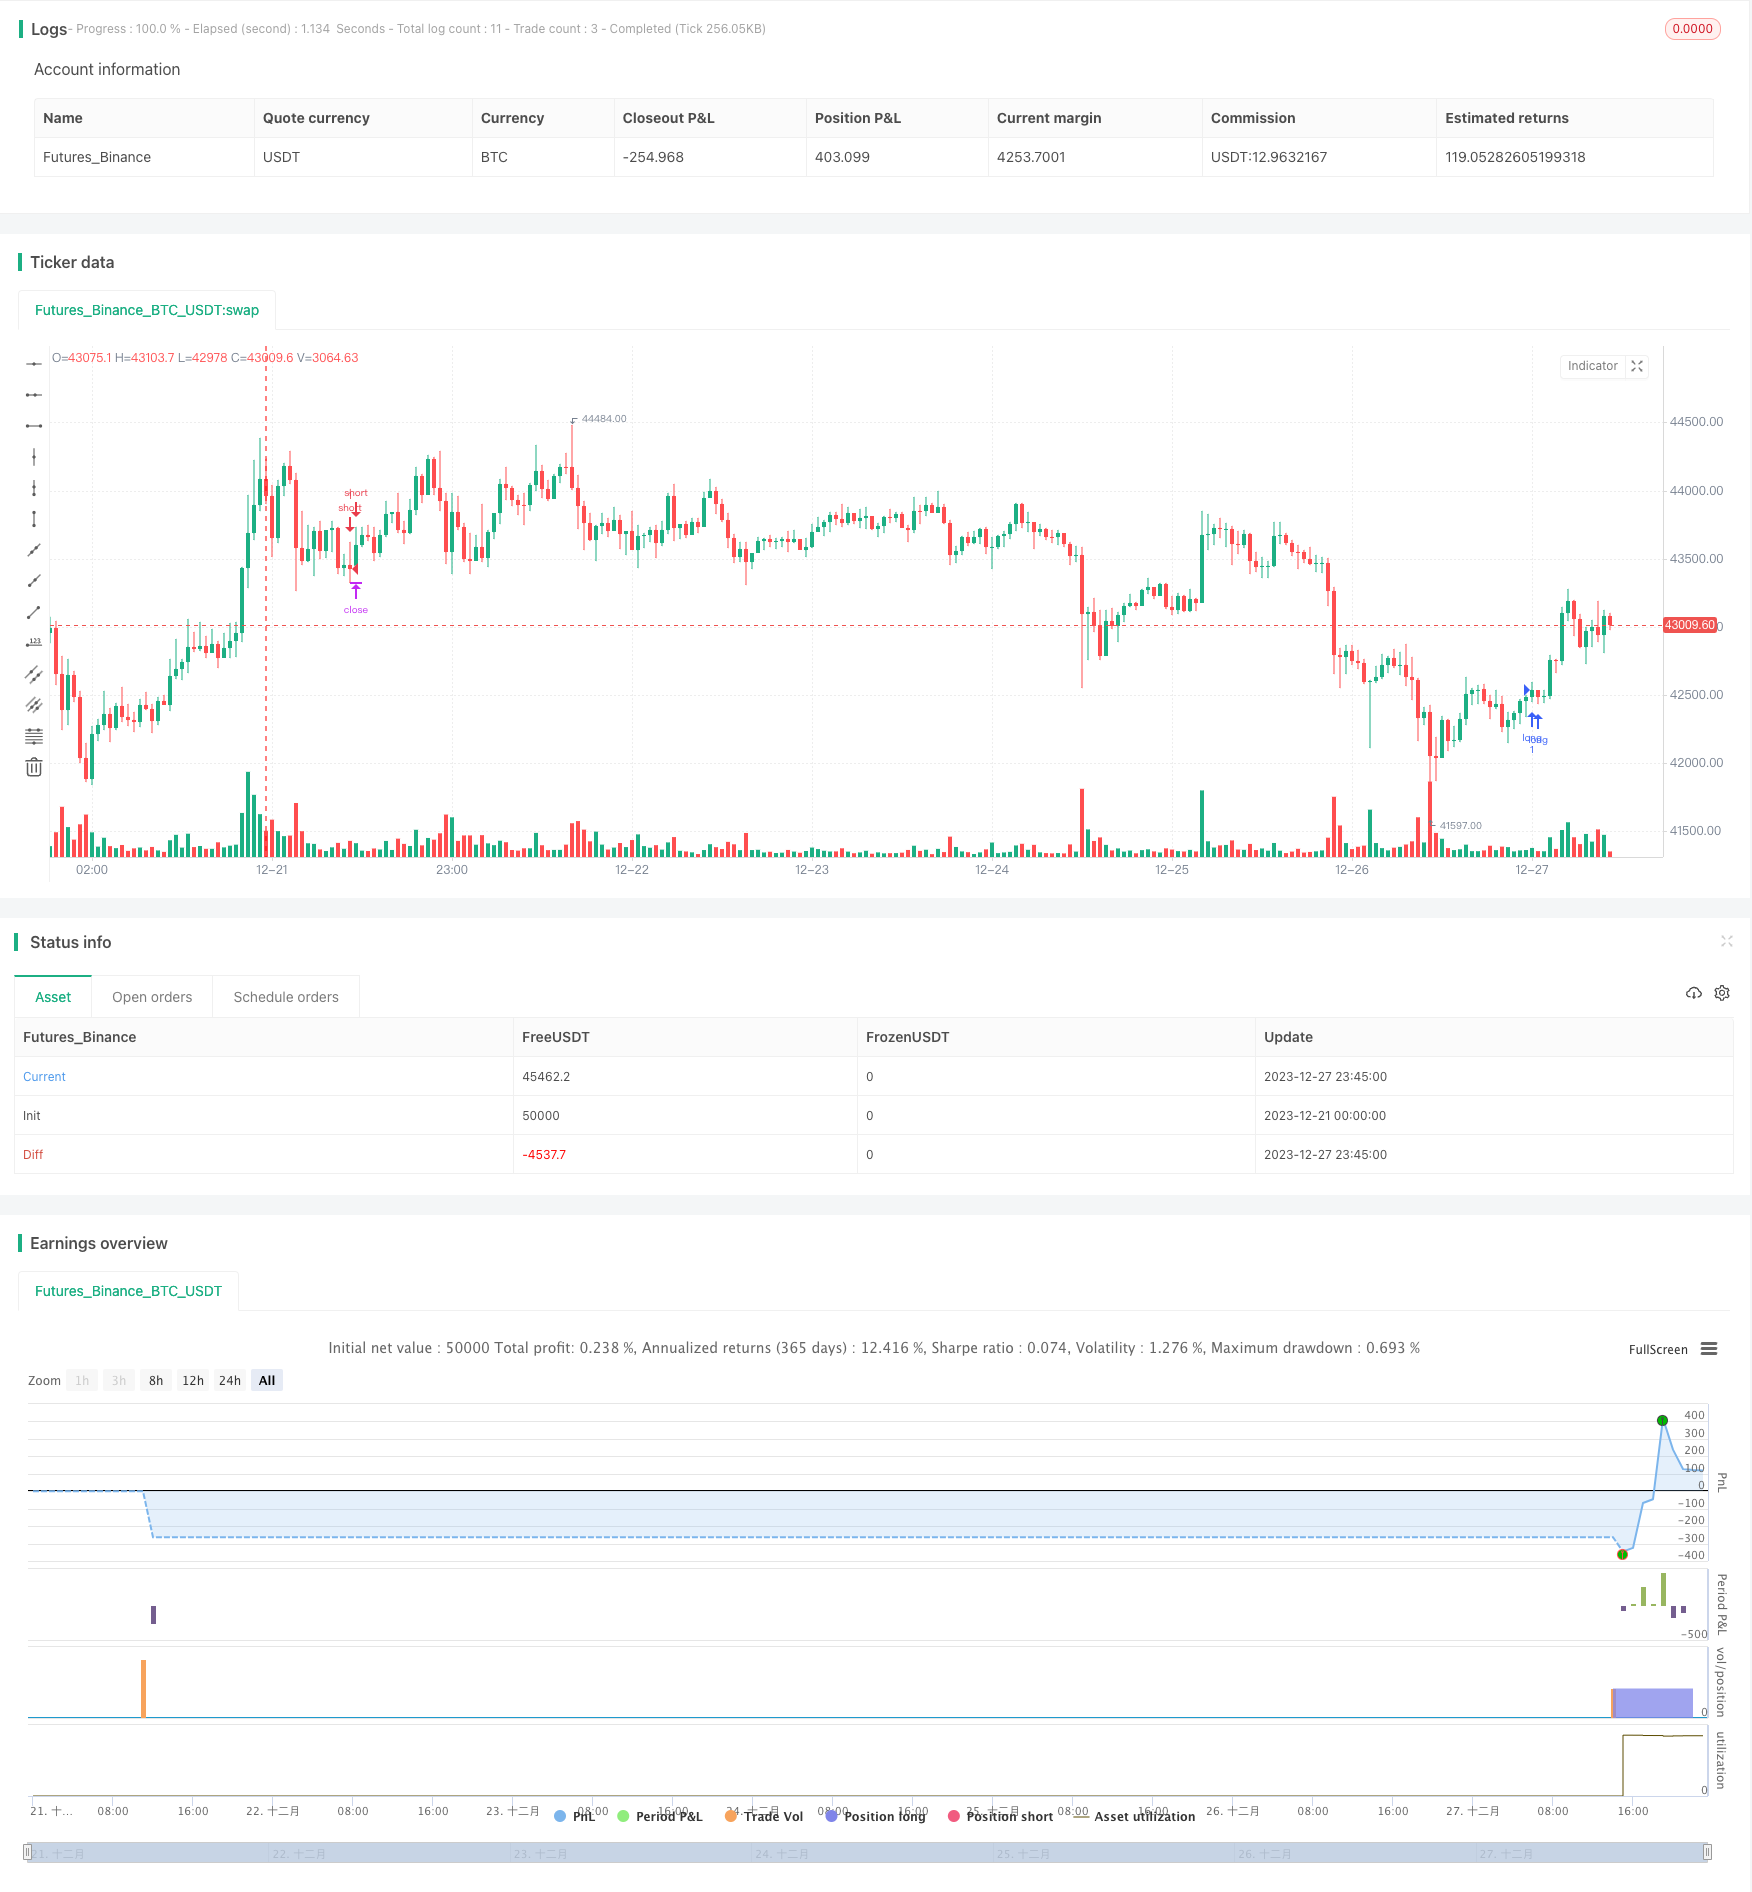
Esta estratégia é uma estratégia de alto e baixo nível para o mercado de criptomoedas. Utiliza vários indicadores, como MACD, PSAR, ATR, Elliott Wave, para negociar em períodos de tempo mais elevados, como 1 hora, 4 horas ou 1 dia. A vantagem da estratégia é a alta taxa de retorno do risco, com um fator de ganho médio de 1,5 a 2,5.
Princípio da estratégia
Os sinais de negociação da estratégia vêm dos altos e baixos do preço e de uma avaliação integrada de vários indicadores. A lógica específica é:
A linha K é um intervalo de preços altos e baixos, ou seja, um alto de inovação contínua e um baixo de inovação contínua.
Verifique o nível do diagrama do MACD
Examine os indicadores PSAR para determinar a direção da tendência.
Examinar os indicadores de tendência do ATR e MA para determinar a direção da tendência.
Verifique se o indicador de ondas de Elliott confirma a direção da tendência.
Se as 5 condições acima apontam para a mesma direção, gera um sinal de fazer mais ou fazer menos.
Vantagens estratégicas
A taxa de retorno do risco é alta, com uma taxa de retorno de até 1:30.
O fator de lucro médio é alto, geralmente entre 1,5 e 2,5.
A combinação de vários indicadores pode filtrar eficazmente as falsas descobertas.
Risco estratégico
A taxa de sucesso é baixa, entre 10% e 20%.
Há um certo risco de retração e de desmontagem.
A eficácia do indicador pode ser afetada pelo cenário de mercado.
É preciso uma maior capacidade de resistência psicológica.
Medidas de resposta:
Aumentar o capital de transação para equilibrar a taxa de ganho.
O que é que você está a fazer?
Ajustar os parâmetros do indicador de acordo com os diferentes mercados.
A construção psicológica e o controle da escala de posições.
Direção de otimização
Parâmetros de indicadores de teste de diferentes criptomoedas e ambientes de mercado.
Aumentar as estratégias de stop loss e stop loss e otimizar a gestão de fundos.
A combinação de métodos de aprendizagem de máquina aumenta a taxa de vitórias.
Aumentar os indicadores de emoção social para filtrar os sinais de transação.
Considere a confirmação de indicadores com múltiplos períodos de tempo.
Resumir
Esta estratégia é uma estratégia de negociação de alto risco e alto rendimento adequada para a criptomoeda. Sua vantagem é a alta taxa de retorno de risco, que pode obter um fator de lucro médio mais alto. O risco está principalmente na baixa taxa de vitória, que requer uma forte capacidade de tolerância psicológica.
/*backtest
start: 2023-12-21 00:00:00
end: 2023-12-28 00:00:00
period: 45m
basePeriod: 5m
exchanges: [{"eid":"Futures_Binance","currency":"BTC_USDT"}]
*/

// This source code is subject to the terms of the Mozilla Public License 2.0 at https://mozilla.org/MPL/2.0/
// © SoftKill21

//@version=4
strategy("Crypto strategy high/low", overlay=true)
fast_length = input(title="Fast Length", type=input.integer, defval=12)
slow_length = input(title="Slow Length", type=input.integer, defval=26)
src = input(title="Source", type=input.source, defval=close)
signal_length = input(title="Signal Smoothing", type=input.integer, minval = 1, maxval = 50, defval = 9)
sma_source = input(title="Simple MA(Oscillator)", type=input.bool, defval=true)
sma_signal = input(title="Simple MA(Signal Line)", type=input.bool, defval=false)
//sar
start = input(0.02)
increment = input(0.02)
maximum = input(0.2)
var bool uptrend = na
var float EP = na
var float SAR = na
var float AF = start
var float nextBarSAR = na
if bar_index > 0
	firstTrendBar = false
	SAR := nextBarSAR
	if bar_index == 1
		float prevSAR = na
		float prevEP = na
		lowPrev = low[1]
		highPrev = high[1]
		closeCur = close
		closePrev = close[1]
		if closeCur > closePrev
			uptrend := true
			EP := high
			prevSAR := lowPrev
			prevEP := high
		else
			uptrend := false
			EP := low
			prevSAR := highPrev
			prevEP := low
		firstTrendBar := true
		SAR := prevSAR + start * (prevEP - prevSAR)
	if uptrend
		if SAR > low
			firstTrendBar := true
			uptrend := false
			SAR := max(EP, high)
			EP := low
			AF := start
	else
		if SAR < high
			firstTrendBar := true
			uptrend := true
			SAR := min(EP, low)
			EP := high
			AF := start
	if not firstTrendBar
		if uptrend
			if high > EP
				EP := high
				AF := min(AF + increment, maximum)
		else
			if low < EP
				EP := low
				AF := min(AF + increment, maximum)
	if uptrend
		SAR := min(SAR, low[1])
		if bar_index > 1
			SAR := min(SAR, low[2])
	else
		SAR := max(SAR, high[1])
		if bar_index > 1
			SAR := max(SAR, high[2])
	nextBarSAR := SAR + AF * (EP - SAR)


// Calculating
fast_ma = sma_source ? sma(src, fast_length) : ema(src, fast_length)
slow_ma = sma_source ? sma(src, slow_length) : ema(src, slow_length)
macd = fast_ma - slow_ma
signal = sma_signal ? sma(macd, signal_length) : ema(macd, signal_length)
hist = macd - signal

CCI = input(20)
ATR = input(5)
Multiplier=input(1,title='ATR Multiplier')
original=input(true,title='original coloring')
thisCCI = cci(close, CCI)
lastCCI = nz(thisCCI[1])
bufferDn= high + Multiplier * sma(tr,ATR)
bufferUp= low - Multiplier * sma(tr,ATR)
if (thisCCI >= 0 and lastCCI < 0)
    bufferUp := bufferDn[1]
if (thisCCI <= 0 and lastCCI > 0)
    bufferDn := bufferUp[1]

if (thisCCI >= 0)
    if (bufferUp < bufferUp[1])
        bufferUp := bufferUp[1]
else
    if (thisCCI <= 0)
        if (bufferDn > bufferDn[1])
            bufferDn := bufferDn[1]
x=0.0
x:=thisCCI >= 0 ?bufferUp:thisCCI <= 0 ?bufferDn:x[1]
swap=0.0

swap:=x>x[1]?1:x<x[1]?-1:swap[1]

swap2=swap==1?color.lime:color.red
swap3=thisCCI >=0 ?color.lime:color.red
swap4=original?swap3:swap2

//elliot wave
srce = input(close, title="source")
sma1length = input(5)
sma2length = input(35)
UsePercent = input(title="Show Dif as percent of current Candle", type=input.bool, defval=true)
smadif=iff(UsePercent,(sma(srce, sma1length) - sma(srce, sma2length)) / srce * 100, sma(srce, sma1length) - sma(srce, sma2length))
col=smadif <= 0 ? color.red : color.green

longC = high > high[1] and high[1] > high[2] and close[2] > high[3] and hist > 0 and uptrend and smadif < 0 and swap4==color.lime
//longC = high > high[1] and high[1] > high[2] and high[2] > high[3] and high[3] > high[4] and close[4] > high[5]
shortC = low < low[1] and low[1] < low[2] and close[2] < low[3] and hist < 0 and not uptrend and  smadif > 0 and swap4==color.red
//shortC = low < low[1] and low[1] < low[2] and low[2] < low[3] and low[3] < low[4] and close[4] < low[5]

tp=input(0.15, title="tp")
sl=input(0.005, title="sl")


strategy.entry("long",1,when=longC)
strategy.entry("short",0,when=shortC)

strategy.exit("x_long", "long" ,loss = close * sl / syminfo.mintick, profit = close * tp / syminfo.mintick , alert_message = "closelong")
//strategy.entry("short",0, when= loss = close * sl / syminfo.mintick)

strategy.exit("x_short", "short" , loss = close * sl / syminfo.mintick, profit  = close * tp / syminfo.mintick,alert_message = "closeshort")
//strategy.entry("long",1, when = loss = close * sl / syminfo.mintick)

//strategy.close("long",when= hist < 0)
//strategy.close("short", when= hist > 0)