Estratégia de realização de lucro residual baseada em pistas duplas longas e curtas
Myo_LS_D estratégia de quantificação
Visão geral
A estratégia de quantificação Myo_LS_D é uma estratégia de tracking stop stop baseada em binários multicoloridos. A estratégia utiliza vários indicadores para construir sinais de negociação, como a linha média, a ruptura de preço e a taxa de retorno do risco.
Princípio da estratégia
A estratégia é composta principalmente por módulos de avaliação de tendências, módulos múltiplos, módulos vazios e módulos de rastreamento de paradas.
O módulo de determinação de tendências usa o canal donchain para determinar a direção geral da tendência. Fazer mais entradas é assumir que está em uma tendência ascendente, enquanto o shorting precisa estar em uma tendência decrescente.
O módulo de multiplicação leva em consideração fatores como novas altas, baixas e posições de linhas médias longas. O módulo de vazio leva em consideração fatores como novas altas, baixas e posições de linhas médias curtas. Isso garante a construção de uma posição quando um ponto de preço crítico é atingido para cima ou para baixo.
O módulo de rastreamento de stop-loss usa a média SMA de dois períodos diferentes para rastrear a mudança de preço em tempo real. Quando o preço cai abaixo da média, o stop-loss é fechado. Este rastreamento em tempo real permite maximizar o lucro na tendência.
A configuração de stop loss deve considerar a expansão do stop loss, garantindo que o ponto de stop loss esteja longe do suporte e evite ser sacudido.
Análise de vantagens
A principal vantagem desta estratégia é a construção de armazéns separados e em vários espaços, acompanhando a estratégia de suspensão. Concretamente, a estratégia se manifesta principalmente em:
A separação de espaços permite maximizar as oportunidades de lucro de uma tendência unilateral.
O rastreamento de paradas permite obter uma maior taxa de lucro através de ajustes em tempo real. Comparado com o método tradicional de paradas, os ganhos são significativamente aumentados.
A expansão do stop loss pode reduzir a probabilidade de ser abalado e reduzir o risco de perdas.
Riscos e soluções
Os principais riscos da estratégia estão concentrados nos seguintes pontos:
O erro de julgamento de tendências pode causar prejuízos na construção de posições em contra-balanço. Os parâmetros da donchain podem ser ajustados adequadamente ou outros indicadores podem ser adicionados para otimizar o julgamento.
O rastreamento de paradas é muito radical e pode prejudicar o lucro sustentável de paradas antecipadas. O aumento apropriado do intervalo entre paradas e linhas médias pode ser otimizado.
A amplitude de suspensão é muito pequena e pode aumentar a probabilidade de ter um tremor. A amplitude de suspensão pode ser aumentada de forma apropriada para reduzir o risco.
Direção de otimização
A estratégia pode ser melhorada nos seguintes aspectos:
Otimizar o módulo de julgamento de tendências para aumentar a precisão de julgamento. Pode ser considerado a combinação de mais indicadores, como o MACD, para realizar.
Ajustar o modo de rastreamento de paradas para expandir ainda mais a margem de lucro. Por exemplo, você pode mover as linhas de paradas em proporção.
Ampliar o perímetro de suspensão ou considerar a redução do perímetro de suspensão para reduzir ainda mais a probabilidade de ser abalado.
Diferentes variedades têm diferentes parâmetros e podem ser treinadas para obter a melhor combinação de parâmetros. Para aumentar ainda mais os lucros da estratégia.
Resumir
A estratégia Myo_LS_D é, em geral, uma estratégia de suspensão de rastreamento de múltiplos espaços mais estável e mais madura. Seus benefícios são evidentes, o risco é controlável e é um dos programas de quantificação que vale a pena usar a longo prazo.
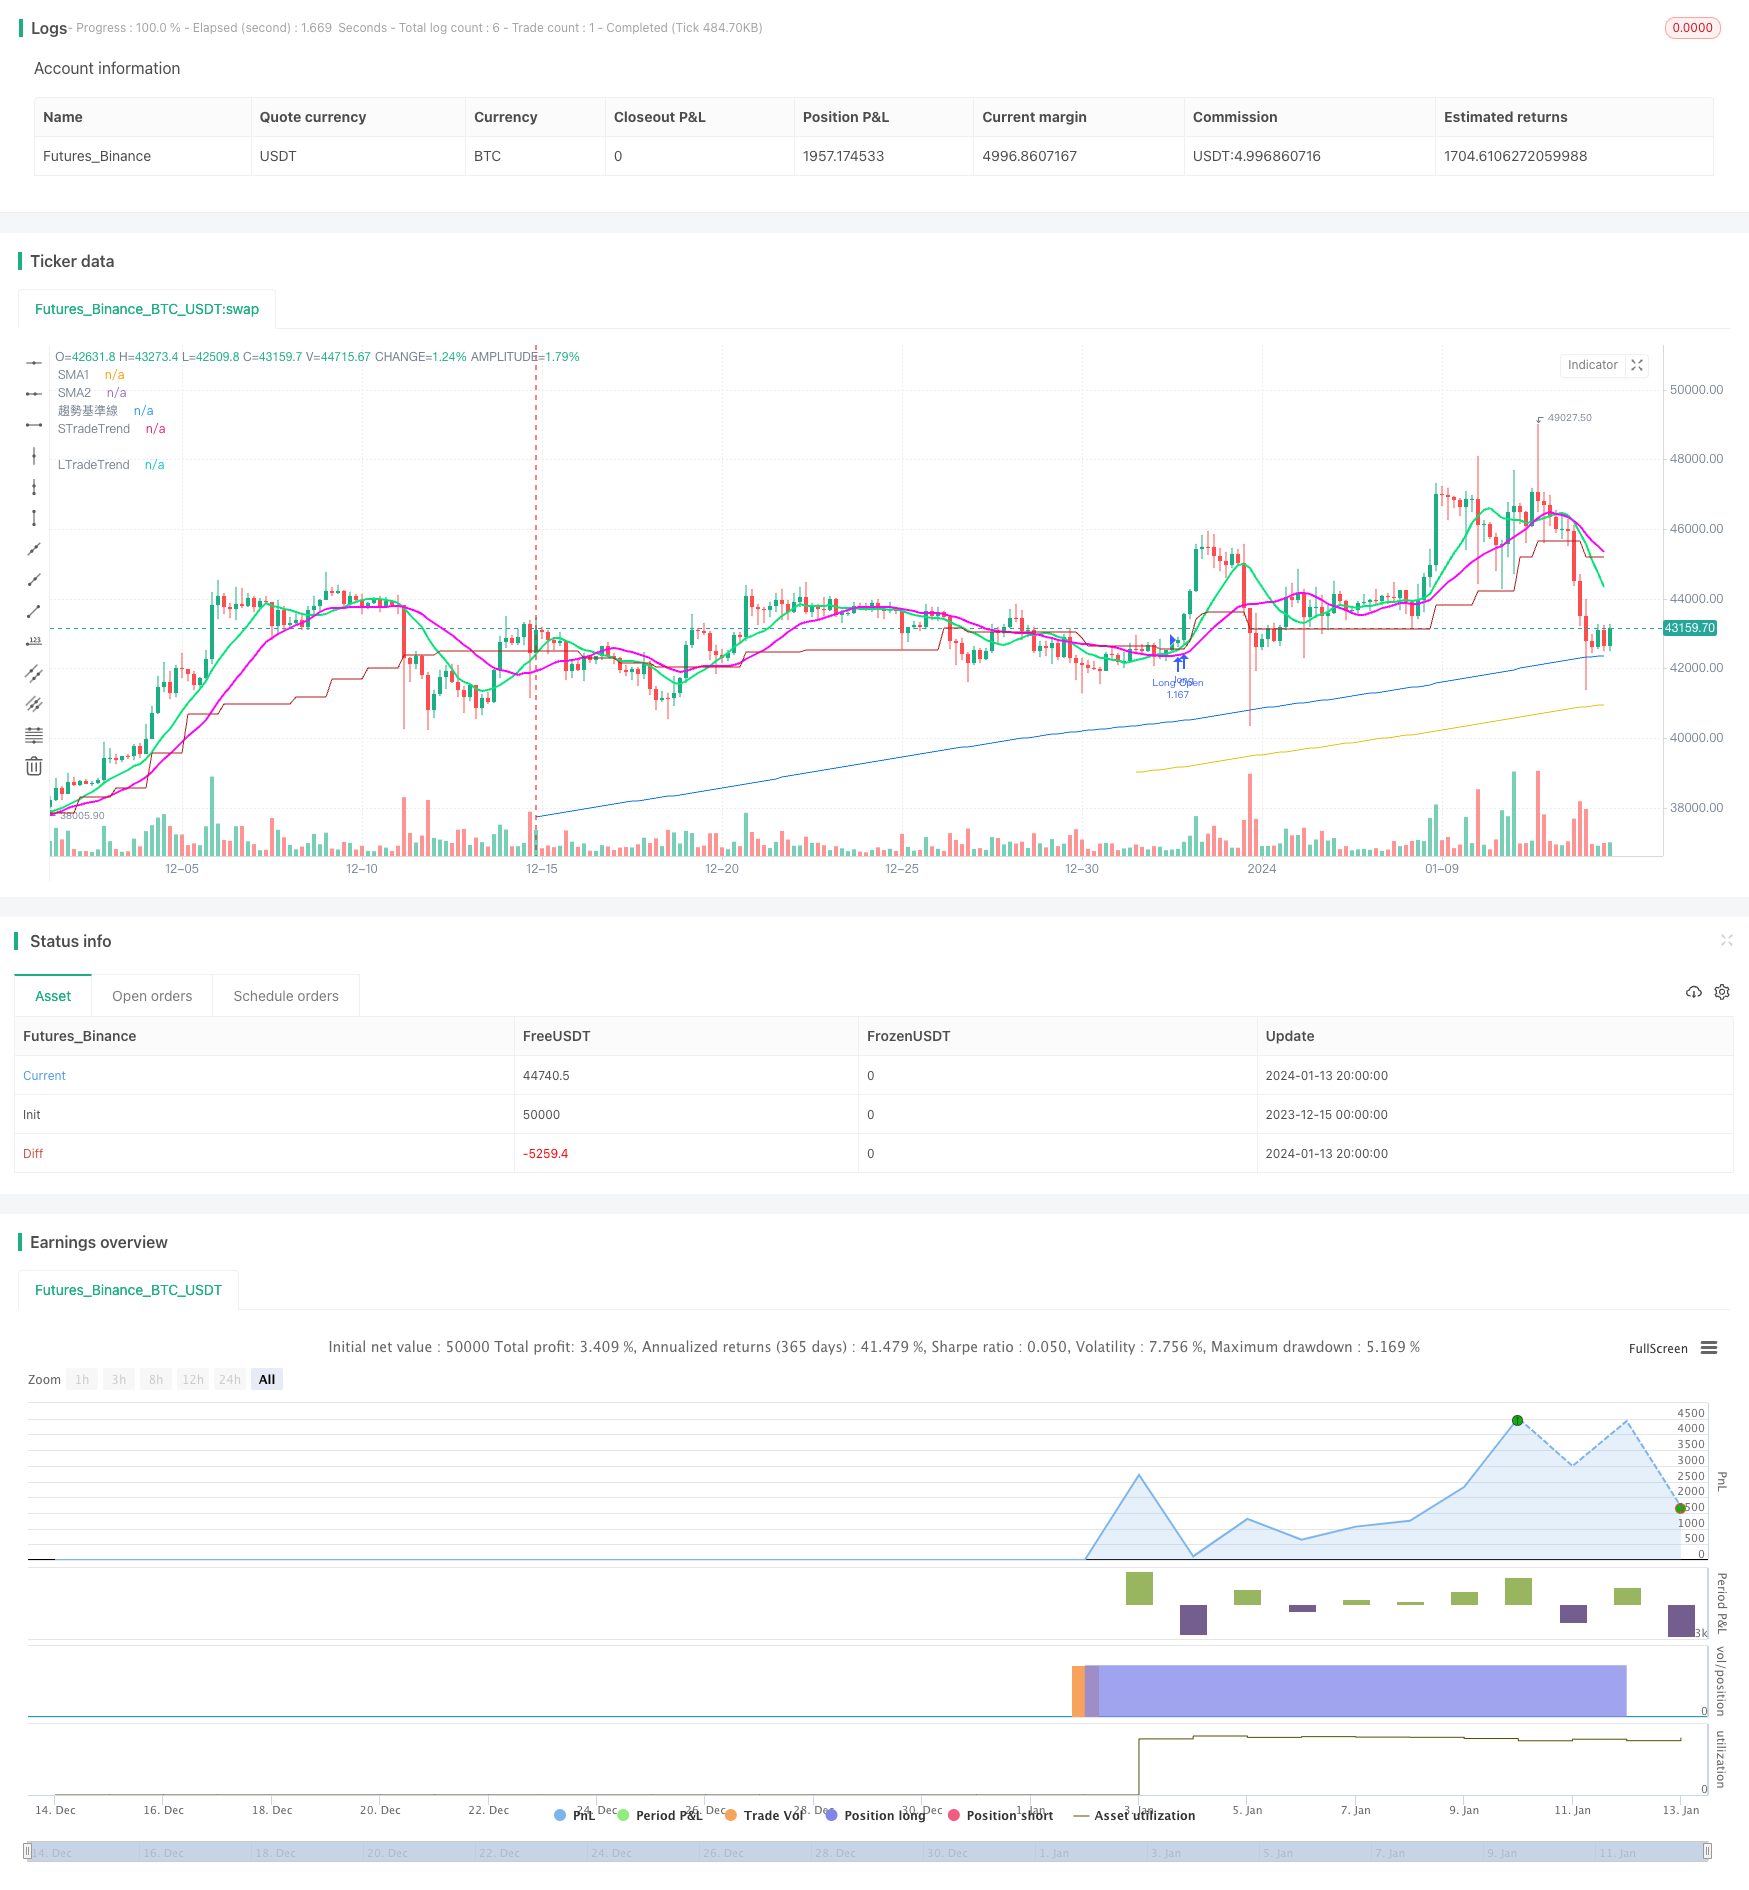
/*backtest
start: 2023-12-15 00:00:00
end: 2024-01-14 00:00:00
period: 4h
basePeriod: 15m
exchanges: [{"eid":"Futures_Binance","currency":"BTC_USDT"}]
*/

// This source code is subject to the terms of the Mozilla Public License 2.0 at https://mozilla.org/MPL/2.0/
// © agresiynin

//@version=5
// ©Myo_Pionex
strategy(
 title                  =   "Myo_simple strategy_LS_D",
 shorttitle             =   "Myo_LS_D",
 overlay                =   true )


// var
lowest_price = ta.lowest(low, 200)
highest_price = ta.highest(high, 200)
min_800 = ta.lowest(low, 800)
max_800 = ta.highest(high, 800)
tp_target_L = min_800 + (max_800 - min_800) * math.rphi
tp_target_S = max_800 - (max_800 - min_800) * math.rphi
sl_length_L = input.int(100, "做多的止損長度", minval = 50, maxval = 300, step = 50)
sl_length_S = input.int(100, "做空的止損長度", minval = 50, maxval = 300, step = 50)
sl_L = lowest_price * (1 - 0.005)
sl_S = highest_price * (1 + 0.005)
rrr_L = tp_target_L - sl_L / sl_L
rrr_S = ta.lowest(low, 800) + ta.highest(high, 800) - ta.lowest(low, 800) * math.rphi / ta.highest(high, 200) + 0.005 * ta.highest(high, 200) - ta.lowest(low, 200) - 0.005 * ta.lowest(low, 200)
smalen1 = input.int(10, "做多追蹤止盈SMA長度1", options = [5, 10, 20, 40, 60, 80])
smalen2 = input.int(20, "做多追蹤止盈SMA長度2", options = [5, 10, 20, 40, 60, 80])
smalen1_S = input.int(5, "做空追蹤止盈SMA長度1", options = [5, 10, 20, 40, 60, 80])
smalen2_S = input.int(10, "做空追蹤止盈SMA長度2", options = [5, 10, 20, 40, 60, 80])
TrendLength_L = input.int(400, "做多趨勢線", options = [100, 200, 300, 400, 500])
TrendLength_S = input.int(300, "做空趨勢線", options = [100, 200, 300, 400, 500])
SMA1 = ta.sma(close, smalen1)
SMA2 = ta.sma(close, smalen2)
SMA1_S = ta.sma(close, smalen1_S)
SMA2_S = ta.sma(close, smalen2_S)
shortlength = input.int(20, "短期均價K線數量")
midlength = input.int(60, "中期均價K線數量")
longlength = input.int(120, "長期均價K線數量")
ShortAvg = math.sum(close, shortlength)/shortlength
MidAvg = math.sum(close, midlength)/midlength
LongAvg = math.sum(close, longlength)/longlength

// Trend
basePeriods = input.int(8, minval=1, title="趨勢基準線")
basePeriods_Short = input.int(26, "做空基準線")
donchian(len) => math.avg(ta.lowest(len), ta.highest(len))
baseLine = donchian(basePeriods)
baseLine_Short = donchian(basePeriods_Short)
trend = request.security(syminfo.tickerid, "D", baseLine)
isUptrend = false
isDowntrend = false
baseLine_D = request.security(syminfo.tickerid, "D", baseLine)
plot(baseLine_D, color=#B71C1C, title="趨勢基準線")
if close[0] > baseLine_D
    isUptrend := true
if close[0] < baseLine_Short
    isDowntrend := true
// Long
// Condition
// entry
con_a = low > lowest_price ? 1 : 0
con_b = high > highest_price ? 1 : 0
con_c = close[0] > ta.sma(close, TrendLength_L) ? 1 : 0
con_d = isUptrend ? 1 : 0
con_e = rrr_L > 3 ? 1 : 0
con_a1 = close[0] > ShortAvg[shortlength] ? 1 : 0
con_b1 = close[0] > MidAvg[midlength] ? 1 : 0

// close
con_f = ta.crossunder(close, SMA1) and ta.crossunder(close, SMA2) ? 1 : 0
con_g = close < ta.lowest(low, sl_length_L)[1] * (1 - 0.005) ? 1 : 0

// exit
con_h = tp_target_L

// Main calculation
LongOpen = false
AddPosition_L = false

if con_a + con_b + con_c + con_e + con_a1 + con_b1 >= 4 and con_d >= 1
    LongOpen := true
// Short
// Condition
// entry
con_1 = high < highest_price ? 1 : 0
con_2 = low < lowest_price ? 1 : 0
con_3 = close[0] < ta.sma(close, TrendLength_S) ? 1 : 0
con_4 = isDowntrend ? 1 : 0
con_5 = rrr_S > 3 ? 1 : 0
con_11 = close[0] < ShortAvg[shortlength] ? 1 : 0
con_12 = close[0] < MidAvg[midlength] ? 1 : 0

// close
con_6 = ta.crossover(close, SMA1_S) and ta.crossover(close, SMA2_S) ? 1 : 0
con_7 = close > ta.highest(high, sl_length_S)[1] * (1 + 0.005) ? 1 : 0

// exit
con_8 = tp_target_S

// Main calculation
ShortOpen = false
AddPosition_S = false

if con_1 + con_2 + con_3 + con_4 + con_5 + con_11 + con_12 >= 5
    ShortOpen := true

//
// execute
//
strategy.initial_capital = 50000
if strategy.position_size == 0
    if LongOpen
        strategy.entry("Long Open" , strategy.long , comment= "Long Open " + str.tostring(close[0]), qty=strategy.initial_capital/close[0])

if strategy.position_size > 0
    if (con_f > 0 or con_g > 0 or ShortOpen) and close <= baseLine_D
        strategy.close_all(comment="Close Long " + str.tostring(close[0]))

if strategy.position_size == 0
    if ShortOpen
        strategy.entry("Short Open" , strategy.short , comment= "Short Open " + str.tostring(close[0]), qty=strategy.initial_capital/close[0])

if strategy.position_size < 0
    if (con_6 > 0 or con_7 > 0 or LongOpen) and close >= baseLine_D
        strategy.close_all(comment="Close Short " + str.tostring(close[0]))


plot(ta.sma(close, TrendLength_L), color=#e5c212, title="LTradeTrend")
plot(ta.sma(close, TrendLength_S), color=#1275e5, title="STradeTrend")
plot(SMA1, "SMA1", color = color.lime, linewidth = 2)
plot(SMA2, "SMA2", color = color.rgb(255, 0, 255), linewidth = 2)