Estratégia de acompanhamento de tendência do canal de preço de média móvel dupla
Visão geral
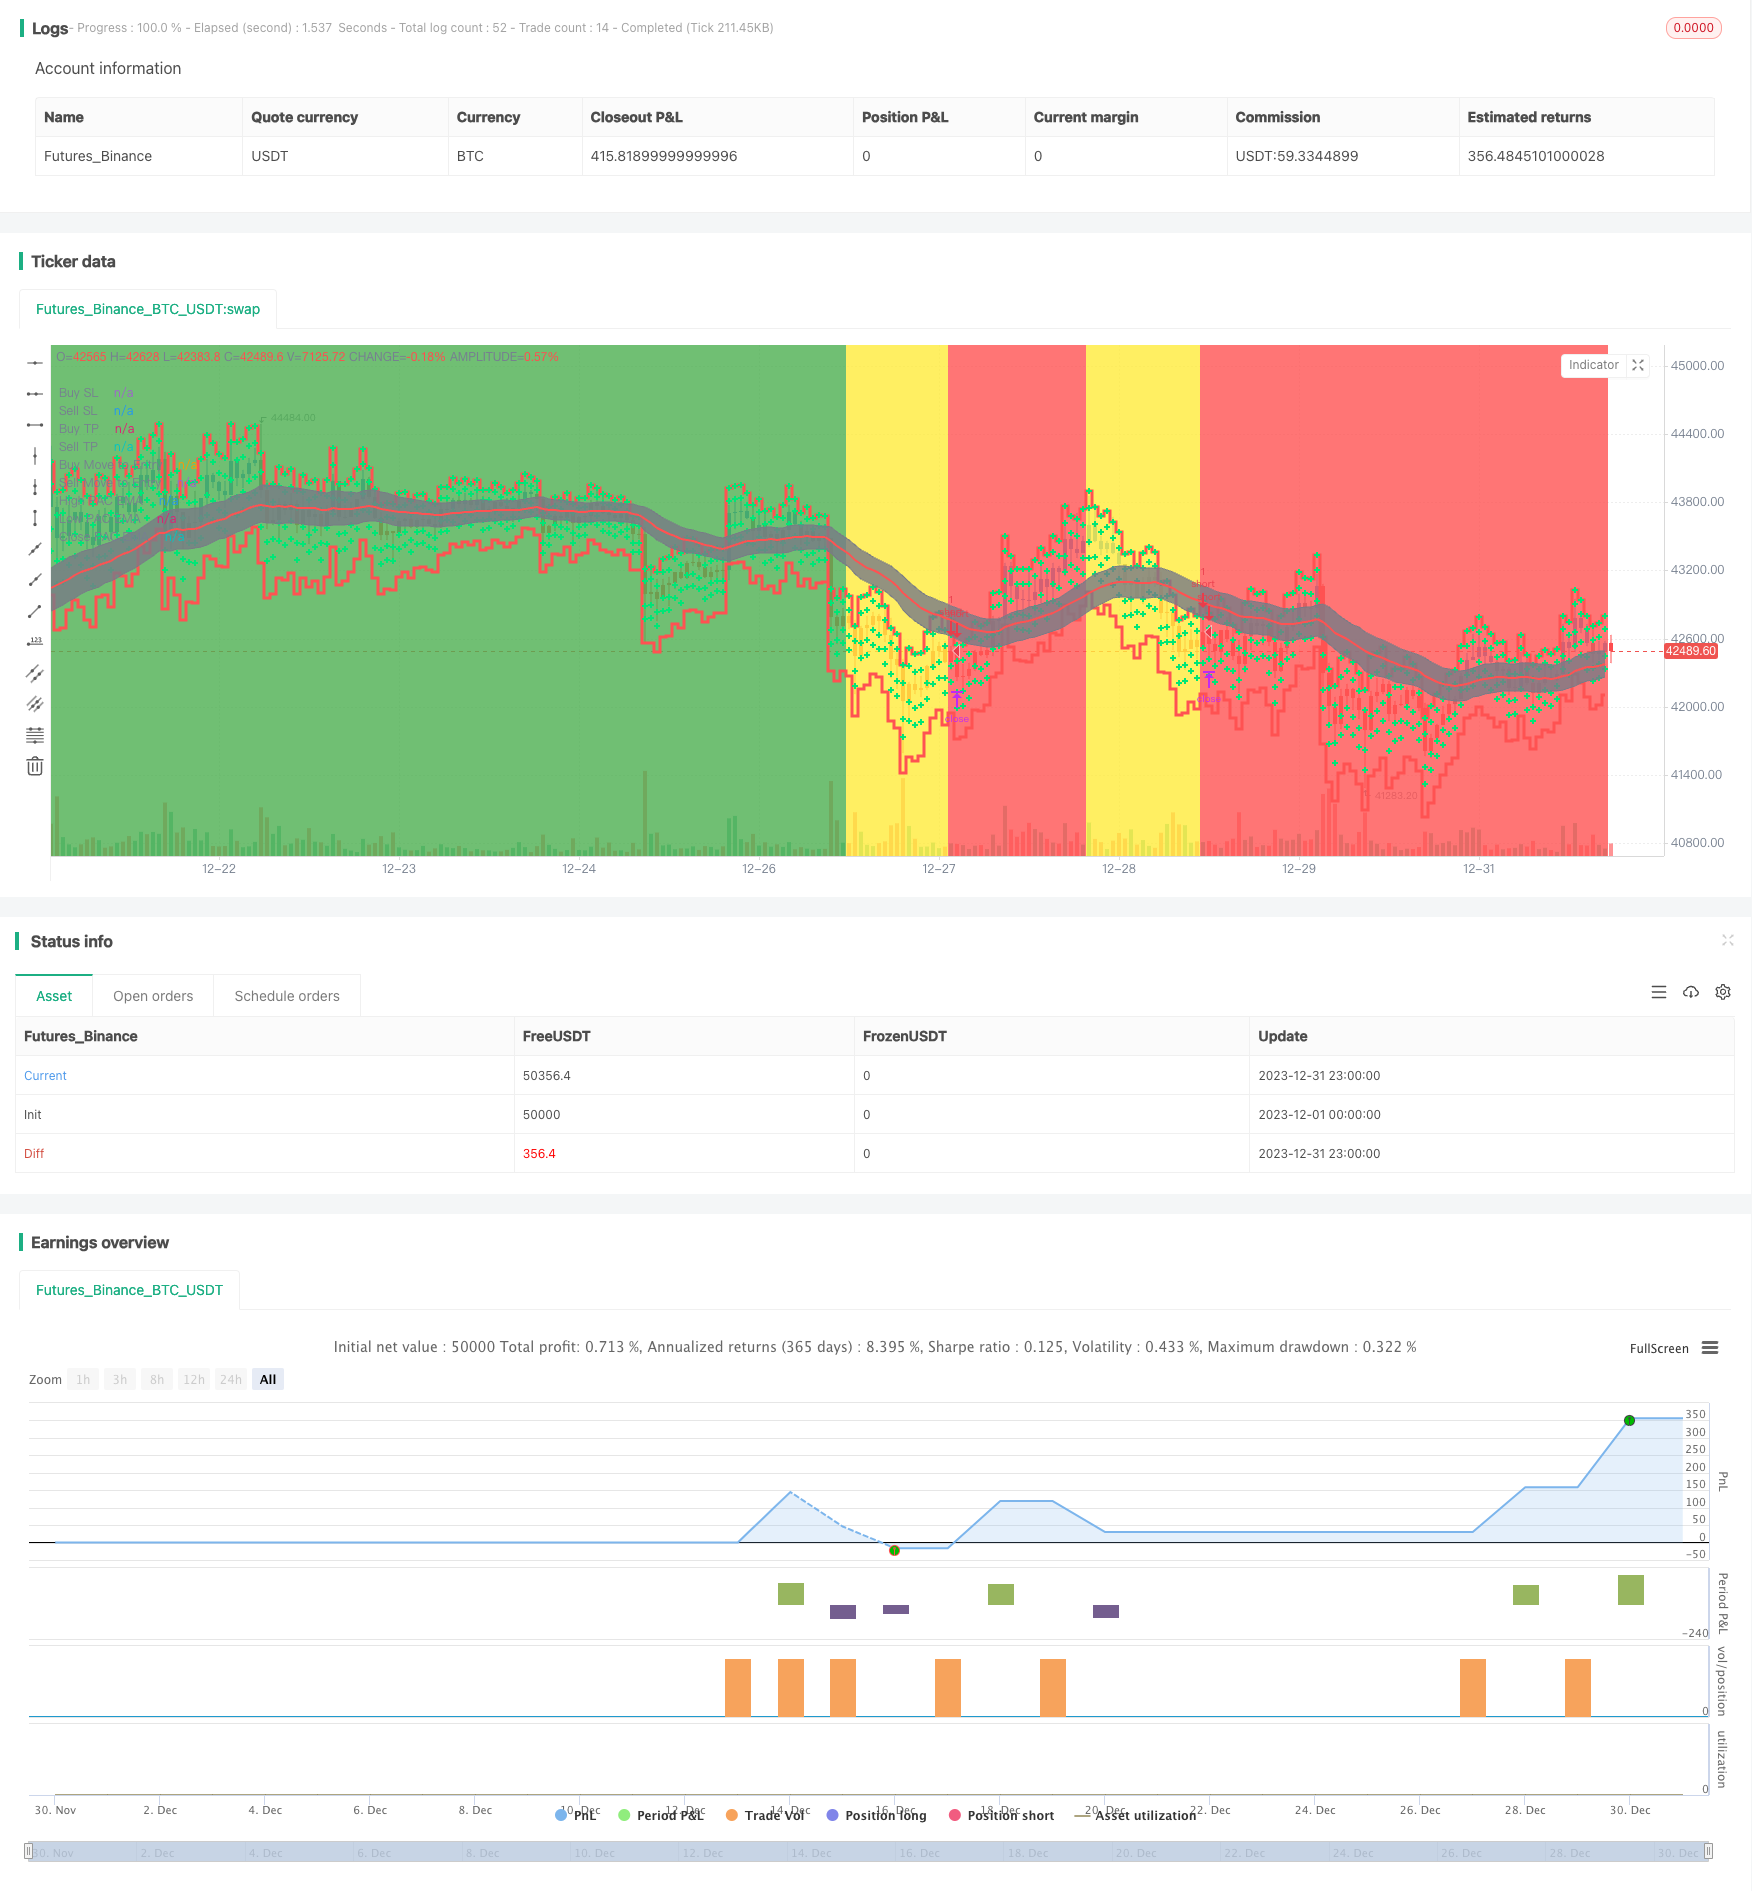
A estratégia é baseada na construção de um canal de preços em duas linhas, usando o alcance do canal para determinar a direção da tendência de preços e definindo um rastreamento de stop-loss para bloquear a tendência de rastreamento de lucros.
Princípio da estratégia
A estratégia de canal de preço de dupla linha média utiliza o canal de preço de construção de EMA rápido e EMA lento. O parâmetro de EMA rápido é de 89 ciclos e o parâmetro de EMA lento é de 200 ciclos. Ao mesmo tempo, utiliza o alcance do canal de preço de construção de três linhas médias baseadas no preço alto, baixo e fechado.
Quando o EMA rápido está acima do EMA lento e o preço está abaixo do downtrend, é considerado uma tendência ascendente; quando o EMA rápido está abaixo do EMA lento e o preço está acima do uptrend, é considerado uma tendência descendente.
Em uma tendência ascendente, a estratégia fará um curto-circuito para determinar a reversão da tendência; em uma tendência descendente, a estratégia fará mais para determinar a reversão da tendência.
Além disso, a estratégia possui um tracking de stop loss. Após a posse, o tracking de stop loss é atualizado em tempo real, permitindo o bloqueio de lucros.
Análise de vantagens
A maior vantagem da estratégia é a utilização de duas linhas de equilíbrio para a construção de canais de preços para determinar a tendência de preços, em combinação com a inversão de pedidos, para evitar a perseguição de alta e baixa. Ao mesmo tempo, com a função móvel de rastreamento de stop loss, pode bloquear os lucros e reduzir o risco de perda.
Outras vantagens: grande espaço para otimização de parâmetros, que podem ser ajustados para diferentes variedades e períodos de parâmetros; atualização em tempo real do preço de parada, com baixo risco de operação.
Análise de Riscos
O principal risco desta estratégia é que o efeito da determinação do sinal de reversão não é bom, podendo ocorrer um erro de julgamento. Nesse caso, é necessário otimizar os parâmetros para garantir a determinação do efeito da reversão de tendência.
Além disso, a configuração do ponto de parada também é fundamental. Um ponto de parada muito grande pode ocasionar um ponto de parada insuficiente; um ponto de parada muito pequeno pode ocasionar um ponto de parada excessivo. Isso precisa ser ajustado de acordo com a variedade específica.
Finalmente, problemas de dados também podem levar a falhas de estratégia. Assegure-se de usar estratégias de retrospecção e verificação em campo com dados históricos confiáveis, contínuos e suficientes.
Direção de otimização
A estratégia de otimização centra-se nas seguintes áreas:
Os ciclos de EMAs rápida e lenta podem ser otimizados, com diferentes combinações de parâmetros para julgar o efeito
Os parâmetros de ascensão e descensão do canal de preço também podem ser ajustados para encontrar um parâmetro de ciclo mais adequado
A configuração do ponto de parada é fundamental para testar diferentes parâmetros para otimizar a estratégia de parada
Testar a introdução de outros indicadores para determinar a inversão de tendência e melhorar a monotonia
Resumir
A estratégia opera de forma racional e suave, usando um canal de dupla linha para determinar a direção da tendência e bloquear o lucro com um stop loss móvel. É uma estratégia de acompanhamento de tendência mais estável.
/*backtest
start: 2023-12-01 00:00:00
end: 2023-12-31 23:59:59
period: 1h
basePeriod: 15m
exchanges: [{"eid":"Futures_Binance","currency":"BTC_USDT"}]
*/

//@version=4
strategy("Trend trader Strategy", overlay=true)

//f you want to trade shallower Pullbacks for quicker scalps, try reducing the
//    PAC and EMA combination lengths for example:
//      * 21 PAC and 55, 144, 377 for fast, medium, slow EMAs
//      * 13 PAC and 34, 89, 233 for fast, medium, slow EMAs
//  - Each alert should be evaluated on it's own merits, the alerts are designed to highlight possible
//    scalping trades from Pullback recoveries around the PAC.

fromDay = input(defval = 1, title = "From Day", minval = 1, maxval = 31)
fromMonth = input(defval = 6, title = "From Month", minval = 1, maxval = 12)
fromYear = input(defval = 2020, title = "From Year", minval = 1970)

// To Date Inputs
toDay = input(defval = 1, title = "To Day", minval = 1, maxval = 31)
toMonth = input(defval = 12, title = "To Month", minval = 1, maxval = 12)
toYear = input(defval = 2020, title = "To Year", minval = 1970)

isMon() => dayofweek(time('D')) == dayofweek.monday
isTue() => dayofweek(time('D')) == dayofweek.tuesday
isWed() => dayofweek(time('D')) == dayofweek.wednesday
isThu() => dayofweek(time('D')) == dayofweek.thursday
isFri() => dayofweek(time('D')) == dayofweek.friday

// Calculate start/end date and time condition
DST = 1 //day light saving for usa
//--- Europe
London = iff(DST==0,"0000-0900","0100-1000")
//--- America
NewYork = iff(DST==0,"0400-1400","0500-1500")
//--- Pacific
Sydney = iff(DST==0,"1300-2200","1400-2300")
//--- Asia
Tokyo = iff(DST==0,"1500-2400","1600-0100")

customTime =iff(DST==0,"2300-1500","2400-1600")
customTime2 =iff(DST==0,"0800-1500","0900-1600")

//-- Time In Range
timeinrange(res, sess) => time(res, sess) != 0

london = timeinrange(timeframe.period, London)
newyork = timeinrange(timeframe.period, NewYork)
c_time = timeinrange(timeframe.period,customTime)
c_time2 = timeinrange(timeframe.period,customTime2)

startDate = timestamp(fromYear, fromMonth, fromDay, 00, 00)
finishDate = timestamp(toYear, toMonth, toDay, 00, 00)
time_cond = time >= startDate and time <= finishDate and (london or newyork)


    // === INPUTS ===
HiLoLen         = input(34, minval=2, title="High Low PAC channel Length")
fastEMAlength   = input(89, minval=2)
mediumEMAlength = input(200, minval=2)
slowEMAlength   = input(600, minval=2)
ShowFastEMA     = input(false)
ShowMediumEMA   = input(false)
ShowSlowEMA     = input(false)
ShowHHLL        = input(false)
ShowFractals    = input(false)
filterBW        = input(false, title="Show Ideal Fractals Only")
ShowBarColor    = input(true, title="Show coloured Bars around PAC")
ShowBuySell     = input(false, title="Show Buy/Sell Alert Arrows")
Lookback        = input(3, minval=1, title="Pullback Lookback for PAC Cross Check")
DelayArrow      = input(false, title="Show Alert Arrows Only on Closed Candles")
Delay           = DelayArrow ? 1 : 0
ShowTrendBGcolor= input(true)
UseHAcandles    = input(false, title="Use Heikin Ashi Candles in Algo Calculations")
//
// === /INPUTS ===

// === BASE FUNCTIONS ===

haClose = UseHAcandles ? security(heikinashi(syminfo.tickerid), timeframe.period, close) : close
haOpen  = UseHAcandles ? security(heikinashi(syminfo.tickerid), timeframe.period, open) : open
haHigh  = UseHAcandles ? security(heikinashi(syminfo.tickerid), timeframe.period, high) : high
haLow   = UseHAcandles ? security(heikinashi(syminfo.tickerid), timeframe.period, low) : low


//  ||---   Fractal Recognition Functions:  ---------------------------------------------------------------||
isRegularFractal(mode) =>
    ret = mode == 1 ? high[4] < high[3] and high[3] < high[2] and high[2] > high[1] and
       high[1] > high[0] : mode == -1 ?
       low[4] > low[3] and low[3] > low[2] and low[2] < low[1] and low[1] < low[0] :
       false
    ret

isBWFractal(mode) =>
    ret = mode == 1 ? high[4] < high[2] and high[3] <= high[2] and high[2] >= high[1] and
       high[2] > high[0] : mode == -1 ?
       low[4] > low[2] and low[3] >= low[2] and low[2] <= low[1] and low[2] < low[0] :
       false
    ret
//  ||-----------------------------------------------------------------------------------------------------||

//
// === /BASE FUNCTIONS ===

// === SERIES SETUP ===
//

//  ||---   Setup Moving Averages and PAC channel:
//  ||-----------------------------------------------------------------------------------------------------||
fastEMA     = ema(haClose, fastEMAlength)
mediumEMA   = ema(haClose, mediumEMAlength)
slowEMA     = ema(haClose, slowEMAlength)
pacC        = ema(haClose, HiLoLen)
pacL        = ema(haLow, HiLoLen)
pacU        = ema(haHigh, HiLoLen)
TrendDirection = fastEMA > mediumEMA and pacL > mediumEMA ? 1 :
   fastEMA < mediumEMA and pacU < mediumEMA ? -1 : 0

//  ||---   Fractal Recognition:
//  ||-----------------------------------------------------------------------------------------------------||
filteredtopf = filterBW ? isRegularFractal(1) : isBWFractal(1)
filteredbotf = filterBW ? isRegularFractal(-1) : isBWFractal(-1)
//  ||-----------------------------------------------------------------------------------------------------||
//  ||---   Higher Highs, Lower Highs, Higher Lows, Lower Lows  -------------------------------------------||
valuewhen_H0 = valuewhen(filteredtopf == true, high[2], 0)
valuewhen_H1 = valuewhen(filteredtopf == true, high[2], 1)
valuewhen_H2 = valuewhen(filteredtopf == true, high[2], 2)
//
higherhigh = filteredtopf == false ? false :
   valuewhen_H1 < valuewhen_H0 and valuewhen_H2 < valuewhen_H0
lowerhigh = filteredtopf == false ? false :
   valuewhen_H1 > valuewhen_H0 and valuewhen_H2 > valuewhen_H0
valuewhen_L0 = valuewhen(filteredbotf == true, low[2], 0)
valuewhen_L1 = valuewhen(filteredbotf == true, low[2], 1)
valuewhen_L2 = valuewhen(filteredbotf == true, low[2], 2)
//
higherlow = filteredbotf == false ? false :
   valuewhen_L1 < valuewhen_L0 and valuewhen_L2 < valuewhen_L0
lowerlow = filteredbotf == false ? false :
   valuewhen_L1 > valuewhen_L0 and valuewhen_L2 > valuewhen_L0

//
// === /SERIES ===

//
// === PLOTTING ===
//
// Plot the Price Action Channel (PAC) base on EMA high,low and close
L = plot(pacL, color=color.gray, linewidth=1, title="High PAC EMA", transp=50)
U = plot(pacU, color=color.gray, linewidth=1, title="Low PAC EMA", transp=50)
C = plot(pacC, color=color.red, linewidth=2, title="Close PAC EMA", transp=0)
fill(L, U, color=color.gray, transp=90, title="Fill HiLo PAC")

// Colour bars according to the close position relative to the PAC selected.
BARcolor = haClose > pacU ? color.blue : haClose < pacL ? color.red : color.gray
barcolor(ShowBarColor ? BARcolor : na, title="Bar Colours")
//
BGcolor = TrendDirection == 1 ? color.green :
   TrendDirection == -1 ? color.red : color.yellow
bgcolor(ShowTrendBGcolor ? BGcolor : na, transp=90, title="Trend BG Color")


// STEP 1:
// Configure trail stop level with input options (optional)
longTrailPerc = input(title="Trail Long Loss (%)",
     type=input.float, minval=0.0, step=0.05, defval=0.1) * 0.01

shortTrailPerc = input(title="Trail Short Loss (%)",
     type=input.float, minval=0.0, step=0.05, defval=0.1) * 0.01


atrRange = input(14, title="ATR Range", type=input.integer)
buyStop = input(2, title="* ATR Buy SL", type=input.float)
sellStop = input(1, title="* ATR Sell SL", type=input.float)
targetATR = input(1, title="* ATR TP1", type=input.float)
moveToEntryFigure = input(0.5, title=" move to entry in % towards target", type=input.float)

showMove = input(true, title="Show Move to Entry points")

showMoveBuycol = showMove ? color.lime : na
showMoveSellcol = showMove ? color.lime : na

// Plots

buyStopp = plot(close - atr(atrRange) * buyStop, title="Buy SL", style=plot.style_stepline, color=color.red, transp=75, linewidth=3)
sellStopp = plot(close + atr(atrRange) * sellStop, title="Sell SL", style=plot.style_stepline, color=color.red, transp=75, linewidth=3)

buyTP1 = plot(close + atr(atrRange) * targetATR, title="Buy TP", style=plot.style_cross, color=color.lime, transp=75, linewidth=3)
sellTP1 = plot(close - atr(atrRange) * targetATR, title="Sell TP", style=plot.style_cross, color=color.lime, transp=75, linewidth=3)

buyMove = plot(close + atr(atrRange) * targetATR * moveToEntryFigure, title="Buy Move to Entry", style=plot.style_cross, color=showMoveBuycol, transp=75, linewidth=3)
sellMove = plot(close - atr(atrRange) * targetATR * moveToEntryFigure, title="Sell Move to Entry", style=plot.style_cross, color=showMoveSellcol, transp=75, linewidth=3)


if barstate.isconfirmed
    if(BGcolor==color.red and BGcolor[1]==color.yellow and c_time )
        strategy.entry("short", strategy.short, comment="short", alert_message='short')
        strategy.cancel("long")
    if(BGcolor==color.green and BGcolor[1]==color.yellow and c_time )
        strategy.entry("long", strategy.long, comment="long", alert_message = 'long')
        strategy.cancel("short")


// STEP 2:
// Determine trail stop loss prices
longStopPrice = 0.0, shortStopPrice = 0.0

longStopPrice := if (strategy.position_size > 0)
    stopValue = close * (1 - longTrailPerc)
    max(stopValue, longStopPrice[1])
else
    0

shortStopPrice := if (strategy.position_size < 0)
    stopValue = close * (1 + shortTrailPerc)
    min(stopValue, shortStopPrice[1])
else
    999999

// Plot stop loss values for confirmation
plot(series=(strategy.position_size > 0) ? longStopPrice : na,
     color=color.fuchsia, style=plot.style_cross,
     linewidth=2, title="Long Trail Stop")
plot(series=(strategy.position_size < 0) ? shortStopPrice : na,
     color=color.fuchsia, style=plot.style_cross,
     linewidth=2, title="Short Trail Stop")


// STEP 3:
// Submit exit orders for trail stop loss price
//if (strategy.position_size > 0)
//    strategy.exit("XL TRL STP","long", stop=longStopPrice)

//if (strategy.position_size < 0)
//    strategy.exit("XS TRL STP","short", stop=shortStopPrice)


tp=input(0.0032,type=input.float, title="tp")
sl=input(0.001,type=input.float, title="sl")

//strategy.close("long", when= tp/2,qty_percent = 50)

//strategy.exit("longtp/sl","long",profit=tp, loss=sl, stop=longStopPrice, alert_message='closelong')
//strategy.exit("shorttp/sl","short",profit=tp, loss=sl, stop=shortStopPrice, alert_message='closeshort')

//tpatrlong= close + atr(atrRange) * targetATR
//slatrlong= close - atr(atrRange) * buyStop

//strategy.exit("longtp/sl","long",profit=tp, loss=sl, alert_message='closelong')
//strategy.exit("shorttp/sl","short",profit=tp, loss=sl, alert_message='closeshort')

strategy.exit("closelong", "long" , profit = close * tp / syminfo.mintick, loss = close * sl / syminfo.mintick, alert_message = "closelong")
strategy.exit("closeshort", "short" , profit = close * tp / syminfo.mintick, loss = close * sl / syminfo.mintick, alert_message = "closeshort")

if(BGcolor==color.yellow or not c_time)
    strategy.close("short", comment="time or yellow", alert_message='closeshort')
    strategy.close("long", comment="time or yellow", alert_message='closelong')