Estratégia de momentum de avanço baseada na média móvel golden cross
Visão geral
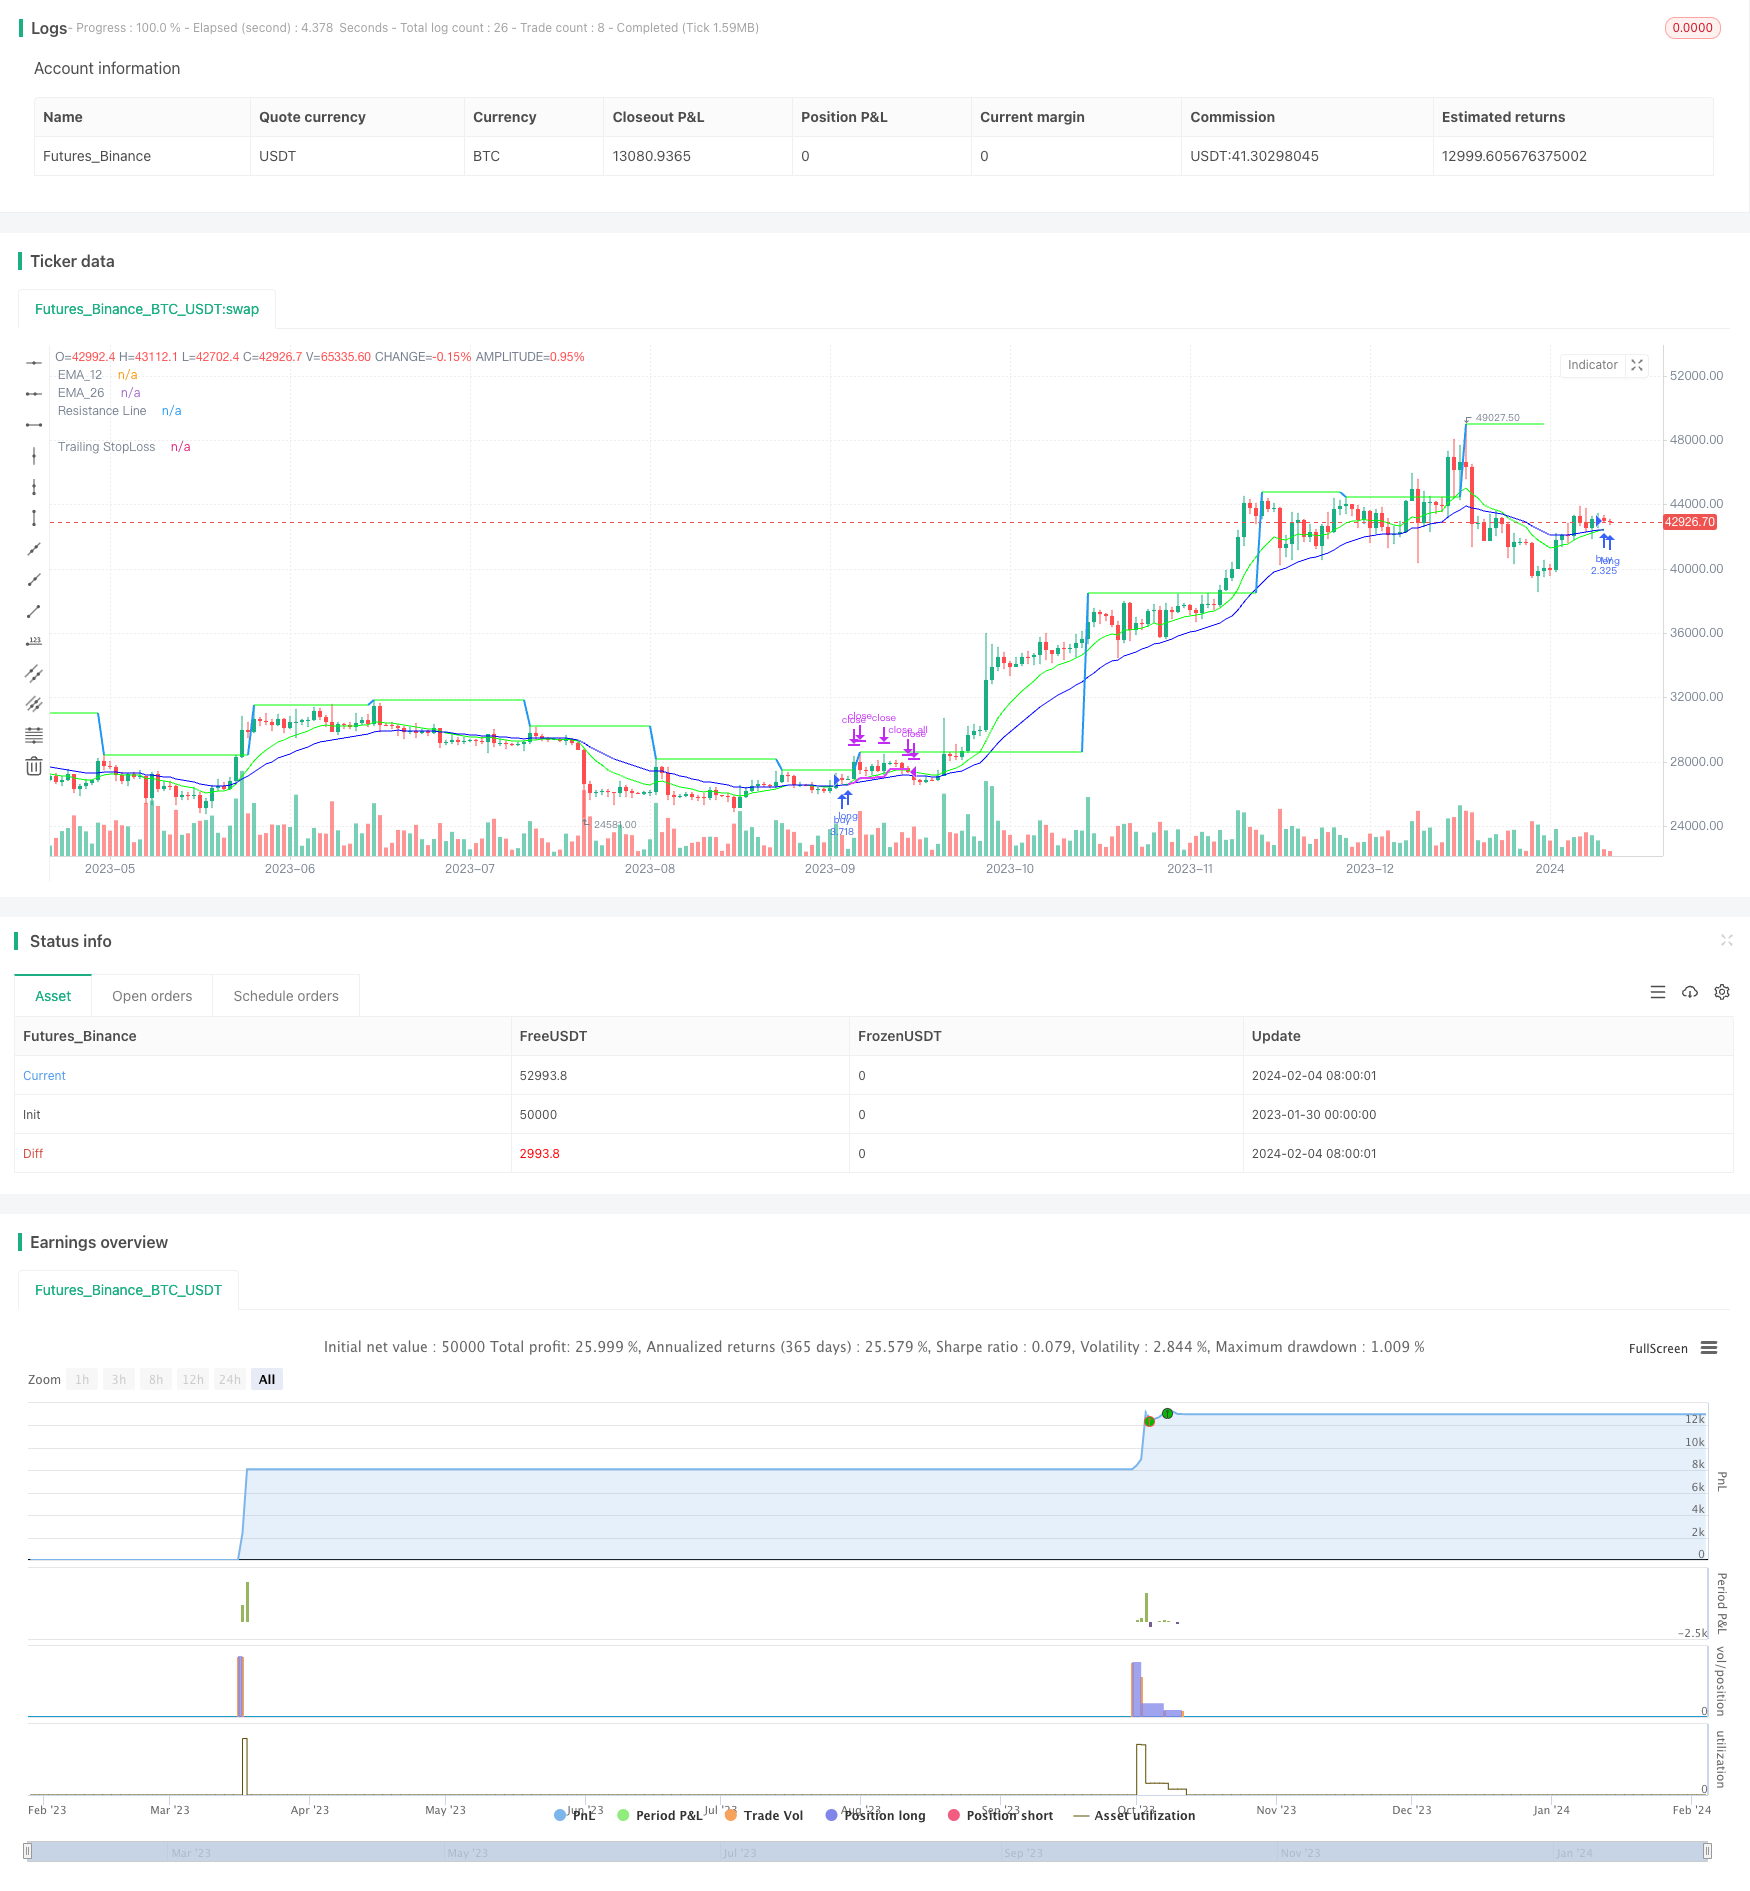
Esta estratégia baseia-se na média móvel do índice de 12 dias (EMA) e no EMA de 26 dias como sinal de entrada. Para filtrar brechas falsas, a estratégia também introduz o indicador MACD para determinar a tendência do mercado e o indicador RSI para determinar se está em uma área de sobrevenda.
Em termos de stop loss, a estratégia oferece três opções: stop tracking, stop linear e stop linear. Em termos de stop loss, a estratégia oferece dois objetivos de stop loss em sequência.
Princípio da estratégia
Sinais de entrada
- 12o EMA sobre 26o EMA em forquilha de ouro
- MACD positivo e linha MACD acima da linha de sinal
- O RSI está dentro do intervalo definido.
- Preço de fechamento acima da EMA de 21 e SMA de 7
Confirmação de entrada
- Avaliação opcional: Preço supera resistência dinâmica
Método de amortização
- Stop loss de seguimento: percentual de stop loss de seguimento de acordo com o preço de entrada e o limite de stop loss de seguimento
- Perda de linha média: preço de fechamento abaixo da parada de SMA de 7
- Forquilha média: 12 dias de EMA abaixo de 26 dias de EMA de parada
Método de suspensão
- Defina dois objetivos de parada em seqüência, vendendo uma parte da quantidade quando o primeiro ponto de parada é acionado, e vendendo a quantidade total quando o segundo ponto de parada é acionado
Vantagens estratégicas
- Filtração de sinais de erro com um sistema linear para melhorar a precisão de entrada
- Opções de Stop Loss para diferentes tipos de traders
- Perda de seguimento dinâmico para controle de risco
- O objetivo é que os jogadores se mobilizem em grupos e bloqueiem parte dos lucros.
Risco estratégico
- Os EMAs produzem mais falsos sinais quando os mercados estão em turbulência
- Tracking Stop Loss pode ser atingido após a invasão
- A parada de perda de forquilha de linha média não pode ser interrompida quando a tendência se inverte
Medidas de resposta:
- Indicadores MACD combinados para avaliar a tendência real do mercado
- Ajustar a amplitude do tracking stop loss
- Opção de paralisação alternativa ou paralisação combinada
Direção de otimização da estratégia
- Otimização dos parâmetros do EMA para determinar a melhor combinação de parâmetros
- Testar diferentes métodos e parâmetros de suspensão para encontrar o melhor plano de suspensão
- Teste diferentes parâmetros de suspensão para otimizar a suspensão
- Combinado com outros indicadores, o tempo de admissão
- Ajuste para variedades e períodos
Resumir
Esta estratégia usa o sistema de linha uniforme como principal sinal de negociação, auxiliando o filtro de entrada com indicadores como MACD, RSI e outros. O método de parada e o objetivo de parada foram optimizados e podem ser ajustados para combinar diferentes tipos de investidores por meio de parâmetros. O espaço de otimização da estratégia é grande e pode ser testado e melhorado em várias dimensões, como o sinal de entrada, o método de parada e o objetivo de parada, para melhorar o efeito da estratégia.
/*backtest
start: 2023-01-30 00:00:00
end: 2024-02-05 00:00:00
period: 1d
basePeriod: 1h
exchanges: [{"eid":"Futures_Binance","currency":"BTC_USDT"}]
*/

// This source code is subject to the terms of the Mozilla Public License 2.0 at https://mozilla.org/MPL/2.0/
// © AbdulRahimShama
//@version=5


strategy('12/26-IT strategy', overlay=true,initial_capital = 100000)


Show_Only_12_26_Crossover_Entry = input.bool(true, group = "Entry_Exit Criteria")
Show_12_26_Crossover_and_resistance_Entry = input.bool(false, group = "Entry_Exit Criteria")


Show_TSL_StopLoss = input.bool(true, group = "Entry_Exit Criteria")
Show_Crossdown_StopLoss = input.bool(true, group = "Entry_Exit Criteria")
Show_SMA7_StopLoss = input.bool(false, group = "Entry_Exit Criteria")


////////////////////////////////////////////////
////////////////TARGETS INPUT
////////////////////////////////////////////////

////////Target1

TargetPerc1 = input.float(title="Target (%)", minval=0,defval=5, group="Target-1") / 100
TargetPrice1 = strategy.position_avg_price * (1 + TargetPerc1)
Target1_exit_qty = input.int(50, group="Target-1",tooltip = "% qty to sell when Target1 is reached")


////////Target2

TargetPerc2 = input.float(title="Target (%)", minval=0,defval=10, group="Target-2") / 100
TargetPrice2 = strategy.position_avg_price * (1 + TargetPerc2)
Target2_exit_qty = input.int(100, group="Target-2",tooltip = "% qty to sell when Target2 is reached")


////////////////////////////////////////////////
////////////////TRAILING STOP LOSS
////////////////////////////////////////////////


TSLsource = input(low, title="TSL Source", group="Trailing StopLoss")

longTrailPerc = input.float(title='Trail Long Loss (%)', minval=0.0, step=0.1, defval=1, group="Trailing StopLoss") * 0.01

TrailStopPrice = 0.0

TrailStopPrice := if strategy.position_size > 0
    sPIVOT_highValue = TSLsource * (1 - longTrailPerc)
    math.max(sPIVOT_highValue, TrailStopPrice[1])
else
    0

TSL = close < TrailStopPrice
plot(series=strategy.position_size > 0 and Show_TSL_StopLoss ? TrailStopPrice : na, color=color.new(color.fuchsia, 0), style=plot.style_linebr, linewidth=2, title='Trailing StopLoss')


////////////////////////////////////////////////
////////////////Moving Averages
////////////////////////////////////////////////


EMA_12=ta.ema(close, 12)
EMA_26=ta.ema(close, 26)
EMA_21=ta.ema(close,21)

plot(EMA_12, title="EMA_12", color=color.rgb(0, 255, 0), offset=0, linewidth=1)
plot(EMA_26, title="EMA_26", color=color.rgb(0, 0, 255), offset=0, linewidth=1)
plot(Show_SMA7_StopLoss ? ta.sma(close,7) : na, title="SMA_7", color=color.rgb(255, 0, 0), offset=0, linewidth=1)


////////////////////////////////////////////////
////////////////RESISTANCE INPUT and PLOTTING
////////////////////////////////////////////////

CrossOverLookbackCandles = input.int(10, group= "RESISTANCE")

resistanceSRC = input(high, group= "RESISTANCE")
resistanceLEFT = input(10, group= "RESISTANCE")
resistanceRIGHT = input(10, group= "RESISTANCE")

hih = ta.pivothigh(resistanceSRC, resistanceLEFT, resistanceRIGHT)
top = ta.valuewhen(hih, resistanceSRC[resistanceRIGHT], 0)

res = plot(top, color=top != top[1] ? na : color.new(#00ff00, 50), offset=-resistanceLEFT, linewidth=2, title="Resistance Line")

EMA_12_Low = ta.lowest(EMA_12, CrossOverLookbackCandles)
EMA_26_Low = ta.lowest(EMA_26, CrossOverLookbackCandles)


////////////////////////////////////////////////
////////////////RSI INPUT and PLOTTING
////////////////////////////////////////////////
RSI = ta.rsi(close, 14)
RSILowerRange = input.int(50, tooltip = "RSI value should be ABOVE this value for entry", group = "RSI")
RSIUpperRange = input.int(70, tooltip = "RSI value should be BELOW this value for entry", group = "RSI")


////////////////////////////////////////////////
////////////////MACD
////////////////////////////////////////////////
fast_length = 12
slow_length = 26
MACD_src = close
signal_length = 9

fast_ma = ta.ema(MACD_src, fast_length)
slow_ma = ta.ema(MACD_src, slow_length)
macd = fast_ma - slow_ma
signal = ta.ema(macd, signal_length)
hist = macd - signal


////////////////////////////////////////////////
////////////////ENTRY CRITERIA
////////////////////////////////////////////////


BUYVALUE= input(100000, tooltip = "Buy qty displayed on chart will be based on this value")

BASEENTRY = macd > signal and RSI > RSILowerRange and RSI < RSIUpperRange and close > EMA_21 and close > ta.sma(close, 7)


Entry= ta.crossover(EMA_12, EMA_26) and BASEENTRY
Entry2 = ta.crossover(close, top) and EMA_12_Low < EMA_26_Low and EMA_12 > EMA_26 and RSI < 70

////////////////////////////////////////////////
////////////////BUY SELL STRATEGY
////////////////////////////////////////////////

if ((Entry and Show_Only_12_26_Crossover_Entry))
    strategy.entry("buy", strategy.long, qty=BUYVALUE/close)

if (Entry2 and Show_12_26_Crossover_and_resistance_Entry)
    strategy.entry("buy", strategy.long, qty=BUYVALUE/close)

strategy.exit("Tg1", "buy", limit=TargetPrice1, qty_percent = Target1_exit_qty)
strategy.exit("Tg2", "buy", limit=TargetPrice2, qty_percent = Target2_exit_qty)


if TSL and Show_TSL_StopLoss and close < EMA_12
    strategy.close_all ("sl")

if ta.crossunder(EMA_12, EMA_26) and Show_Crossdown_StopLoss
    strategy.close_all ("sl")

if ta.crossunder(close, ta.sma(close, 7)) and Show_SMA7_StopLoss
    strategy.close_all ("sl")