Стратегия, основанная на kNN

Автор:Чао Чжан, Дата: 2023-12-08 11:33:31
Тэги:

img

Обзор

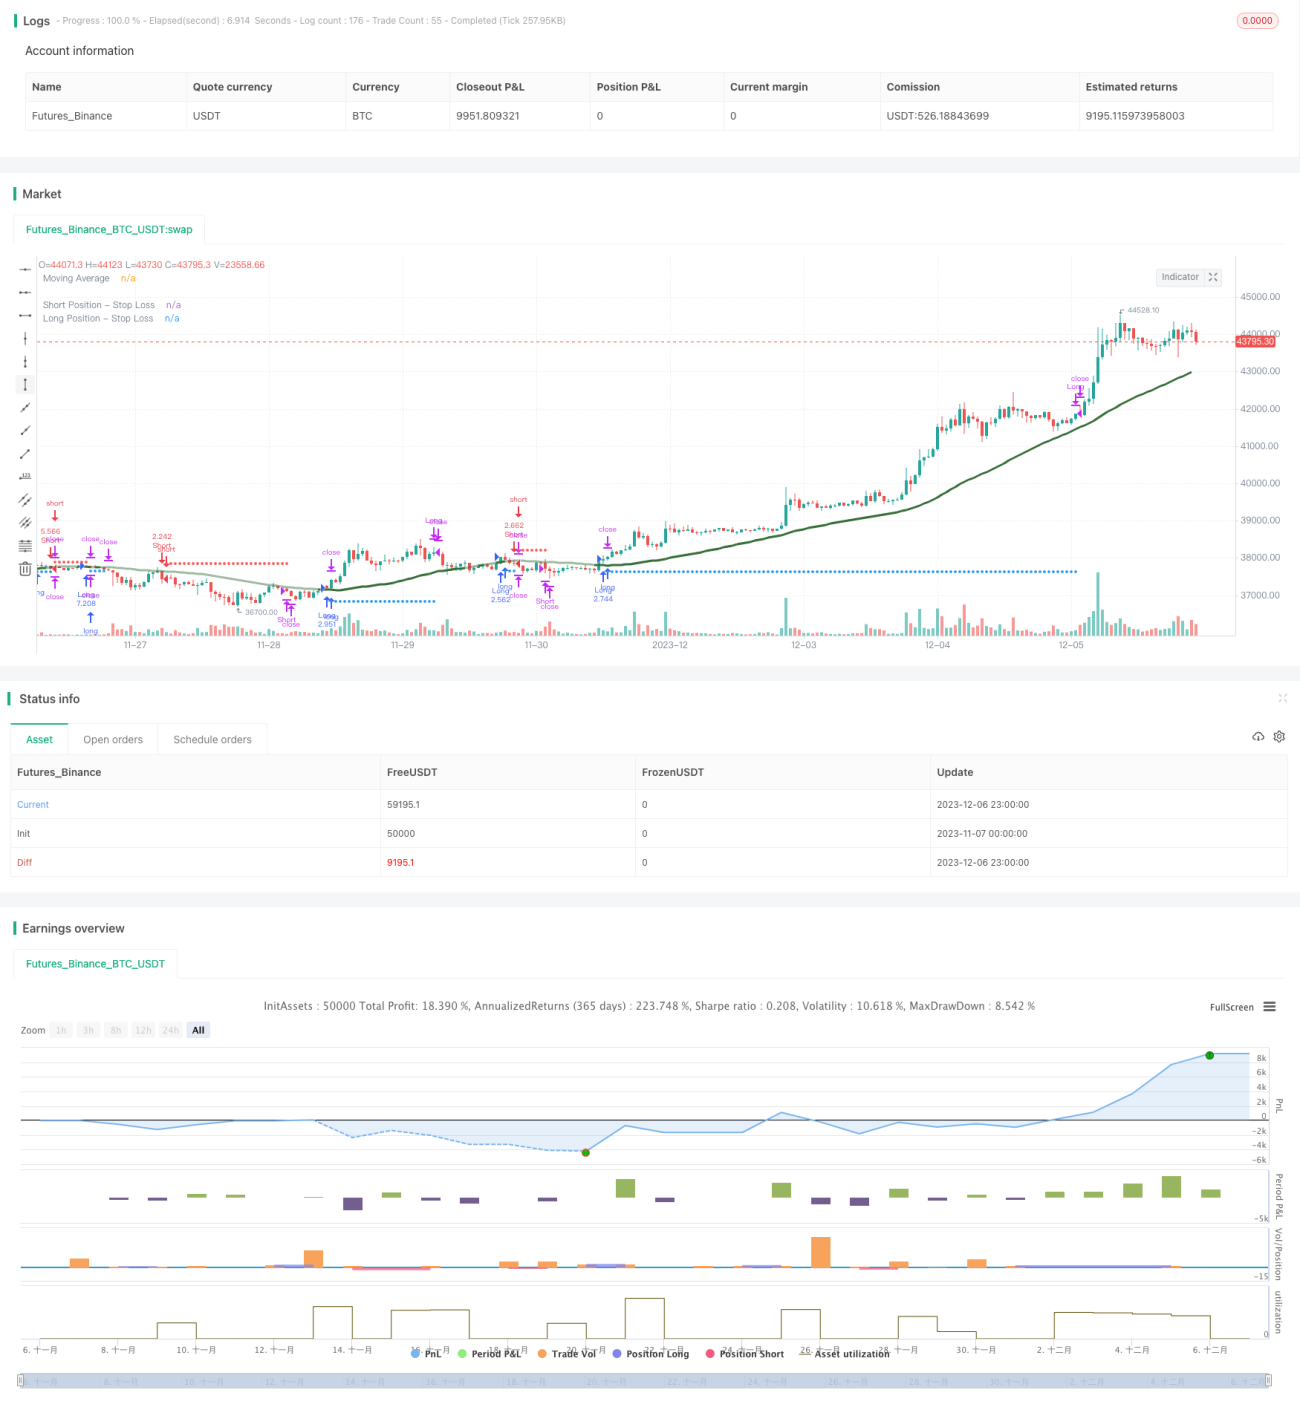
Эта стратегия использует алгоритм машинного обучения kNN (k Ближайшие соседи), чтобы предсказать тенденции рынка и генерировать долгие и короткие сигналы соответственно.

Принцип стратегии

  1. Собирать данные о обучении: собирать исторические данные, такие как цены закрытия, объемы торговли, а также технические показатели, такие как RSI, CCI с течением времени.

  2. Предварительная обработка данных: нормализация показателей в диапазоне 0-100.

  3. Подготовка к модели kNN: возьмите текущие две характеристики в модели kNN, вычислите евклидовые расстояния между этими векторами характеристик и историческими, выберите k самых близких соседей на основе расстояний и подсчитайте распределение этих k образцов.

  4. Получить прогнозы: сделать прогнозы на текущей тенденции рынка на основе ярлыков k ближайших соседей. Если прогноз является бычьим, генерировать длинный сигнал. Если прогноз является медвежьим, генерировать короткий сигнал.

  5. Торговля с использованием стоп-лосса, размещения позиций, фильтров скользящей средней.

Преимущества

  1. Автоматическое распознавание технических закономерностей с помощью машинного обучения без ручного вмешательства.

  2. Гибкость выбора различных технических показателей в качестве характеристик модели для оптимизации в реальном времени.

  3. Интегрирует строгие механизмы управления рисками, такие как стоп-лосс, размещение позиций.

  4. Визуализация линий остановки для ясности и интуиции.

Риски и решения

  1. В машинном обучении могут существовать ошибки прогнозирования. Методы оптимизации включают корректировку k-значения, векторов характеристик, временного диапазона выборки.

  2. Добавить разрешение на двустороннюю торговлю в коде для устранения ошибок.

  3. Неправильные настройки параметров могут привести к переоценке.

Руководство по оптимизации

  1. Испытать различные типы технических показателей в качестве входных характеристик kNN.

  2. Попробуйте другие показатели расстояния, например, расстояние до Манхэттена.

  3. Для корректировки размеров позиций используют расстояния выборки или качество классификации.

  4. Добавить модель поезда/испытательный раздел для оптимизации проката.

Заключение

Эта стратегия реализует прогноз рыночных тенденций с использованием классического алгоритма kNN и выполняет тренд после торговли на основе предсказательных сигналов. Она имеет регулируемые параметры и контролируемые риски, обеспечивая эффективные автоматизированные торговые решения для пользователей. Пользователи могут постоянно улучшать производительность стратегии путем оптимизации комбинаций технических индикаторов, гиперпараметров моделей и многого другого.


/*backtest
start: 2023-11-07 00:00:00
end: 2023-12-07 00:00:00
period: 1h
basePeriod: 15m
exchanges: [{"eid":"Futures_Binance","currency":"BTC_USDT"}]
*/

// This source code is subject to the terms of the Mozilla Public License 2.0 at https://mozilla.org/MPL/2.0/
// © sosacur01

//@version=5
strategy(title=" kNN-based| Trend Following  | Trend Following", overlay=true, pyramiding=1, commission_type=strategy.commission.percent, commission_value=0.2, initial_capital=10000)

//==========================================
// This script, based on Capissimo's original indicator code, transforms a kNN-based machine learning indicator into a TradingView strategy.
// It incorporates a backtest date range filter, on/off controls for long and short positions, a moving average filter, and dynamic risk management for adaptive position sizing.
// Credit to Capissimo for the foundational kNN algorithm.
//==========================================

//BACKTEST RANGE
useDateFilter = input.bool(true, title="Filter Date Range of Backtest",
     group="Backtest Time Period")
backtestStartDate = input(timestamp("1 jan 2017"), 
     title="Start Date", group="Backtest Time Period",
     tooltip="This start date is in the time zone of the exchange " + 
     "where the chart's instrument trades. It doesn't use the time " + 
     "zone of the chart or of your computer.")
backtestEndDate = input(timestamp("1 Jul 2100"),
     title="End Date", group="Backtest Time Period",
     tooltip="This end date is in the time zone of the exchange " + 
     "where the chart's instrument trades. It doesn't use the time " + 
     "zone of the chart or of your computer.")
inTradeWindow = true
if not inTradeWindow and inTradeWindow[1]
    strategy.cancel_all()
    strategy.close_all(comment="Date Range Exit")

//--------------------------------------

//LONG/SHORT POSITION ON/OFF INPUT
LongPositions   = input.bool(title='On/Off Long Postion', defval=true, group="Long & Short Position")
ShortPositions  = input.bool(title='On/Off Short Postion', defval=true, group="Long & Short Position")

//--------------------------------------
// kNN-based Strategy (FX and Crypto)
// Description: 
// This strategy uses a classic machine learning algorithm - k Nearest Neighbours (kNN) - 
// to let you find a prediction for the next (tomorrow's, next month's, etc.) market move. 
// Being an unsupervised machine learning algorithm, kNN is one of the most simple learning algorithms. 

// To do a prediction of the next market move, the kNN algorithm uses the historic data, 
// collected in 3 arrays - feature1, feature2 and directions, - and finds the k-nearest 
// neighbours of the current indicator(s) values. 

// The two dimensional kNN algorithm just has a look on what has happened in the past when 
// the two indicators had a similar level. It then looks at the k nearest neighbours, 
// sees their state and thus classifies the current point.

// The kNN algorithm offers a framework to test all kinds of indicators easily to see if they 
// have got any *predictive value*. One can easily add cog, wpr and others.
// Note: TradingViews's playback feature helps to see this strategy in action.
// Warning: Signals ARE repainting.

// Style tags: Trend Following, Trend Analysis
// Asset class: Equities, Futures, ETFs, Currencies and Commodities
// Dataset: FX Minutes/Hours+++/Days

//-- Preset Dates

int startdate = timestamp('01 Jan 2000 00:00:00 GMT+10')
int stopdate  = timestamp('31 Dec 2025 23:45:00 GMT+10')

//-- Inputs

StartDate  = input  (startdate, 'Start Date', group="kNN-based Inputs")
StopDate   = input  (stopdate,  'Stop Date', group="kNN-based Inputs")
Indicator  = input.string('RSI',     'Indicator',   ['RSI','ROC','CCI','Volume','All'], group="kNN-based Inputs")
ShortWinow = input.int   (8,        'Short Period [1..n]', 1, group="kNN-based Inputs")
LongWindow = input.int   (29,        'Long Period [2..n]',  2, group="kNN-based Inputs")
BaseK      = input.int   (400,       'Base No. of Neighbours (K) [5..n]', 5, group="kNN-based Inputs")
Filter     = input.bool  (false,     'Volatility Filter', group="kNN-based Inputs")
Bars       = input.int   (300,       'Bar Threshold [2..5000]', 2, 5000, group="kNN-based Inputs")

//-- Constants

var int BUY   = 1
var int SELL  =-1
var int CLEAR = 0

var int k     = math.floor(math.sqrt(BaseK))  // k Value for kNN algo

//-- Variable

// Training data, normalized to the range of [0,...,100]
var array<float> feature1   = array.new_float(0)  // [0,...,100]
var array<float> feature2   = array.new_float(0)  //    ...
var array<int>   directions = array.new_int(0)    // [-1; +1]

// Result data
var array<int>   predictions = array.new_int(0)
var float        prediction  = 0.0
var array<int>   bars        = array.new<int>(1, 0) // array used as a container for inter-bar variables

// Signals
var int          signal      = CLEAR

//-- Functions

minimax(float x, int p, float min, float max) => 
    float hi = ta.highest(x, p), float lo = ta.lowest(x, p)
    (max - min) * (x - lo)/(hi - lo) + min

cAqua(int g) => g>9?#0080FFff:g>8?#0080FFe5:g>7?#0080FFcc:g>6?#0080FFb2:g>5?#0080FF99:g>4?#0080FF7f:g>3?#0080FF66:g>2?#0080FF4c:g>1?#0080FF33:#00C0FF19
cPink(int g) => g>9?#FF0080ff:g>8?#FF0080e5:g>7?#FF0080cc:g>6?#FF0080b2:g>5?#FF008099:g>4?#FF00807f:g>3?#FF008066:g>2?#FF00804c:g>1?#FF008033:#FF008019

inside_window(float start, float stop) =>  
    time >= start and time <= stop ? true : false

//-- Logic

bool window = true

// 3 pairs of predictor indicators, long and short each
float rs = ta.rsi(close,   LongWindow),        float rf = ta.rsi(close,   ShortWinow)
float cs = ta.cci(close,   LongWindow),        float cf = ta.cci(close,   ShortWinow)
float os = ta.roc(close,   LongWindow),        float of = ta.roc(close,   ShortWinow)
float vs = minimax(volume, LongWindow, 0, 99), float vf = minimax(volume, ShortWinow, 0, 99)

// TOADD or TOTRYOUT:
//    ta.cmo(close, LongWindow), ta.cmo(close, ShortWinow)
//    ta.mfi(close, LongWindow), ta.mfi(close, ShortWinow)
//    ta.mom(close, LongWindow), ta.mom(close, ShortWinow)

float f1 = switch Indicator
    'RSI'    => rs 
    'CCI'    => cs 
    'ROC'    => os 
    'Volume' => vs 
    => math.avg(rs, cs, os, vs)

float f2 = switch Indicator
    'RSI'    => rf 
    'CCI'    => cf
    'ROC'    => of
    'Volume' => vf 
    => math.avg(rf, cf, of, vf)

// Classification data, what happens on the next bar
int class_label = int(math.sign(close[1] - close[0])) // eq. close[1]<close[0] ? SELL: close[1]>close[0] ? BUY : CLEAR

// Use particular training period
if window
    // Store everything in arrays. Features represent a square 100 x 100 matrix,
    // whose row-colum intersections represent class labels, showing historic directions
    array.push(feature1, f1)
    array.push(feature2, f2)
    array.push(directions, class_label)

// Ucomment the followng statement (if barstate.islast) and tab everything below
// between BOBlock and EOBlock marks to see just the recent several signals gradually 
// showing up, rather than all the preceding signals

//if barstate.islast   

//==BOBlock	

// Core logic of the algorithm
int   size    = array.size(directions)
float maxdist = -999.0
// Loop through the training arrays, getting distances and corresponding directions.
for i=0 to size-1
    // Calculate the euclidean distance of current point to all historic points,
    // here the metric used might as well be a manhattan distance or any other.
    float d = math.sqrt(math.pow(f1 - array.get(feature1, i), 2) + math.pow(f2 - array.get(feature2, i), 2))
    
    if d > maxdist
        maxdist := d
        if array.size(predictions) >= k
            array.shift(predictions)
        array.push(predictions, array.get(directions, i))
        
//==EOBlock	

// Note: in this setup there's no need for distances array (i.e. array.push(distances, d)),
//       but the drawback is that a sudden max value may shadow all the subsequent values.
// One of the ways to bypass this is to:
// 1) store d in distances array,
// 2) calculate newdirs = bubbleSort(distances, directions), and then 
// 3) take a slice with array.slice(newdirs) from the end
    	
// Get the overall prediction of k nearest neighbours
prediction := array.sum(predictions)   

bool filter = Filter ? ta.atr(10) > ta.atr(40) : true // filter out by volatility or ex. ta.atr(1) > ta.atr(10)...

// Now that we got a prediction for the next market move, we need to make use of this prediction and 
// trade it. The returns then will show if everything works as predicted.
// Over here is a simple long/short interpretation of the prediction, 
// but of course one could also use the quality of the prediction (+5 or +1) in some sort of way,
// ex. for position sizing.

bool long  = prediction > 0 and filter
bool short = prediction < 0 and filter
bool clear = not(long and short)

if array.get(bars, 0)==Bars    // stop by trade duration
    signal := CLEAR
    array.set(bars, 0, 0)
else
    array.set(bars, 0, array.get(bars, 0) + 1)

signal := long ? BUY : short ? SELL : clear ? CLEAR : nz(signal[1])

int  changed         = ta.change(signal)
bool startLongTrade  = changed and signal==BUY 
bool startShortTrade = changed and signal==SELL 
// bool endLongTrade    = changed and signal==SELL
// bool endShortTrade   = changed and signal==BUY  
bool clear_condition = changed and signal==CLEAR //or (changed and signal==SELL) or (changed and signal==BUY)

float maxpos = ta.highest(high, 10)
float minpos = ta.lowest (low,  10)


//----//MA INPUTS
MAFilter        = input.bool(title='Use MA as Filter', defval=true, group = "MA Inputs")
averageType1    = input.string(defval="SMA", group="MA Inputs", title="MA Type", options=["SMA", "EMA", "WMA", "HMA", "RMA", "SWMA", "ALMA", "VWMA", "VWAP"])
averageLength1  = input.int(defval=40, title="MA Length", group="MA Inputs")
averageSource1  = input(close, title="MA Source", group="MA Inputs")        

//MA TYPE
MovAvgType1(averageType1, averageSource1, averageLength1) =>
	switch str.upper(averageType1)
        "SMA"  => ta.sma(averageSource1, averageLength1)
        "EMA"  => ta.ema(averageSource1, averageLength1)
        "WMA"  => ta.wma(averageSource1, averageLength1)
        "HMA"  => ta.hma(averageSource1, averageLength1)
        "RMA"  => ta.rma(averageSource1, averageLength1)
        "SWMA" => ta.swma(averageSource1)
        "ALMA" => ta.alma(averageSource1, averageLength1, 0.85, 6)
        "VWMA" => ta.vwma(averageSource1, averageLength1)
        "VWAP" => ta.vwap(averageSource1)
        => runtime.error("Moving average type '" + averageType1 + 
             "' not found!"), na


// MA COLOR VALUES
ma = MovAvgType1(averageType1, averageSource1, averageLength1)
ma_plot = close > ma ? color.rgb(54, 111, 56) : color.rgb(54, 111, 56, 52)

// MA BUY/SELL CONDITIONS
bullish_ma = MAFilter ? close > ma  : inTradeWindow
bearish_ma = MAFilter ? close < ma  : inTradeWindow

// MA ALTERNATING PLOT
plot(MAFilter ? ma : na, color=ma_plot, title="Moving Average", linewidth=3)
//--------------------------------------

//ENTRIES AND EXITS
long_entry  = if inTradeWindow and startLongTrade and bullish_ma and LongPositions
    true
long_exit   = if inTradeWindow and startShortTrade
    true

short_entry = if inTradeWindow and startShortTrade and bearish_ma and ShortPositions
    true
short_exit  = if inTradeWindow and startLongTrade
    true
    
//--------------------------------------
//RISK MANAGEMENT - SL, MONEY AT RISK, POSITION SIZING
atrPeriod                = input.int(7, "ATR Length", group="Risk Management Inputs")
sl_atr_multiplier        = input.float(title="Long Position - Stop Loss - ATR Multiplier", defval=2, group="Risk Management Inputs", step=0.5)
sl_atr_multiplier_short  = input.float(title="Short Position - Stop Loss - ATR Multiplier", defval=2, group="Risk Management Inputs", step=0.5)
i_pctStop                = input.float(2, title="% of Equity at Risk", step=.5, group="Risk Management Inputs")/100

//ATR VALUE
_atr = ta.atr(atrPeriod)

//CALCULATE LAST ENTRY PRICE
lastEntryPrice = strategy.opentrades.entry_price(strategy.opentrades - 1)

//STOP LOSS - LONG POSITIONS 
var float sl = na

//CALCULTE SL WITH ATR AT ENTRY PRICE - LONG POSITION
if (strategy.position_size[1] != strategy.position_size)
    sl := lastEntryPrice - (_atr * sl_atr_multiplier)

//IN TRADE - LONG POSITIONS
inTrade = strategy.position_size > 0

//PLOT SL - LONG POSITIONS
plot(inTrade ? sl : na, color=color.blue, style=plot.style_circles, title="Long Position - Stop Loss")

//CALCULATE ORDER SIZE - LONG POSITIONS
positionSize = (strategy.equity * i_pctStop) / (_atr * sl_atr_multiplier)

//============================================================================================

//STOP LOSS - SHORT POSITIONS 
var float sl_short = na

//CALCULTE SL WITH ATR AT ENTRY PRICE - SHORT POSITIONS 
if (strategy.position_size[1] != strategy.position_size)
    sl_short := lastEntryPrice + (_atr * sl_atr_multiplier_short)

//IN TRADE SHORT POSITIONS
inTrade_short = strategy.position_size < 0

//PLOT SL - SHORT POSITIONS
plot(inTrade_short ? sl_short : na, color=color.red, style=plot.style_circles, title="Short Position - Stop Loss")

//CALCULATE ORDER - SHORT POSITIONS
positionSize_short = (strategy.equity * i_pctStop) / (_atr * sl_atr_multiplier_short) 


//===============================================

//LONG STRATEGY
strategy.entry("Long", strategy.long, comment="Long", when = long_entry and not short_entry, qty=positionSize)
if (strategy.position_size > 0)
    strategy.close("Long", when = (long_exit), comment="Close Long")
    strategy.exit("Long", stop = sl, comment="Exit Long")

//SHORT STRATEGY
strategy.entry("Short", strategy.short, comment="Short", when = short_entry and not long_entry, qty=positionSize_short)
if (strategy.position_size < 0) 
    strategy.close("Short", when = (short_exit), comment="Close Short")
    strategy.exit("Short", stop = sl_short, comment="Exit Short")

//ONE DIRECTION TRADING COMMAND (BELLOW ONLY ACTIVATE TO CORRECT BUGS)
//strategy.risk.allow_entry_in(strategy.direction.long)


Больше