Автоматизированная количественная торговая стратегия на основе внутренних баров и скользящих средних
Обзор
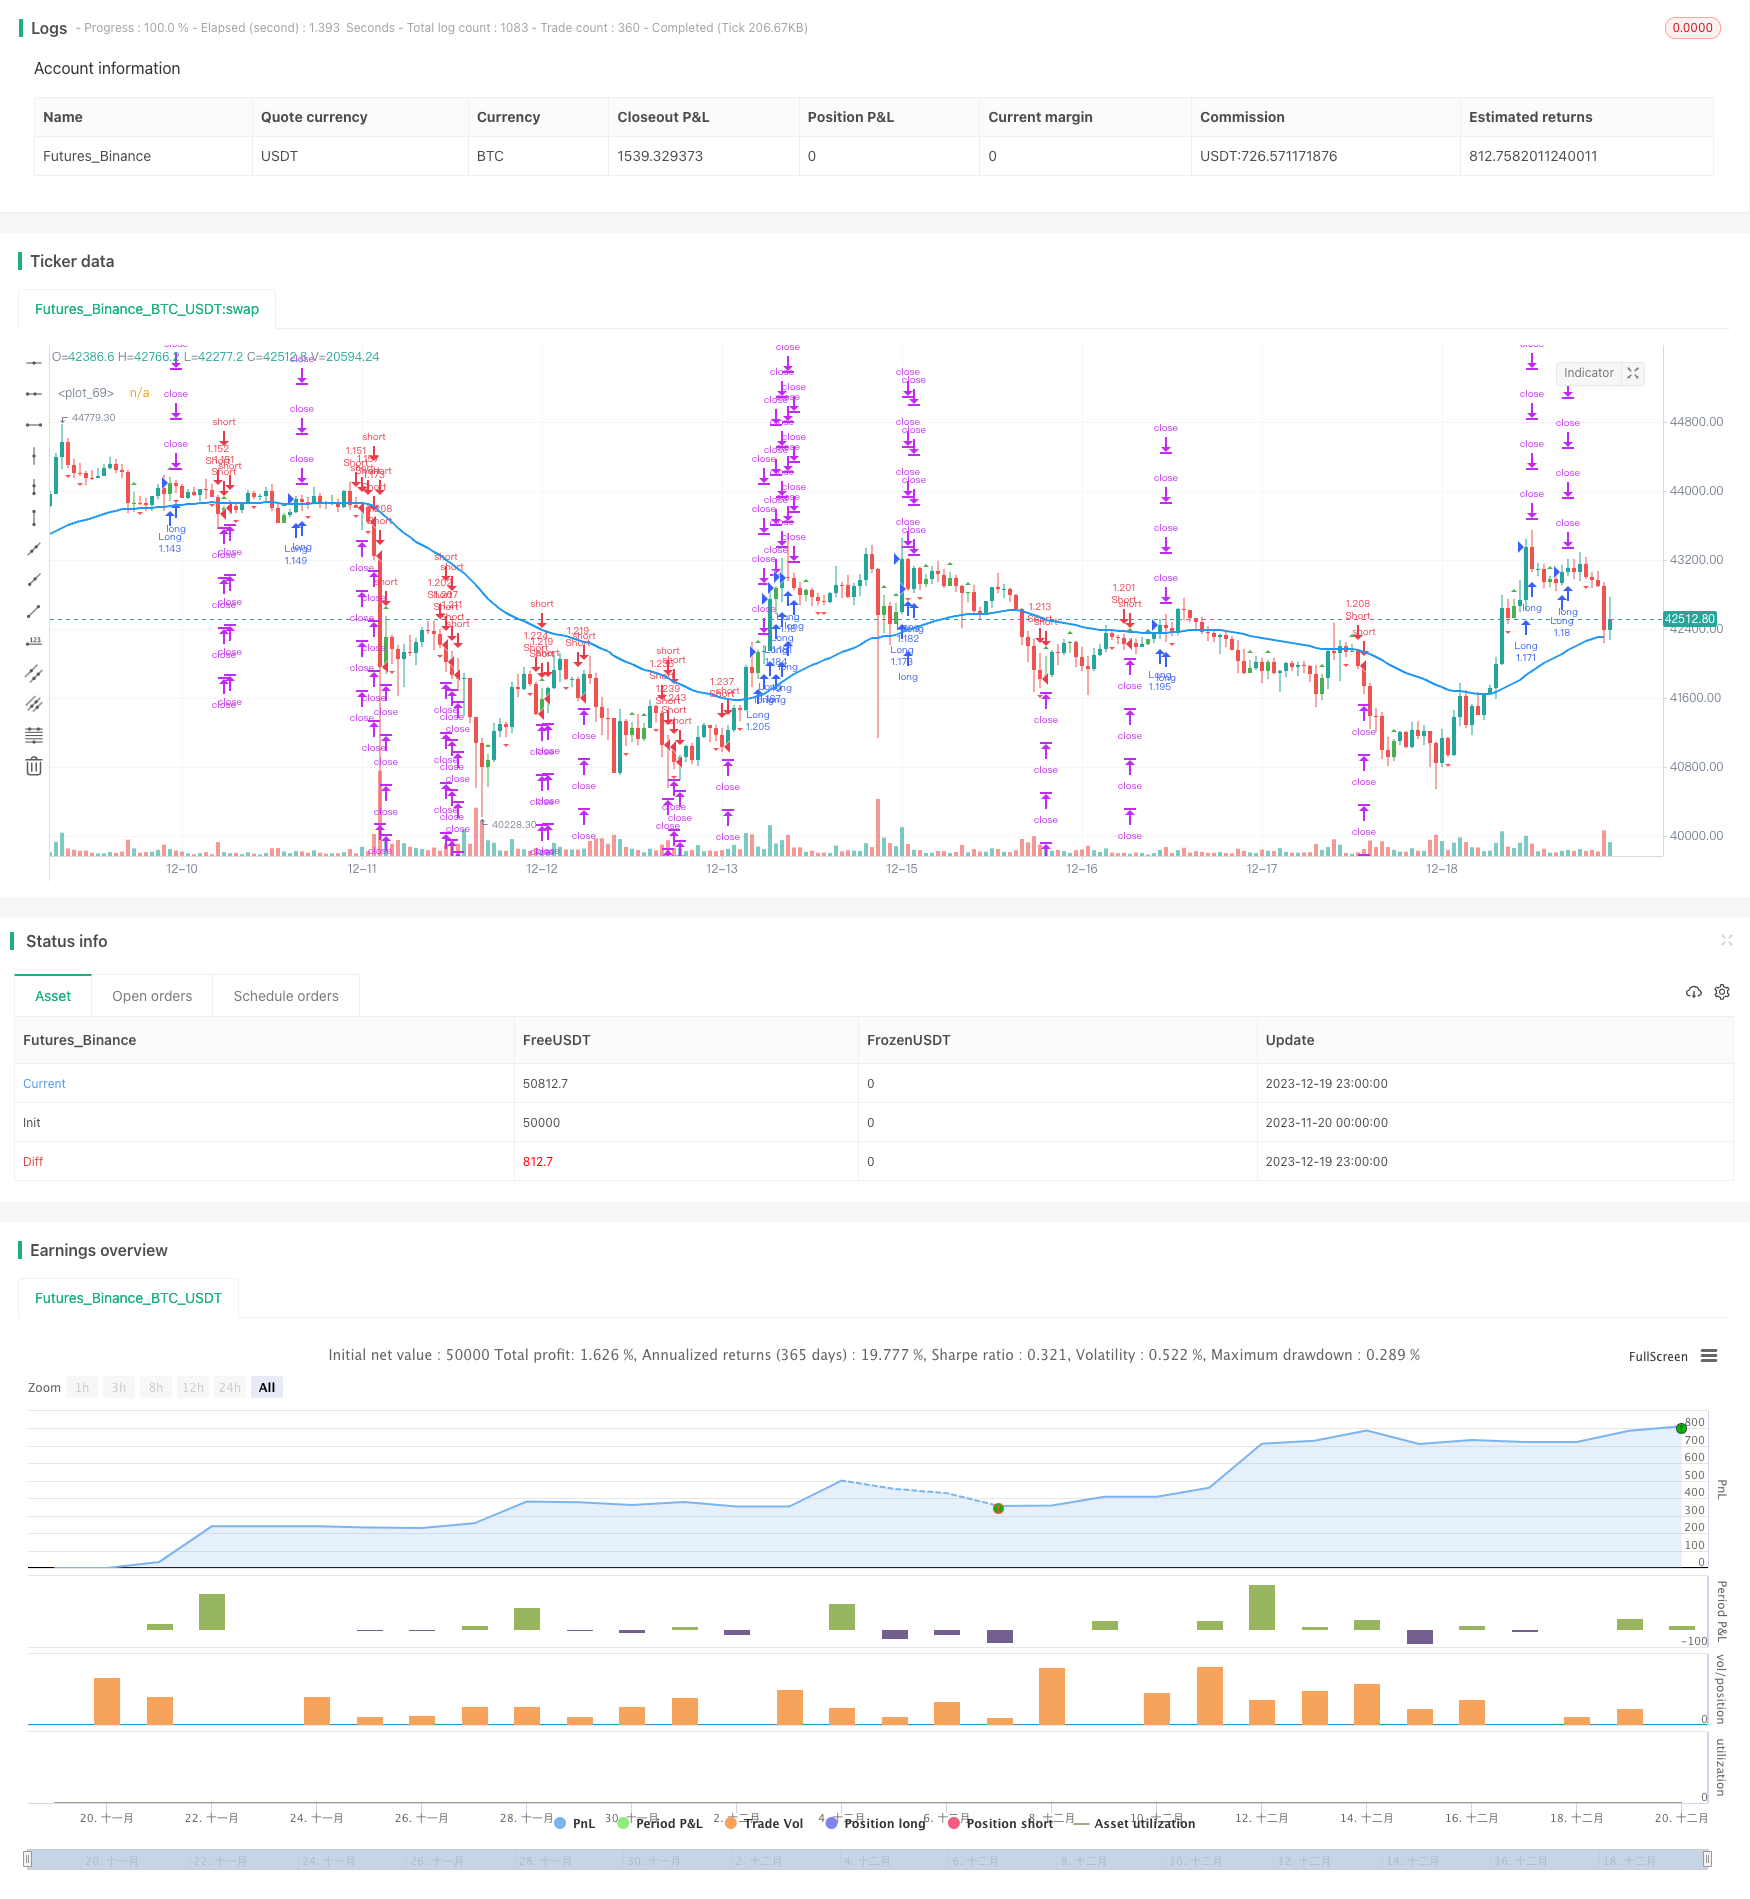
Основная идея этой стратегии заключается в том, чтобы автоматизировать торговлю в сочетании с внутренними столбцами и показателями движущихся средних. Когда внутренние столбцы указывают на то, что текущая тенденция может измениться, мы используем положение движущихся средних для определения окончательного направления торговли.
Стратегический принцип
Поиск формы внутреннего столба. Форма внутреннего столба означает, что наивысшая и наименьшая цены на определенной K-линии находятся между физическими частями предыдущей K-линии. В зависимости от цвета физической части мы можем определить внутренний столб как многоголовый внутренний столб или пустой внутренний столб.
Определение местоположения движущейся средней. При поиске внутреннего столба, если цена выше, чем движущаяся средняя, это многоголовый сигнал, а если цена ниже, чем движущаяся средняя, это пустой сигнал.
В сочетании с формой внутренней столбцы и движущимся средним сигналом многополос, получается окончательное направление торгов. То есть, по-настоящему, по-настоящему, по-настоящему, по-настоящему.
Стратегические преимущества
В сочетании с техническими показателями и ценовой структурой, повышается точность принятия торговых решений.
Внутренние столбцы сами по себе содержат сильные сигналы поворота цены, которые позволяют заранее определить точку перехода.
Движущаяся средняя отсекает часть шума, чтобы избежать зацепления в промежуточных колебаниях.
Полностью автоматизированная торговля значительно сокращает время и затраты на торговлю.
Стратегические риски и решения
Когда цена колеблется вблизи средней линии, возникает больше ошибочных сигналов, что приводит к чрезмерной торговле. Можно уменьшить ошибочные сигналы, оптимизировав параметры движущихся средних или добавив условия фильтрации.
Эта стратегия лучше подходит для рынков с более заметной тенденцией, эффективность которой может быть снижена в условиях шока. Можно использовать индикатор определения тенденции, такой как ADX, для управления запуском алгоритма.
Существует определенная временная задержка. Можно уместно сократить параметры или оптимизировать способ расчета скользящих средних, чтобы уменьшить задержку.
Большой риск вывода. Можно установить стоп-лосс, чтобы контролировать риск убытков, а также соответствующее регулирование управления позициями может помочь снизить вывод.
Направление оптимизации стратегии
Оптимизация внутренних столбцов для определения параметров цикла и поиска оптимальных комбинаций параметров.
Попробуйте различные типы скользящих средних, такие как EMA, SMA и т. д., чтобы определить наиболее подходящий показатель скользящих средних.
Добавление вспомогательных показателей, таких как MACD, KDJ, обогащение основы многопространственного суждения, повышение точности сигнала.
Включение фильтрующих показателей, таких как ADX, ATR, контролирующих алгоритмы, чтобы избежать неблагоприятных рынков.
Оптимизация стратегий управления позициями, таких как контроль рисковых позиций, компенсация упущенной прибыли, чтобы контролировать риск и добиваться более высокой прибыли.
Подвести итог
Эта стратегия реализует полностью автоматизированный набор количественных торговых программ путем динамического отслеживания внутренних сигналов столбцов и показателей движущихся средних. Генерирование сигналов стратегии простое, четкое, легко понятное и отслеживаемое.
/*backtest
start: 2023-11-20 00:00:00
end: 2023-12-20 00:00:00
period: 1h
basePeriod: 15m
exchanges: [{"eid":"Futures_Binance","currency":"BTC_USDT"}]
*/

// This source code is subject to the terms of the Mozilla Public License 2.0 at https://mozilla.org/MPL/2.0/
// © myn

//@version=5
strategy('Strategy Myth-Busting #10 - InsideBar+EMA - [MYN]', max_bars_back=5000, overlay=true, pyramiding=0, initial_capital=20000, currency='USD', default_qty_type=strategy.percent_of_equity, default_qty_value=100.0, commission_value=0.075, use_bar_magnifier = false)

/////////////////////////////////////
//* Put your strategy logic below *//
/////////////////////////////////////
//short if: inside bar and bearish & below 50 ema & price falls below low of inside bar. Opposite for long. on 4H TF

// Inside Bar
//░░░░░░░░░░░░░░░░░░░░░░░░░░░░░░░░░░░░░░░░░░░░░░░░░░░░░░░░░░░░░░░░░░░░░░░░░░░░░░░░░░░░░░░░░░░░░░░░░░░░░░░░░░░░░░░░░░░░░░░░░░░░░░░░░░░░░░░░░░░░░░░░░░

f_priorBarsSatisfied(_objectToEval, _numOfBarsToLookBack) =>
    returnVal = false
    for i = 0 to _numOfBarsToLookBack
        if (_objectToEval[i] == true)
            returnVal = true

i_numLookbackBars = input(2,title="Lookback for Inside Bar")


// This source code is subject to the terms of the GNU License 2.0 at https://www.gnu.org/licenses/old-licenses/gpl-2.0.en.html
// © cma

//@version=5
//indicator('Inside Bar Ind/Alert', overlay=true)

bullishBar = 1
bearishBar = -1

isInside() =>
    previousBar = 1
    bodyStatus = close >= open ? 1 : -1
    isInsidePattern = high < high[previousBar] and low > low[previousBar]

    isInsidePattern ? bodyStatus : 0

barcolor(isInside() == bullishBar ? color.green : na)
barcolor(isInside() == bearishBar ? color.red : na)

// When is bullish bar paint green
plotshape(isInside() == bullishBar, style=shape.triangleup, location=location.abovebar, color=color.new(color.green, 0))

// When is bearish bar paint red
plotshape(isInside() == bearishBar, style=shape.triangledown, location=location.belowbar, color=color.new(color.red, 0))

isInsideBarMade = isInside() == bullishBar or isInside() == bearishBar

alertcondition(isInsideBarMade, title='Inside Bar', message='Inside Bar came up!')

i_srcInsideBarLong = input.source(close, title = "_____ falls above HIGH of inside bar (Long condition)")
i_srcInsideBarShort = input.source(close, title = "_____ falls below LOW of inside bar (Short condition)")


//if: inside bar and falls below low of inside bar. I think.
insideBarLongEntry = f_priorBarsSatisfied(isInside() == bullishBar,i_numLookbackBars) and i_srcInsideBarLong > high[i_numLookbackBars]     //isInside() == bullishBar
insideBarShortEntry = f_priorBarsSatisfied(isInside() == bearishBar,i_numLookbackBars)  and i_srcInsideBarShort < low[i_numLookbackBars]    //isInside() == bearishBar


// EMA
//░░░░░░░░░░░░░░░░░░░░░░░░░░░░░░░░░░░░░░░░░░░░░░░░░░░░░░░░░░░░░░░░░░░░░░░░░░░░░░░░░░░░░░░░░░░░░░░░░░░░░░░░░░░░░░░░░░░░░░░░░░░░░░░░░░░░░░░░░░░░░░░░░░

i_src = input.source(close, title = "EMA Source")
i_emaLength = input(50,title="EMA Length")
ema = ta.ema(i_src, i_emaLength)
emaPlot = plot(series=ema,color=color.blue, linewidth=2)

emaLongEntry = i_src > ema
emaShortEntry = i_src < ema

//////////////////////////////////////
//* Put your strategy rules below *//
/////////////////////////////////////

longCondition = insideBarLongEntry and emaLongEntry
shortCondition = insideBarShortEntry and emaShortEntry
//define as 0 if do not want to use
closeLongCondition = 0
closeShortCondition = 0


// ADX
//░░░░░░░░░░░░░░░░░░░░░░░░░░░░░░░░░░░░░░░░░░░░░░░░░░░░░░░░░░░░░░░░░░░░░░░░░░░░░░░░░░░░░░░░░░░░░░░░░░░░░░░░░░░░░░░░░░░░░░░░░░░░░░░░░░░░░░░░░░░░░░░░░░

adxEnabled = input.bool(defval = false , title = "Average Directional Index (ADX)", tooltip = "", group ="ADX" )
adxlen = input(14, title="ADX Smoothing", group="ADX")
adxdilen = input(14, title="DI Length", group="ADX")
adxabove = input(25, title="ADX Threshold", group="ADX")

adxdirmov(len) =>
	adxup = ta.change(high)
	adxdown = -ta.change(low)
	adxplusDM = na(adxup) ? na : (adxup > adxdown and adxup > 0 ? adxup : 0)
	adxminusDM = na(adxdown) ? na : (adxdown > adxup and adxdown > 0 ? adxdown : 0)
	adxtruerange = ta.rma(ta.tr, len)
	adxplus = fixnan(100 * ta.rma(adxplusDM, len) / adxtruerange)
	adxminus = fixnan(100 * ta.rma(adxminusDM, len) / adxtruerange)
	[adxplus, adxminus]
adx(adxdilen, adxlen) =>
	[adxplus, adxminus] = adxdirmov(adxdilen)
	adxsum = adxplus + adxminus
	adx = 100 * ta.rma(math.abs(adxplus - adxminus) / (adxsum == 0 ? 1 : adxsum), adxlen)

adxsig = adxEnabled ? adx(adxdilen, adxlen) : na
isADXEnabledAndAboveThreshold = adxEnabled ? (adxsig > adxabove) : true

//Backtesting Time Period (Input.time not working as expected as of 03/30/2021.  Giving odd start/end dates
//░░░░░░░░░░░░░░░░░░░░░░░░░░░░░░░░░░░░░░░░░░░░░░░░░░░░░░░░░░░░░░░░░░░░░░░░░░░░░░░░░░░░░░░░░░░░░░░░░░░░░░░░░░░░░░░░░░░░░░░░░░░░░░░░░░░░░░░░░░░░░░░░░░
useStartPeriodTime = input.bool(true, 'Start', group='Date Range', inline='Start Period')
startPeriodTime = input(timestamp('1 Jan 2019'), '', group='Date Range', inline='Start Period')
useEndPeriodTime = input.bool(true, 'End', group='Date Range', inline='End Period')
endPeriodTime = input(timestamp('31 Dec 2030'), '', group='Date Range', inline='End Period')

start = useStartPeriodTime ? startPeriodTime >= time : false
end = useEndPeriodTime ? endPeriodTime <= time : false
calcPeriod = true

// Trade Direction
// ░░░░░░░░░░░░░░░░░░░░░░░░░░░░░░░░░░░░░░░░░░░░░░░░░░░░░░░░░░░░░░░░░░░░░░░░░░░░░░░░░░░░░░░░░░░░░░░░░░░░░░░░░░░░░░░░░░░░░░░░░░░░░░░░░░░░░░░░░░░░░░░░░░
tradeDirection = input.string('Long and Short', title='Trade Direction', options=['Long and Short', 'Long Only', 'Short Only'], group='Trade Direction')

// Percent as Points
// ░░░░░░░░░░░░░░░░░░░░░░░░░░░░░░░░░░░░░░░░░░░░░░░░░░░░░░░░░░░░░░░░░░░░░░░░░░░░░░░░░░░░░░░░░░░░░░░░░░░░░░░░░░░░░░░░░░░░░░░░░░░░░░░░░░░░░░░░░░░░░░░░░░
per(pcnt) =>
    strategy.position_size != 0 ? math.round(pcnt / 100 * strategy.position_avg_price / syminfo.mintick) : float(na)

// Take profit 1
// ░░░░░░░░░░░░░░░░░░░░░░░░░░░░░░░░░░░░░░░░░░░░░░░░░░░░░░░░░░░░░░░░░░░░░░░░░░░░░░░░░░░░░░░░░░░░░░░░░░░░░░░░░░░░░░░░░░░░░░░░░░░░░░░░░░░░░░░░░░░░░░░░░░
tp1 = input.float(title='Take Profit 1 - Target %', defval=10.5, minval=0.0, step=0.5, group='Take Profit', inline='Take Profit 1')
q1 = input.int(title='% Of Position', defval=25, minval=0, group='Take Profit', inline='Take Profit 1')

// Take profit 2
// ░░░░░░░░░░░░░░░░░░░░░░░░░░░░░░░░░░░░░░░░░░░░░░░░░░░░░░░░░░░░░░░░░░░░░░░░░░░░░░░░░░░░░░░░░░░░░░░░░░░░░░░░░░░░░░░░░░░░░░░░░░░░░░░░░░░░░░░░░░░░░░░░░░
tp2 = input.float(title='Take Profit 2 - Target %', defval=11, minval=0.0, step=0.5, group='Take Profit', inline='Take Profit 2')
q2 = input.int(title='% Of Position', defval=25, minval=0, group='Take Profit', inline='Take Profit 2')

// Take profit 3
// ░░░░░░░░░░░░░░░░░░░░░░░░░░░░░░░░░░░░░░░░░░░░░░░░░░░░░░░░░░░░░░░░░░░░░░░░░░░░░░░░░░░░░░░░░░░░░░░░░░░░░░░░░░░░░░░░░░░░░░░░░░░░░░░░░░░░░░░░░░░░░░░░░░
tp3 = input.float(title='Take Profit 3 - Target %', defval=11.5, minval=0.0, step=0.5, group='Take Profit', inline='Take Profit 3')
q3 = input.int(title='% Of Position', defval=25, minval=0, group='Take Profit', inline='Take Profit 3')

// Take profit 4
// ░░░░░░░░░░░░░░░░░░░░░░░░░░░░░░░░░░░░░░░░░░░░░░░░░░░░░░░░░░░░░░░░░░░░░░░░░░░░░░░░░░░░░░░░░░░░░░░░░░░░░░░░░░░░░░░░░░░░░░░░░░░░░░░░░░░░░░░░░░░░░░░░░░
tp4 = input.float(title='Take Profit 4 - Target %', defval=12, minval=0.0, step=0.5, group='Take Profit')

/// Stop Loss
// ░░░░░░░░░░░░░░░░░░░░░░░░░░░░░░░░░░░░░░░░░░░░░░░░░░░░░░░░░░░░░░░░░░░░░░░░░░░░░░░░░░░░░░░░░░░░░░░░░░░░░░░░░░░░░░░░░░░░░░░░░░░░░░░░░░░░░░░░░░░░░░░░░░
stoplossPercent = input.float(title='Stop Loss (%)', defval=4, minval=0.01, group='Stop Loss') * 0.01
slLongClose = close < strategy.position_avg_price * (1 - stoplossPercent)
slShortClose = close > strategy.position_avg_price * (1 + stoplossPercent)

/// Leverage
// ░░░░░░░░░░░░░░░░░░░░░░░░░░░░░░░░░░░░░░░░░░░░░░░░░░░░░░░░░░░░░░░░░░░░░░░░░░░░░░░░░░░░░░░░░░░░░░░░░░░░░░░░░░░░░░░░░░░░░░░░░░░░░░░░░░░░░░░░░░░░░░░░░░
leverage = input.float(1, 'Leverage', step=.5, group='Leverage')
contracts = math.min(math.max(.000001, strategy.equity / close * leverage), 1000000000)


/// Trade State Management
// ░░░░░░░░░░░░░░░░░░░░░░░░░░░░░░░░░░░░░░░░░░░░░░░░░░░░░░░░░░░░░░░░░░░░░░░░░░░░░░░░░░░░░░░░░░░░░░░░░░░░░░░░░░░░░░░░░░░░░░░░░░░░░░░░░░░░░░░░░░░░░░░░░░

isInLongPosition = strategy.position_size > 0
isInShortPosition = strategy.position_size < 0

/// ProfitView Alert Syntax String Generation
// ░░░░░░░░░░░░░░░░░░░░░░░░░░░░░░░░░░░░░░░░░░░░░░░░░░░░░░░░░░░░░░░░░░░░░░░░░░░░░░░░░░░░░░░░░░░░░░░░░░░░░░░░░░░░░░░░░░░░░░░░░░░░░░░░░░░░░░░░░░░░░░░░░░

alertSyntaxPrefix = input.string(defval='CRYPTANEX_99FTX_Strategy-Name-Here', title='Alert Syntax Prefix', group='ProfitView Alert Syntax')
alertSyntaxBase = alertSyntaxPrefix + '\n#' + str.tostring(open) + ',' + str.tostring(high) + ',' + str.tostring(low) + ',' + str.tostring(close) + ',' + str.tostring(volume) + ','


/// Trade Execution
// ░░░░░░░░░░░░░░░░░░░░░░░░░░░░░░░░░░░░░░░░░░░░░░░░░░░░░░░░░░░░░░░░░░░░░░░░░░░░░░░░░░░░░░░░░░░░░░░░░░░░░░░░░░░░░░░░░░░░░░░░░░░░░░░░░░░░░░░░░░░░░░░░░░

longConditionCalc = (longCondition and isADXEnabledAndAboveThreshold)
shortConditionCalc = (shortCondition and isADXEnabledAndAboveThreshold)

if calcPeriod
    if longConditionCalc and tradeDirection != 'Short Only' and isInLongPosition == false
        strategy.entry('Long', strategy.long, qty=contracts)

        alert(message=alertSyntaxBase + 'side:long', freq=alert.freq_once_per_bar_close)

    if shortConditionCalc and tradeDirection != 'Long Only' and isInShortPosition == false
        strategy.entry('Short', strategy.short, qty=contracts)

        alert(message=alertSyntaxBase + 'side:short', freq=alert.freq_once_per_bar_close)

    //Inspired from Multiple %% profit exits example by adolgo https://www.tradingview.com/script/kHhCik9f-Multiple-profit-exits-example/
    strategy.exit('TP1', qty_percent=q1, profit=per(tp1))
    strategy.exit('TP2', qty_percent=q2, profit=per(tp2))
    strategy.exit('TP3', qty_percent=q3, profit=per(tp3))
    strategy.exit('TP4', profit=per(tp4))

    strategy.close('Long', qty_percent=100, comment='SL Long', when=slLongClose)
    strategy.close('Short', qty_percent=100, comment='SL Short', when=slShortClose)

    strategy.close_all(when=closeLongCondition or closeShortCondition, comment='Close Postion')

/// Dashboard
// ░░░░░░░░░░░░░░░░░░░░░░░░░░░░░░░░░░░░░░░░░░░░░░░░░░░░░░░░░░░░░░░░░░░░░░░░░░░░░░░░░░░░░░░░░░░░░░░░░░░░░░░░░░░░░░░░░░░░░░░░░░░░░░░░░░░░░░░░░░░░░░░░░░
// Inspired by https://www.tradingview.com/script/uWqKX6A2/ - Thanks VertMT

showDashboard = input.bool(group="Dashboard", title="Show Dashboard", defval=false)

f_fillCell(_table, _column, _row, _title, _value, _bgcolor, _txtcolor) =>
    _cellText = _title + "\n" + _value
    table.cell(_table, _column, _row, _cellText, bgcolor=_bgcolor, text_color=_txtcolor, text_size=size.auto)

// Draw dashboard table
if showDashboard
    var bgcolor = color.new(color.black,0)

    // Keep track of Wins/Losses streaks
    newWin  = (strategy.wintrades  > strategy.wintrades[1]) and (strategy.losstrades == strategy.losstrades[1]) and (strategy.eventrades == strategy.eventrades[1])
    newLoss = (strategy.wintrades == strategy.wintrades[1]) and (strategy.losstrades  > strategy.losstrades[1]) and (strategy.eventrades == strategy.eventrades[1])

    varip int winRow     = 0
    varip int lossRow    = 0
    varip int maxWinRow  = 0
    varip int maxLossRow = 0

    if newWin
        lossRow := 0
        winRow := winRow + 1
    if winRow > maxWinRow
        maxWinRow := winRow

    if newLoss
        winRow := 0
        lossRow := lossRow + 1
    if lossRow > maxLossRow
        maxLossRow := lossRow


    // Prepare stats table
    var table dashTable = table.new(position.bottom_right, 1, 15, border_width=1)


    if barstate.islastconfirmedhistory
        // Update table
        dollarReturn = strategy.netprofit
        f_fillCell(dashTable, 0, 0, "Start:", str.format("{0,date,long}", strategy.closedtrades.entry_time(0)) , bgcolor, color.white) // + str.format(" {0,time,HH:mm}", strategy.closedtrades.entry_time(0))
        f_fillCell(dashTable, 0, 1, "End:", str.format("{0,date,long}", strategy.opentrades.entry_time(0)) , bgcolor, color.white) // + str.format(" {0,time,HH:mm}", strategy.opentrades.entry_time(0))
        _profit = (strategy.netprofit / strategy.initial_capital) * 100
        f_fillCell(dashTable, 0, 2, "Net Profit:", str.tostring(_profit, '##.##') + "%", _profit > 0 ? color.green : color.red, color.white)
        _numOfDaysInStrategy = (strategy.opentrades.entry_time(0) - strategy.closedtrades.entry_time(0)) / (1000 * 3600 * 24)
        f_fillCell(dashTable, 0, 3, "Percent Per Day", str.tostring(_profit / _numOfDaysInStrategy, '#########################.#####')+"%", _profit > 0 ? color.green : color.red, color.white)
        _winRate = ( strategy.wintrades / strategy.closedtrades ) * 100
        f_fillCell(dashTable, 0, 4, "Percent Profitable:", str.tostring(_winRate, '##.##') + "%", _winRate < 50 ? color.red : _winRate < 75 ? #999900 : color.green, color.white)
        f_fillCell(dashTable, 0, 5, "Profit Factor:", str.tostring(strategy.grossprofit / strategy.grossloss,  '##.###'), strategy.grossprofit > strategy.grossloss ? color.green : color.red, color.white)
        f_fillCell(dashTable, 0, 6, "Total Trades:", str.tostring(strategy.closedtrades), bgcolor, color.white)
        f_fillCell(dashTable, 0, 8, "Max Wins In A Row:", str.tostring(maxWinRow, '######') , bgcolor, color.white)
        f_fillCell(dashTable, 0, 9, "Max Losses In A Row:", str.tostring(maxLossRow, '######') , bgcolor, color.white)