Chiến lược theo dõi xu hướng dựa trên sự đột phá động lực

Tác giả:ChaoZhang, Ngày: 2023-11-06 09:37:44
Tags:

img

Tổng quan

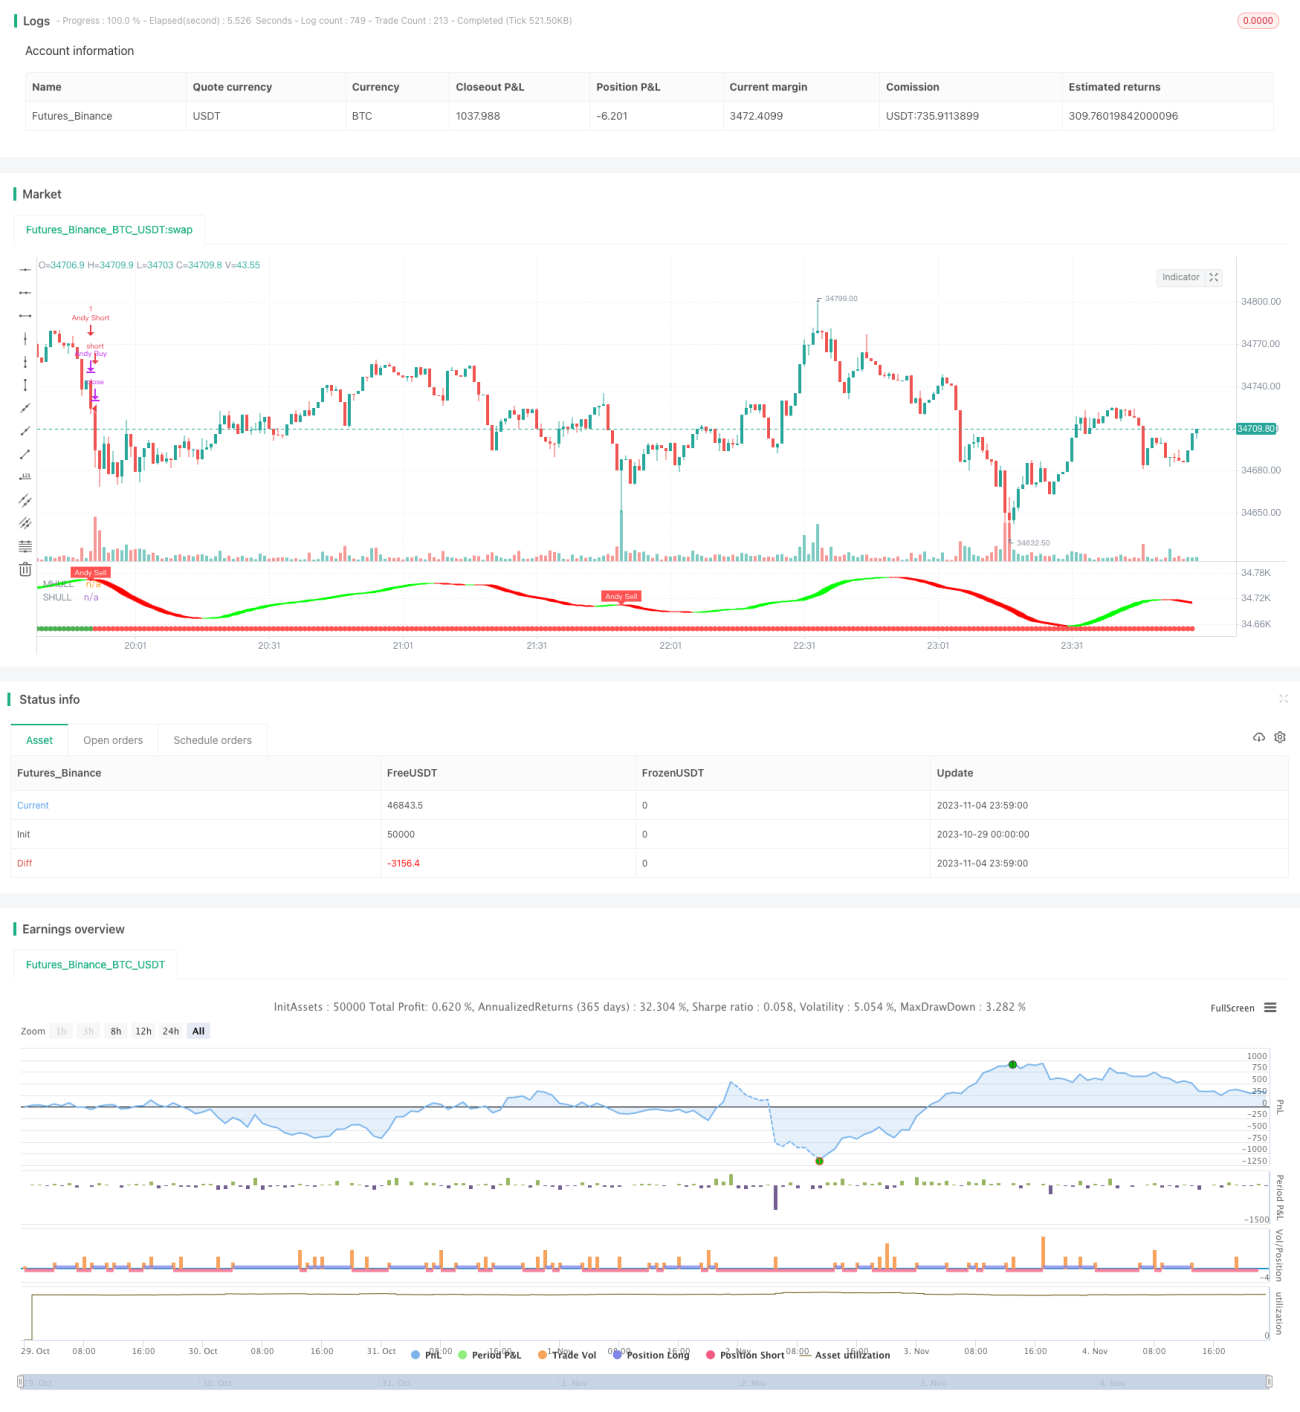
Chiến lược này kết hợp nhiều chỉ số kỹ thuật để xác định hướng xu hướng và theo dõi động lực khi đột phá xảy ra, nhằm mục đích lợi nhuận vượt quá.

Chiến lược logic

  1. Sử dụng kênh Donchian để xác định xu hướng tổng thể.

  2. Hull Moving Average giúp đánh giá hướng xu hướng. Nó nhạy cảm với sự thay đổi giá và có thể phát hiện sớm sự đảo ngược xu hướng.

  3. Hệ thống Halftrend tạo ra tín hiệu mua và bán dựa trên kênh giá và phạm vi ATR.

  4. Khi các tín hiệu Donchian, Hull và Halftrend liên kết, một đợt đột phá mạnh mẽ được xác nhận và chiến lược được đưa vào.

  5. Ra khỏi khi các chỉ số trên cung cấp tín hiệu đảo ngược, cho thấy sự đảo ngược xu hướng.

Phân tích lợi thế

  • tín hiệu mạnh mẽ hơn với nhiều chỉ số, Donchian cho cơ bản, Hull và Halftrend cho chi tiết, bắt điểm biến đổi xu hướng chính xác

  • Theo đuổi lợi nhuận vượt quá bằng cách phá vỡ động lực.

  • Đặt mức dừng lỗ nghiêm ngặt để đảm bảo sự an toàn của vốn.

  • Điều chỉnh tham số linh hoạt cho các thị trường khác nhau.

  • Dễ hiểu và thực hiện. Indicator combo đơn giản và rõ ràng, dễ lập trình.

Phân tích rủi ro

  • Không có cơ hội xu hướng đầu tiên, nhập vào tương đối muộn, không bắt được xu hướng đầu tiên.

  • Mất lỗ do thất bại và đảo ngược.

  • tín hiệu sai từ tham số sai, chỉ số có thể bị hỏng do điều chỉnh sai.

  • Tần suất giao dịch hạn chế. Chỉ có những vụ phá vỡ rõ ràng được giao dịch, dẫn đến số lượng giao dịch hàng năm thấp.

Hướng dẫn tối ưu hóa

  • Tối ưu hóa sự kết hợp các tham số bằng cách thử nghiệm. Tìm các tham số tốt nhất.

  • Thêm điều kiện dừng lỗ sau. Tránh dừng lỗ sớm.

  • Tạo thêm các bộ lọc như MACD, KDJ để lọc các tín hiệu xấu.

  • Tối ưu hóa các tham số cho các phiên khác nhau. Các phiên khác nhau có thể được điều chỉnh riêng biệt.

  • Cải thiện hiệu quả vốn thông qua đòn bẩy, DCA vv. Sử dụng vốn tốt hơn.

Tóm lại

Chiến lược này kết hợp nhiều chỉ số để xác định đà bứt phá của xu hướng đã được thiết lập và lợi nhuận từ theo dõi xu hướng. Đánh giá dừng lỗ nghiêm ngặt quản lý rủi ro. Các tham số linh hoạt thích nghi với môi trường thị trường khác nhau. Mặc dù tần suất giao dịch thấp, mỗi giao dịch nhắm mục tiêu lợi nhuận cao. Chiến lược có thể được cải thiện liên tục thông qua điều chỉnh tham số, bộ lọc bổ sung vv.


/*backtest
start: 2023-10-29 00:00:00
end: 2023-11-05 00:00:00
period: 1m
basePeriod: 1m
exchanges: [{"eid":"Futures_Binance","currency":"BTC_USDT"}]
*/

// This source code is subject to the terms of the Mozilla Public License 2.0 at https://mozilla.org/MPL/2.0/
// © kgynofomo

// @version=5
strategy(title="[Salavi] | Andy Super Pro Strategy",overlay = true)

//Doinchian Trend Ribbon
dlen = input.int(defval=30, minval=10)

dchannel(len) =>
    float hh = ta.highest(len)
    float ll = ta.lowest(len)

    int trend = 0
    trend := close > hh[1] ? 1 : close < ll[1] ? -1 : nz(trend[1])
    trend

dchannelalt(len, maintrend) =>
    float hh = ta.highest(len)
    float ll = ta.lowest(len)

    int trend = 0
    trend := close > hh[1] ? 1 : close < ll[1] ? -1 : nz(trend[1])
    maintrend == 1 ? trend == 1 ? #00FF00ff : #00FF009f : maintrend == -1 ? trend == -1 ? #FF0000ff : #FF00009f : na

maintrend = dchannel(dlen)
donchian_bull = maintrend==1
donchian_bear = maintrend==-1


//Hulls
src = input(hlc3, title='Source')
modeSwitch = input.string('Hma', title='Hull Variation', options=['Hma', 'Thma', 'Ehma'])
length = input(55, title='Length')
lengthMult = input(1.0, title='Length multiplier ')

useHtf = false
htf = '240'

switchColor = true
candleCol = false
visualSwitch = true
thicknesSwitch = 1
transpSwitch = 40

//FUNCTIONS
//HMA
HMA(_src, _length) =>
    ta.wma(2 * ta.wma(_src, _length / 2) - ta.wma(_src, _length), math.round(math.sqrt(_length)))
//EHMA    
EHMA(_src, _length) =>
    ta.ema(2 * ta.ema(_src, _length / 2) - ta.ema(_src, _length), math.round(math.sqrt(_length)))
//THMA    
THMA(_src, _length) =>
    ta.wma(ta.wma(_src, _length / 3) * 3 - ta.wma(_src, _length / 2) - ta.wma(_src, _length), _length)

//SWITCH
Mode(modeSwitch, src, len) =>
    modeSwitch == 'Hma' ? HMA(src, len) : modeSwitch == 'Ehma' ? EHMA(src, len) : modeSwitch == 'Thma' ? THMA(src, len / 2) : na

//OUT
_hull = Mode(modeSwitch, src, int(length * lengthMult))
HULL = useHtf ? request.security(syminfo.ticker, htf, _hull) : _hull
MHULL = HULL[0]
SHULL = HULL[2]

//COLOR
hullColor = switchColor ? HULL > HULL[2] ? #00ff00 : #ff0000 : #ff9800
hull_bull = HULL > HULL[2]
bull_start = hull_bull and hull_bull[1]==false
hull_bear = HULL < HULL[2]
bear_start = hull_bear and hull_bear[1]==false

barcolor(color=candleCol ? switchColor ? hullColor : na : na)

//halftrend
amplitude = input(title='Amplitude', defval=2)
channelDeviation = input(title='Channel Deviation', defval=2)
// showArrows = input(title='Show Arrows', defval=true)
// showChannels = input(title='Show Channels', defval=true)

var int trend = 0
var int nextTrend = 0
var float maxLowPrice = nz(low[1], low)
var float minHighPrice = nz(high[1], high)

var float up = 0.0
var float down = 0.0
float atrHigh = 0.0
float atrLow = 0.0
float arrowUp = na
float arrowDown = na

atr2 = ta.atr(100) / 2
dev = channelDeviation * atr2

highPrice = high[math.abs(ta.highestbars(amplitude))]
lowPrice = low[math.abs(ta.lowestbars(amplitude))]
highma = ta.sma(high, amplitude)
lowma = ta.sma(low, amplitude)

if nextTrend == 1
    maxLowPrice := math.max(lowPrice, maxLowPrice)

    if highma < maxLowPrice and close < nz(low[1], low)
        trend := 1
        nextTrend := 0
        minHighPrice := highPrice
        minHighPrice
else
    minHighPrice := math.min(highPrice, minHighPrice)

    if lowma > minHighPrice and close > nz(high[1], high)
        trend := 0
        nextTrend := 1
        maxLowPrice := lowPrice
        maxLowPrice

if trend == 0
    if not na(trend[1]) and trend[1] != 0
        up := na(down[1]) ? down : down[1]
        arrowUp := up - atr2
        arrowUp
    else
        up := na(up[1]) ? maxLowPrice : math.max(maxLowPrice, up[1])
        up
    atrHigh := up + dev
    atrLow := up - dev
    atrLow
else
    if not na(trend[1]) and trend[1] != 1
        down := na(up[1]) ? up : up[1]
        arrowDown := down + atr2
        arrowDown
    else
        down := na(down[1]) ? minHighPrice : math.min(minHighPrice, down[1])
        down
    atrHigh := down + dev
    atrLow := down - dev
    atrLow

ht = trend == 0 ? up : down

var color buyColor = color.blue
var color sellColor = color.red

htColor = trend == 0 ? buyColor : sellColor
// htPlot = plot(ht, title='HalfTrend', linewidth=2, color=htColor)

// atrHighPlot = plot(showChannels ? atrHigh : na, title='ATR High', style=plot.style_circles, color=color.new(sellColor, 0))
// atrLowPlot = plot(showChannels ? atrLow : na, title='ATR Low', style=plot.style_circles, color=color.new(buyColor, 0))

// fill(htPlot, atrHighPlot, title='ATR High Ribbon', color=color.new(sellColor, 90))
// fill(htPlot, atrLowPlot, title='ATR Low Ribbon', color=color.new(buyColor, 90))

HalfTrend_buySignal = not na(arrowUp) and trend == 0 and trend[1] == 1
HalfTrend_sellSignal = not na(arrowDown) and trend == 1 and trend[1] == 0

// plotshape(showArrows and buySignal ? atrLow : na, title='Arrow Up', style=shape.triangleup, location=location.absolute, size=size.tiny, color=color.new(buyColor, 0))
// plotshape(showArrows and sellSignal ? atrHigh : na, title='Arrow Down', style=shape.triangledown, location=location.absolute, size=size.tiny, color=color.new(sellColor, 0))


//ema
filter_ema = ta.ema(close,200)
ema_bull = close>filter_ema
ema_bear = close<filter_ema

atr_length = input.int(7)
atr = ta.atr(atr_length)
atr_rsi_length = input.int(50)
atr_rsi = ta.rsi(atr,atr_rsi_length)
atr_valid = atr_rsi>50

longCondition = bull_start and atr_valid
shortCondition = bear_start and atr_valid

Exit_long_condition = shortCondition
Exit_short_condition = longCondition

if longCondition
    strategy.entry("Andy Buy",strategy.long, limit=close,comment="Andy Buy Here")

if Exit_long_condition
    strategy.close("Andy Buy",comment="Andy Buy Out")
    // strategy.entry("Andy fandan Short",strategy.short, limit=close,comment="Andy 翻單 short Here")
    // strategy.close("Andy fandan Buy",comment="Andy short Out")


if shortCondition
    strategy.entry("Andy Short",strategy.short, limit=close,comment="Andy short Here")


// strategy.exit("STR","Long",stop=longstoploss)
if Exit_short_condition
    strategy.close("Andy Short",comment="Andy short Out")
    // strategy.entry("Andy fandan Buy",strategy.long, limit=close,comment="Andy 翻單 Buy Here")
    // strategy.close("Andy fandan Short",comment="Andy Buy Out")


inLongTrade = strategy.position_size > 0
inLongTradecolor = #58D68D
notInTrade = strategy.position_size == 0
inShortTrade = strategy.position_size < 0

// bgcolor(color = inLongTrade?color.rgb(76, 175, 79, 70):inShortTrade?color.rgb(255, 82, 82, 70):na)
plotshape(close!=0,location = location.bottom,color = inLongTrade?color.green:inShortTrade?color.red:na)


plotshape(longCondition, title='Buy', text='Andy Buy', style=shape.labelup, location=location.belowbar, color=color.new(color.green, 0), textcolor=color.new(color.white, 0), size=size.tiny)
plotshape(shortCondition, title='Sell', text='Andy Sell', style=shape.labeldown, location=location.abovebar, color=color.new(color.red, 0), textcolor=color.new(color.white, 0), size=size.tiny)

Fi1 = plot(MHULL, title='MHULL', color=hullColor, linewidth=thicknesSwitch, transp=50)
Fi2 = plot(SHULL, title='SHULL', color=hullColor, linewidth=thicknesSwitch, transp=50)

fill(Fi1, Fi2, title='Band Filler', color=hullColor, transp=transpSwitch)


Thêm nữa