Chiến lược tăng liên tục của đường trung bình động double click golden cross

Tổng quan
Đây là một chiến lược giao dịch sử dụng hình thức moving average line gold fork, kết hợp với đường xu hướng liên tục tăng lên. Khi đường nhanh từ phía dưới phá vỡ đường chậm, tạo ra tín hiệu vàng. Nếu xu hướng sau khi gai vàng có thể tiếp tục tăng lên, thì bạn có thể mở nhiều vị trí ở giai đoạn này.
Nguyên tắc chiến lược
Chiến lược này chủ yếu dựa trên hình dạng vàng của đường trung bình di chuyển để đánh giá thời gian vào cửa. Cụ thể, xác định một đường trung bình di chuyển nhanh MA1 và đường trung bình di chuyển chậm MA2.
Để tránh các tín hiệu sai do các đường nứt ngắn hạn, chiến lược này đã thêm vào phán quyết giảm giá góc, tức là chỉ kích hoạt tín hiệu mua khi góc của MA2 lớn hơn mức giảm được đặt. Điều này có thể lọc ra một số tăng ngắn hạn không có xu hướng.
Chiến lược đặt cả đường dừng và đường dừng. Đường dừng được sử dụng để tránh tổn thất do thị trường đột ngột chuyển hướng, và đường dừng được sử dụng để khóa lợi nhuận.
Khi giá tăng lên đến điểm dừng, chiến lược sẽ chọn dừng và rời khỏi sân. Đồng thời, nếu giá tăng mạnh trong vòng này, chiến lược sẽ thực hiện lại hoạt động đảo ngược.
Phân tích lợi thế
Đây là một chiến lược theo dõi xu hướng đơn giản và trực quan.
- Sử dụng kết hợp trung bình di chuyển để lọc ra tiếng ồn thị trường và khóa hướng xu hướng
- Mức độ góc giảm có thể tránh được sự sai lệch của các biến động ngắn hạn
- Hoạt động hai chiều, lợi nhuận trong tình trạng chấn động
- Thiết lập Stop Loss Stop, Kiểm soát rủi ro
Phân tích rủi ro
Chiến lược này cũng có một số rủi ro cần lưu ý:
- Trung bình di chuyển bị tụt hậu, có thể bỏ lỡ điểm biến đổi giá
- Trong một thị trường thay đổi nhanh chóng, mặc dù có điểm dừng, nhưng xác suất phá vỡ điểm dừng vẫn tồn tại
- Rủi ro trong giao dịch song phương tăng gấp đôi, lựa chọn sai điểm bán hàng có thể gây thiệt hại
- Các tham số được đặt không đúng cách, chẳng hạn như chọn chu kỳ trung bình di chuyển, có thể ảnh hưởng đến hiệu suất của chiến lược
Hướng tối ưu hóa
Chiến lược này có thể được tối ưu hóa thêm bằng cách:
- Tăng các chỉ số định hướng, như MACD, Blink, để tăng độ chính xác định vị
- Các tham số chu kỳ của các trung bình di động được tối ưu hóa động theo các phương pháp như học máy
- Tối ưu hóa các thiết lập dừng lỗ, như sử dụng theo dõi dừng lỗ
- Tăng cường kiểm soát khối lượng giao dịch để tránh thua lỗ quá mức
- Kết hợp các chỉ số như dấu đoạn để đánh giá cường độ của xu hướng trong vòng này, điều chỉnh động lực để mở vị thế
Tóm tắt
Nhìn chung, đây là một chiến lược theo dõi xu hướng đơn giản và thực tế. Nó có một số lợi thế, nhưng cũng cần chú ý đến rủi ro. Có thể đạt được lợi nhuận ổn định tốt hơn bằng cách tối ưu hóa tham số, lựa chọn chỉ số, thiết lập điểm dừng lỗ, v.v.
/*backtest
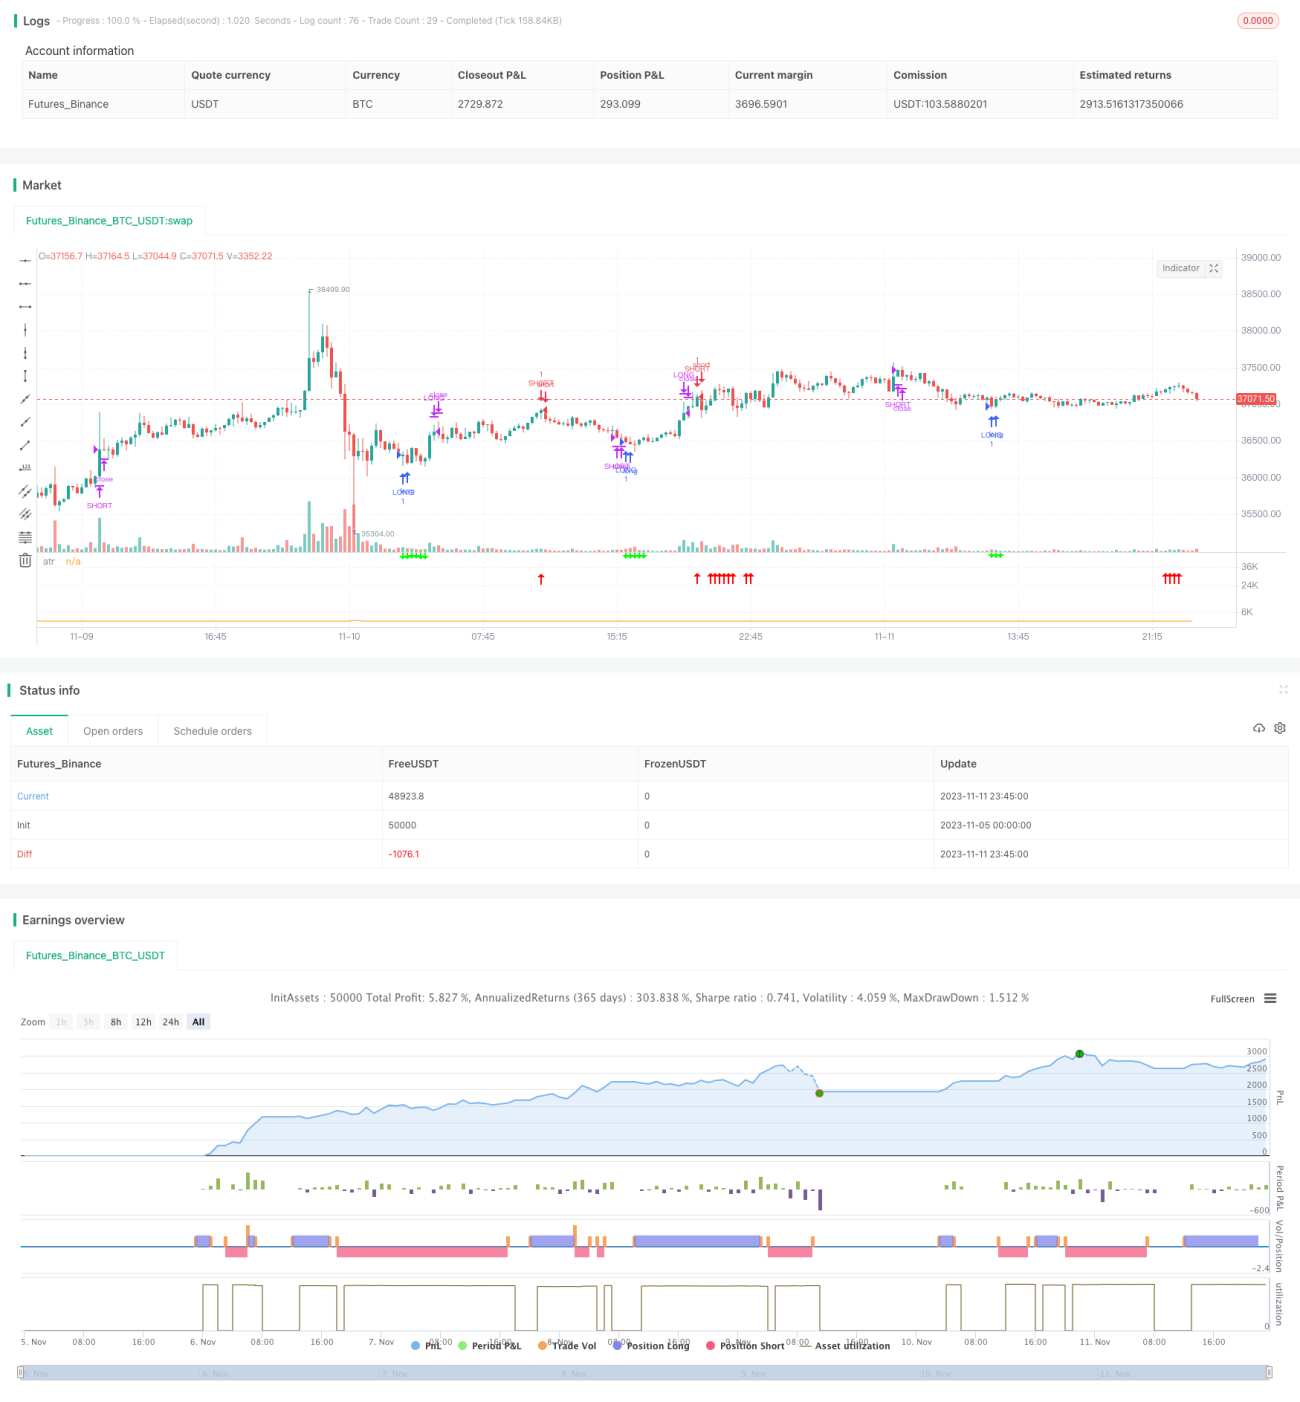
start: 2023-11-05 00:00:00
end: 2023-11-12 00:00:00
period: 15m
basePeriod: 5m
exchanges: [{"eid":"Futures_Binance","currency":"BTC_USDT"}]
*/
//written by [email protected]
//@version=5
strategy(title="MJ-Dual Moving Average",initial_capital=10000,overlay=false)
- 1