Chiến lược giao dịch động lượng hệ thống Dual Track

[trans]
Tổng quan
Chiến lược này sử dụng hai chỉ số MACD và Stoch RSI để kết hợp, xây dựng hệ thống giao dịch hai chiều, để có thể theo dõi xu hướng và đánh giá mua quá mức. Chiến lược xây dựng chỉ số trên đường mặt trời và đường 4 giờ đồng thời, để có thể đánh giá nhiều khung thời gian, giảm khả năng đánh giá sai.
Nguyên tắc chiến lược
Cấu trúc chiến lược sử dụng hai loại chỉ số kỹ thuật khác nhau là MACD và Stoch RSI để cấu hình. MACD là chỉ số chênh lệch, đánh giá tốc độ thay đổi giá; Stoch RSI là chỉ số quá mua quá bán, đánh giá giá tương đối mạnh.
Chiến lược đầu tiên là xây dựng các chỉ số MACD và Stoch RSI trên đường ngày và đường 4 giờ để phán đoán xu hướng và mua quá bán. Khi các chỉ số của hai chu kỳ thời gian phát ra tín hiệu mua / bán cùng một lúc, hãy thực hiện các hoạt động mua / bán tương ứng.
Cụ thể, việc xây dựng chỉ số MACD, đường DIF và đường DEA tạo thành các ngã ba vàng; xây dựng chỉ số Stoch RSI, đường K và đường D tạo thành ngã ba vàng. Khi hai nhóm chỉ số tạo ra tín hiệu mua khi đồng thời ngã ba vàng và đồng thời ngã ba vàng tạo ra tín hiệu bán.
Do đó, sử dụng các chỉ số hai đường và nhiều khung thời gian để đánh giá toàn diện về tốc độ thay đổi giá và sức mạnh tương đối của chiến lược, giúp tăng độ chính xác của quyết định và thu được lợi nhuận tốt hơn.
Phân tích lợi thế
Chiến lược này có một số ưu điểm:
- Kết hợp các chỉ số hai chiều để đưa ra phán đoán toàn diện và cải thiện tính chính xác của quyết định
- Sử dụng nhiều khung thời gian để giảm khả năng sai lầm
- Sử dụng theo dõi xu hướng và đánh giá quá mua quá bán, cân nhắc tổng hợp tốc độ thay đổi giá và tương đối mạnh
- Các tham số chỉ số có thể điều chỉnh để phù hợp với các giống và môi trường thị trường khác nhau
- Có cấu trúc mã rõ ràng, dễ hiểu và mở rộng
Phân tích rủi ro
Chiến lược này cũng có một số rủi ro:
- Rủi ro hệ thống trên thị trường không thể tránh được hoàn toàn
- Cài đặt tham số chỉ số không đúng có thể dẫn đến giao dịch thường xuyên hoặc bỏ lỡ cơ hội tốt
- Tỷ lệ đồng thời phát tín hiệu sai của chỉ số hai đường ray tồn tại, nhưng thấp hơn chỉ số đơn
- Không thể đối phó với sự thay đổi đột ngột của thị trường, như sự kiện Black Swan lớn
Phản ứng:
- Tối ưu hóa các tham số, điều chỉnh các điều kiện giao dịch mua bán, giảm sai lầm
- Kết hợp với nhiều chỉ số hơn để tăng cơ sở phán đoán
- Tăng chiến lược dừng lỗ, kiểm soát rủi ro lỗ đơn
Hướng tối ưu hóa
Chính sách này cũng có thể được tối ưu hóa theo các khía cạnh sau:
- Thêm nhiều chỉ số để kết hợp, xây dựng chiến lược đa chỉ số
- Thêm các thuật toán học máy để tối ưu hóa tham số động
- Thêm một số yếu tố khác để đánh giá thị trường, bao gồm các chỉ số cảm xúc và tin tức.
- Tăng các chiến lược dừng lỗ, ngăn chặn, quản lý tài chính tối ưu
- Mở rộng phạm vi giao dịch, tìm kiếm cơ hội tốt hơn
Tóm tắt
Chiến lược này sử dụng sự kết hợp của chỉ số hai đường và đánh giá nhiều khung thời gian, đánh giá toàn diện về tốc độ thay đổi giá cả và sức mạnh tương đối, có thể thu được xu hướng thị trường hiệu quả, cải thiện các lỗ hổng đánh giá sai của chỉ số đơn lẻ. Ngoài ra, nó cũng có các ưu điểm như điều chỉnh tham số linh hoạt, dễ hiểu và mở rộng.
||
Overview
This strategy combines the MACD and Stoch RSI indicators to build a dual-rail trading system for trend tracking and oversold/overbought judgment. The strategy also builds indicators on the daily and 4-hour timeframes to make multi-timeframe judgments to reduce misjudgment probability.
Strategy Principle
The strategy combines the MACD and Stoch RSI indicators, which are different types of technical indicators, for configuration. MACD is a momentum indicator that judges price change velocity; Stoch RSI is an overbought/oversold indicator that judges relative price strength.
The strategy first constructs the MACD and Stoch RSI indicators on the daily and 4-hour timeframes respectively for trend and overbought/oversold judgments. When signals are triggered on both timeframes, corresponding buy/sell operations are performed.
Specifically, the MACD indicator is constructed with the DIF and DEA lines forming golden/dead crosses for judgment; the Stoch RSI indicator is constructed with the K and D lines forming golden/dead crosses for judgment. When both indicator pairs have golden crosses, buy signals are generated; when both have dead crosses, sell signals are generated.
Thus, by comprehensively applying the dual-indicator system and multi-timeframe judgments, the strategy judges price velocity and relative strength thoroughly, which helps improve decision accuracy and gain better returns.
Advantage Analysis
This strategy has the following advantages:
- Combining dual-indicator system for comprehensive judgment and higher decision accuracy
- Applying multi-timeframe to reduce misjudgment probability
- Adopting trend tracking and overbought/oversold judgment for consideration of both price velocity and relative strength
- Flexible indicator parameters adjustable for different products and market environments
- Clean code structure easy to understand and expand
Risk Analysis
There are also some risks with this strategy:
- There exist systemic market risks that cannot be fully avoided
- Inappropriate indicator parameter settings may lead to overtrading or missing opportunities
- Dual indicators may still give concurrent wrong signals, but less likely than single ones
- Unable to cope with drastic market changes like black swan events
Countermeasures:
- Optimize parameters and adjust trading conditions to reduce misjudgments
- Incorporate more indicators for combined judgments
- Add stop loss mechanisms to control single loss risk
Optimization Directions
This strategy can also be improved in the following aspects:
- Incorporate more indicators for multi-indicator strategies
- Add machine learning algorithms for dynamic parameter optimization
- Combine sentiment indicators, news etc. for more comprehensive market condition judgments
- Add stop loss, take profit strategies to optimize money management
- Expand to more trading products to discover better opportunities
Conclusion
By combined application of the dual-indicator system and multi-timeframe judgments, this strategy judges price velocity and relative strength thoroughly, which can effectively capture market trends and improve deficiencies of single indicators. It also has advantages like flexible parameter tuning, easy understanding and expansion. Further expansions by multi-indicator combination, dynamic parameter optimization, sentiment indicator incorporation etc. can help boost strategy performance.
[trans]
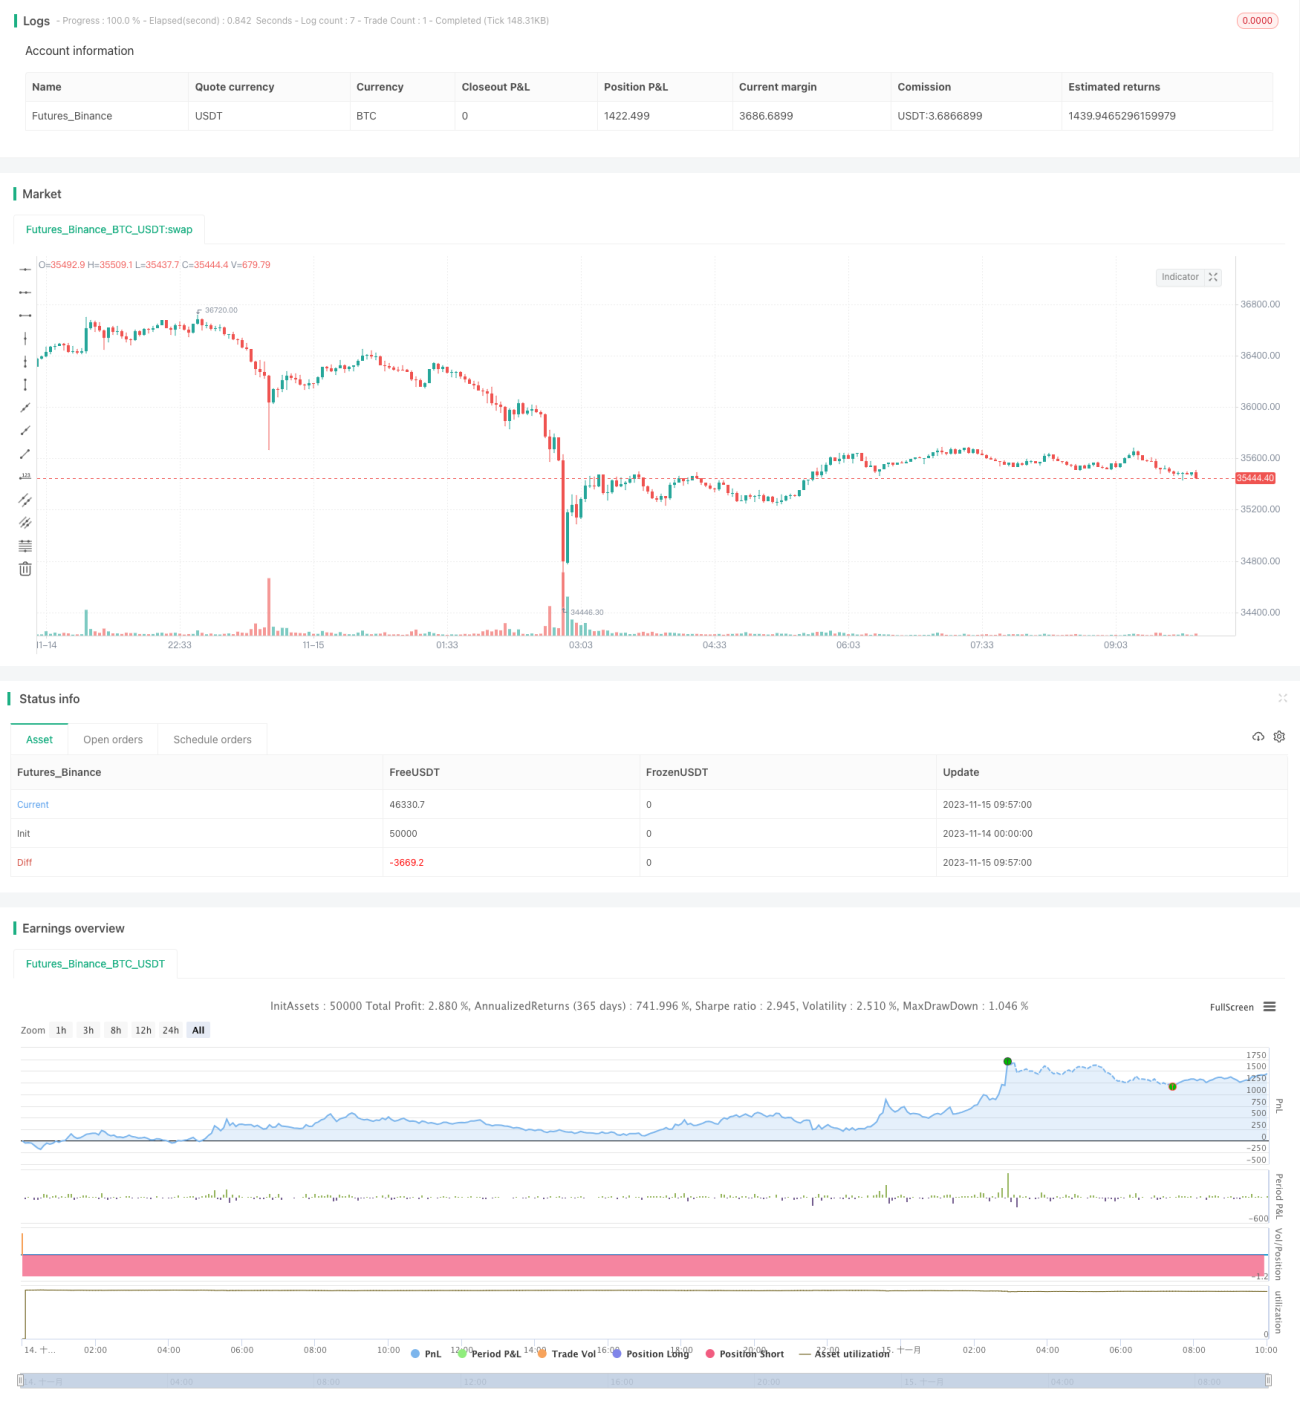
/*backtest
start: 2023-11-14 00:00:00
end: 2023-11-15 10:00:00
period: 3m
basePeriod: 1m
exchanges: [{"eid":"Futures_Binance","currency":"BTC_USDT"}]
*/

//@version=2
strategy(title='[RS]Khizon (UWTI) Strategy V0', shorttitle='K', overlay=false, pyramiding=0, initial_capital=100000, currency=currency.USD)
//  ||  Inputs:
macd_src = input(title='MACD Source:', defval=close)- 1