Chiến lược giao dịch rùa đột phá đường trung bình động lai

1
Follow
1779
Followers
Tổng quan
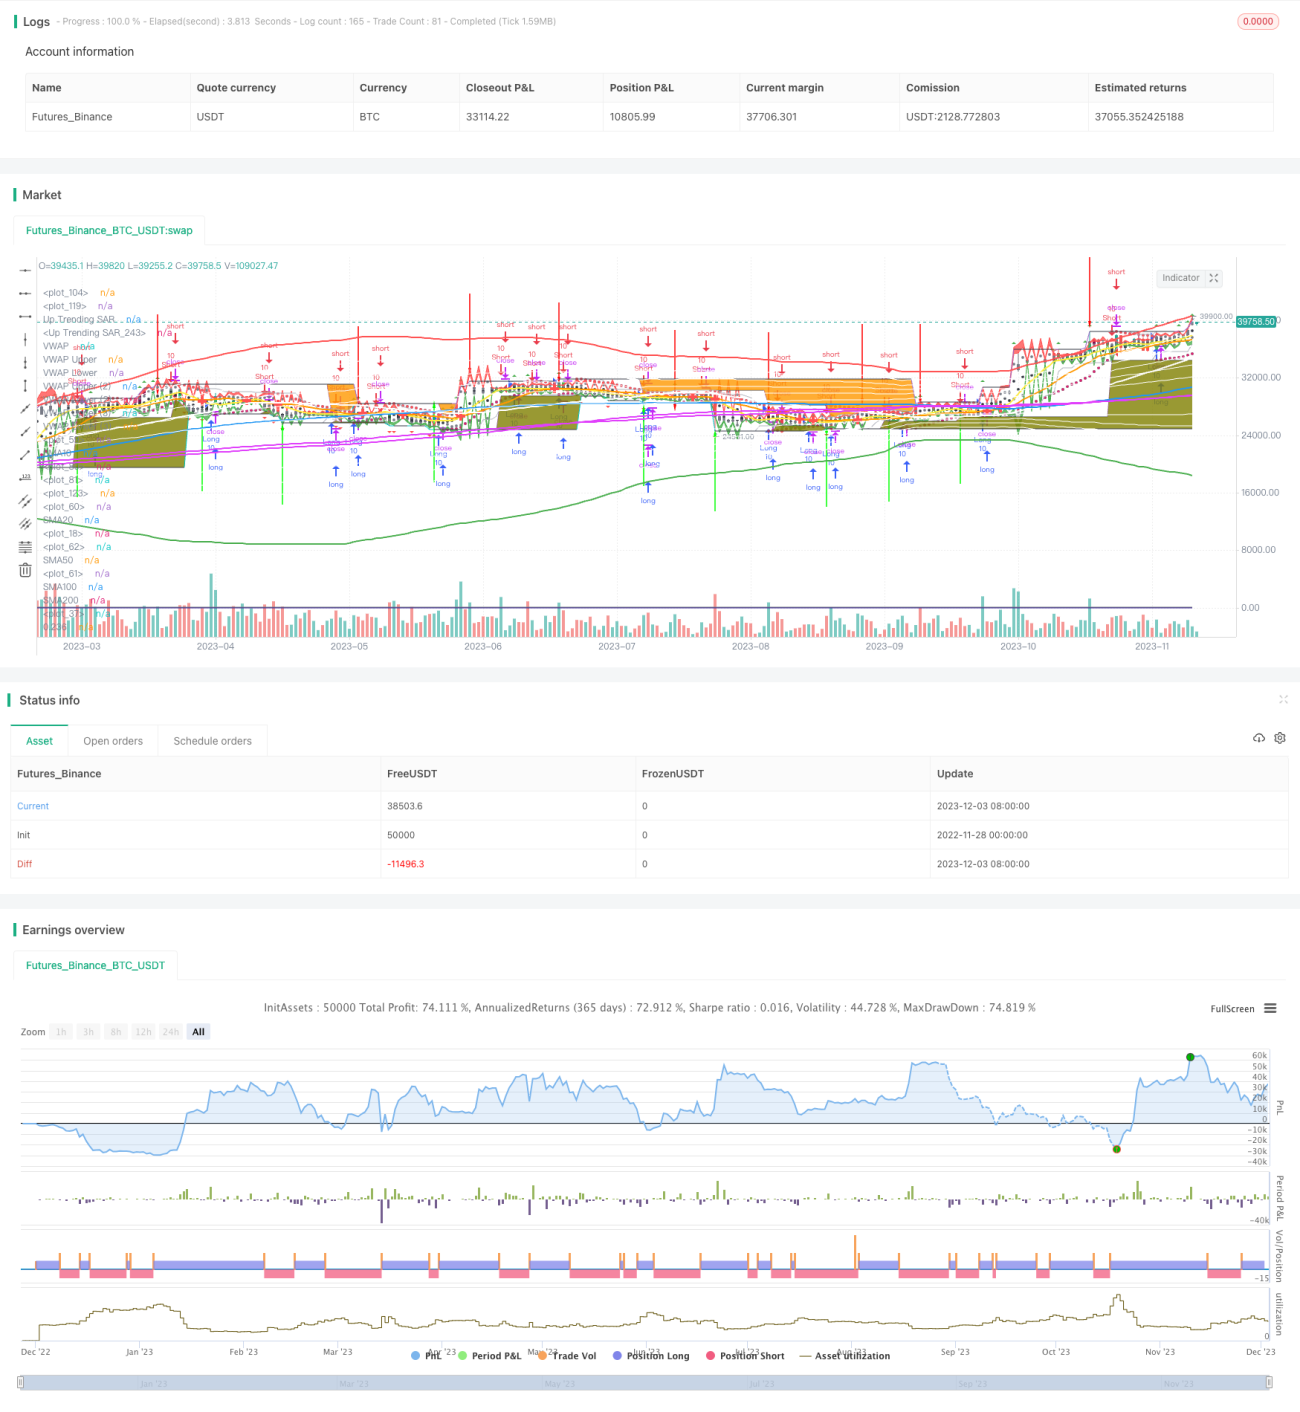
Chiến lược này kết hợp nhiều công cụ phân tích kỹ thuật như trung bình di chuyển, chỉ số biến động, giá trung bình cân đối khối lượng giao dịch (VWAP) và chỉ số dừng lỗ đường ngang, để thực hiện một chiến lược giao dịch Turtle hỗn hợp có khả năng nhận diện đột phá mạnh mẽ và bảo vệ lỗ hổng.
Nguyên tắc chiến lược
- Sử dụng sự kết hợp đường trung bình SMA của các chu kỳ khác nhau để xác định hướng xu hướng và điểm phá vỡ có thể
- Sử dụng chỉ số biến động của Binance để đánh giá tình trạng quá mua và quá bán trong ngắn hạn
- Khu vực giá cân bằng của đường dài giữa sử dụng chỉ số VWAP
- SAR đường parabola như một chỉ số dừng lỗ, giảm lỗ
- Quy tắc giao dịch Turtle tạo ra tín hiệu mua bán
Phân tích lợi thế
- Nhiều chỉ số kết hợp, phán đoán toàn diện hơn, tín hiệu chính xác hơn
- Chỉ số VWAP hỗ trợ xác định phạm vi giá hợp lý, tránh theo đuổi mù quáng
- Chỉ số dừng lỗ SAR có hiệu quả trong việc kiểm soát lỗ cho mỗi vị trí
- Luật giao dịch của Turtle đảm bảo thời gian vào vị trí phù hợp
Phân tích rủi ro
- Thiết lập tham số không đúng có thể dẫn đến tần số giao dịch quá cao hoặc hiểu sai tín hiệu
- Một cách dừng lỗ đơn lẻ có thể hạn chế cơ hội kiếm lợi nhuận
- Cần lọc các tín hiệu Turtle để tránh xung đột
Hướng tối ưu hóa
- Điều chỉnh tham số chu kỳ đường trung bình SMA để tối ưu hóa nhận dạng đột phá
- Điều chỉnh tham số biến động để Brin gần hơn với giá
- Tối ưu hóa tham số parallax, chính xác hơn
- Bộ lọc tín hiệu Turtle kết hợp với các chỉ số khác
Tóm tắt
Chiến lược này được kết hợp hữu cơ với nhiều chỉ số để tạo ra một tín hiệu giao dịch chính xác hơn, có khả năng dừng lỗ mạnh hơn và có nhiều khả năng điều chỉnh tham số. Chiến lược Turtle loại đột phá hỗn hợp. Sau khi điều chỉnh tham số thích hợp, khả năng nhận diện đột phá và bảo vệ lỗ sẽ được nâng cao, là một chiến lược giao dịch định lượng đáng được đề xuất.
Source
Pine
/*backtest
start: 2022-11-28 00:00:00
end: 2023-12-04 00:00:00
period: 1d
basePeriod: 1h
exchanges: [{"eid":"Futures_Binance","currency":"BTC_USDT"}]
*/

//@version=4
strategy("Gui's Turtle", shorttitle = "Guis Turtles", overlay=true, pyramiding=0, default_qty_value = 10)

//This script has to be used with Heikin Ashi Caddles for the strategy to work wellStrategy parameters
Related strategies
Comment
All comments (0)
No data
- 1