Giao dịch định lượng chiến lược dài hạn và ngắn hạn chính xác

Tổng quan
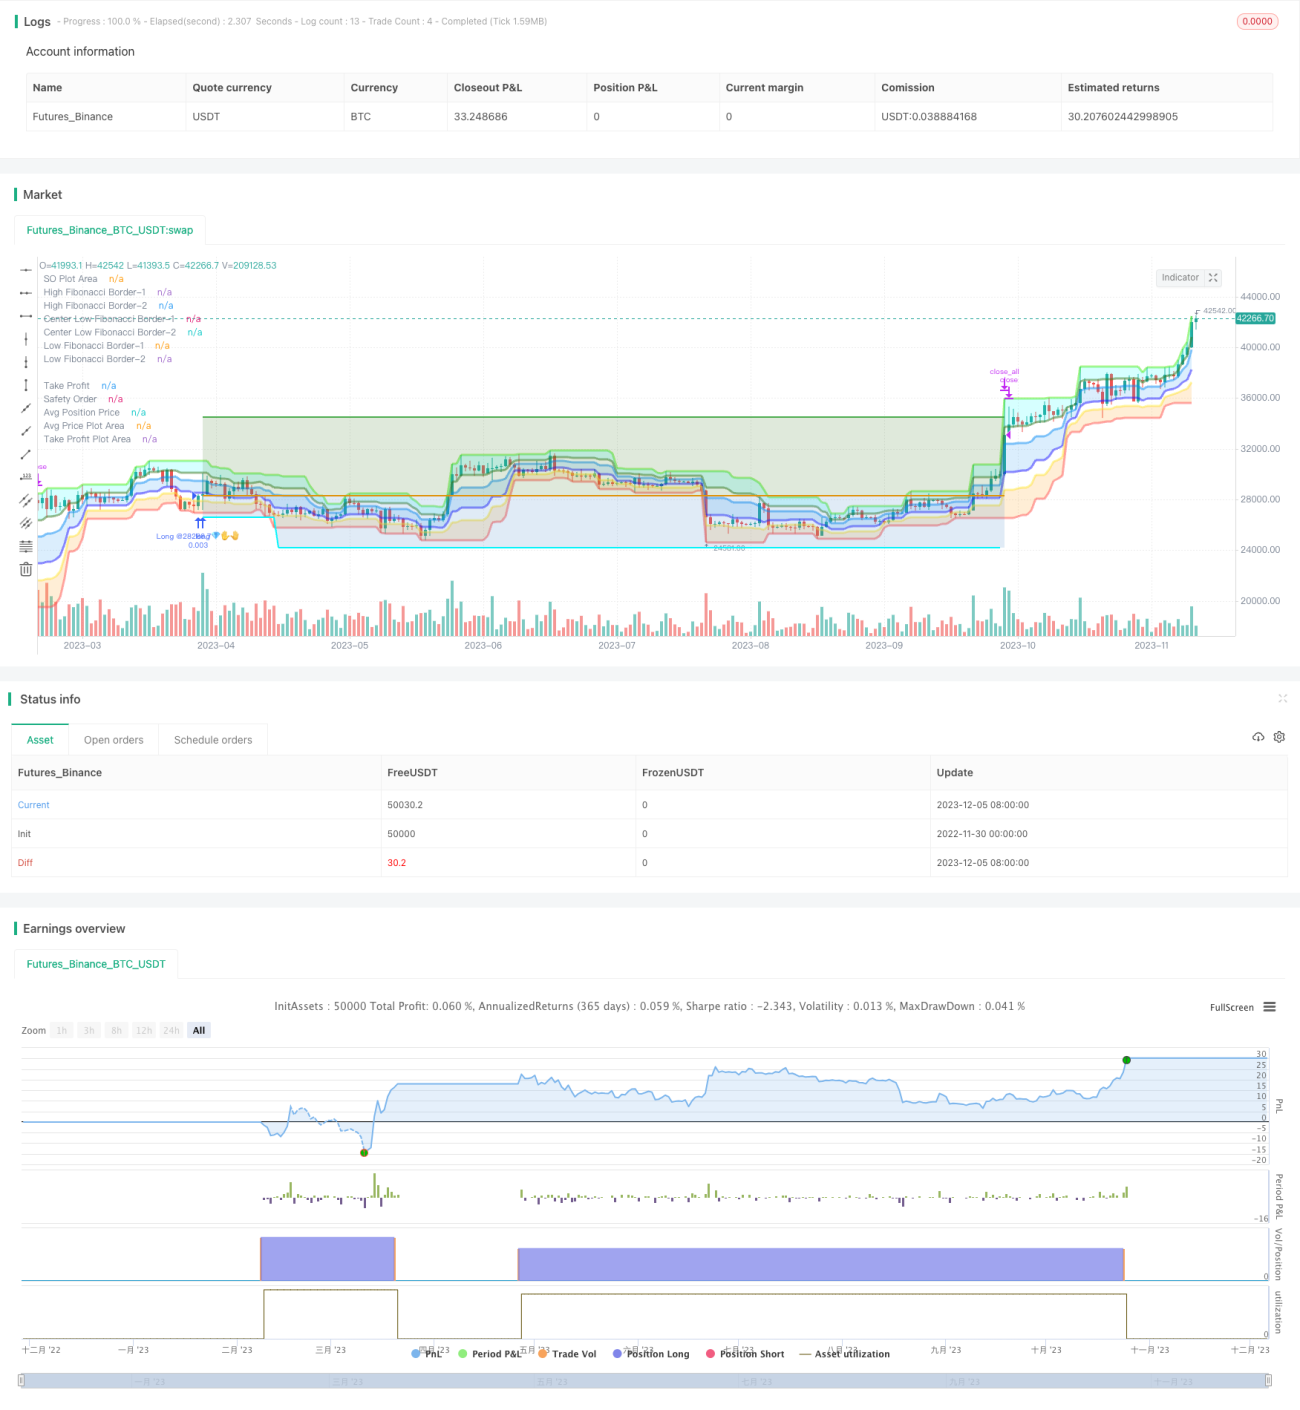
Bài viết này chủ yếu giới thiệu về một chiến lược giao dịch định lượng dựa trên kênh Brin, chỉ số ADX kết hợp với đường K để phán đoán nhiều lỗ hổng. Chiến lược này sử dụng kênh Brin để đánh giá xu hướng và biến động của thị trường, và kết hợp với chỉ số ADX để đánh giá xu hướng thị trường yếu, chọn hướng thị trường làm nhiều lỗ hổng trong xu hướng mạnh mẽ, trong trường hợp biến động, nhìn chung, tránh rủi ro tối đa.
Nguyên tắc chiến lược
-
- Phân tích xu hướng thị trường dựa trên đường dẫn trên và dưới của đường dẫn Brin. Giá ở trên đường dẫn là giao dịch nhiều đầu, ở dưới đường dẫn là giao dịch trống.
-
- Phạm vi của Brin cho thấy sự biến động và rủi ro của thị trường. Phạm vi của Brin cho thấy thị trường càng biến động, rủi ro càng lớn và nên tránh đặt hàng.
-
- Chỉ số ADX đánh giá xu hướng thị trường mạnh hoặc yếu. ADX lớn hơn 25 cho thấy xu hướng, khi đó đánh giá hướng giao dịch của Binance. ADX nhỏ hơn 25 cho thấy xu hướng dao động, nên tránh giao dịch.
-
- Sau khi quyết định thực hiện nhiều hướng nhị phân, hãy đặt mức dừng lỗ theo chỉ số ATR. ATR được sử dụng để đo lường độ biến động của thị trường, đặt khoảng cách dừng lỗ theo số nhân ATR.
-
- Ngăn chặn được thiết lập dựa trên đường ray lên xuống của Brin. Ngăn chặn đa đầu là đường ray xuống, ngăn chặn đầu rỗng là đường ray lên.
-
- Quản lý lỗ hổng giữa các điểm dừng lỗ và điểm dừng, đặt các điểm dừng di chuyển để khóa lợi nhuận.
Lợi thế chiến lược
-
Kết hợp với định hướng phán đoán của kênh Brinh và chỉ số ADX, có thể đánh giá rõ ràng về số dư và chọn lựa các vị trí để tránh giao dịch không cần thiết trong tình trạng biến động.
-
Sử dụng băng thông Brin để đánh giá rủi ro biến động, khi băng thông Brin thu hẹp thì cơ hội cao nhưng rủi ro cũng nhỏ. Tránh giao dịch khi băng thông Brin mở rộng.
-
Thiết lập ATR Stop Loss cho phép bạn kiểm soát rủi ro và tránh tối đa việc Stop Loss bị truy đuổi.
-
Theo thiết lập Brin, không có nguy cơ bị chấn động.
-
Đường dừng di động đảm bảo lợi nhuận và tiếp tục theo dõi xu hướng hoạt động.
Rủi ro chiến lược
-
Có thể có áp lực trên cả kênh Brin và chỉ số ADX. Nếu có sự lệch, có thể gây ra phán đoán sai lầm.
-
Chỉ số ATR chỉ phản ánh biến động lịch sử, không thể dự đoán biến động trong tương lai.
-
Việc phân chia khu vực của Brin là chủ quan, có thể xảy ra trường hợp bỏ lỡ cơ hội.
-
Chặn di chuyển chỉ có thể được thực hiện trong đĩa, có nguy cơ không thể di chuyển trong khoảng thời gian.
-
Rủi ro phù hợp với dữ liệu phản hồi. Các báo cáo thử nghiệm khó có thể sao chép trong thị trường thực.
Tối ưu hóa chiến lược
-
Kết hợp nhiều chỉ số hơn để có thể tin tưởng lẫn nhau, tránh các tín hiệu giả trong kênh Brin và ADX.
-
ATR dừng có thể được thêm vào nhảy vọt dừng. Hoặc sử dụng các thuật toán học sâu để dự đoán thị trường biến động thiết lập dừng.
-
Tối ưu hóa các thông số của kênh Brin để nó có thể nắm lấy các cơ hội thị trường lớn hơn.
-
Sử dụng hệ thống giao dịch lập trình hiệu quả hơn để thực hiện dừng lỗ di động không người giám sát.
-
Thử nghiệm lại trong một chu kỳ thời gian dài hơn và với nhiều kết hợp giống hơn để đảm bảo sự ổn định của chiến lược.
Tóm tắt
Chiến lược này tích hợp nhiều tín hiệu chỉ số như kênh Brin, chỉ số ADX, đặt vị trí chọn lọc sau khi xác định hướng xu hướng rõ ràng, và sử dụng chỉ số ATR để tối ưu hóa thiết lập dừng lỗ, kiểm soát tối đa rủi ro và tỷ lệ lợi nhuận, là một chiến lược giao dịch định lượng đáng được đề xuất. Chúng tôi thấy có nhiều không gian để tối ưu hóa chiến lược này và mong đợi các phiên bản nhân hóa trong tương lai.
/*backtest
start: 2022-11-30 00:00:00
end: 2023-12-06 00:00:00
period: 1d
basePeriod: 1h
exchanges: [{"eid":"Futures_Binance","currency":"BTC_USDT"}]
*/

// © Fibonacci Zone DCA Strategy - R3c0nTrader ver 2022-06-12
// For backtesting with 3Commas DCA Bot settings
// Thank you "eykpunter" for granting me permission to use "Fibonacci Zones" to create this strategy
// Thank you "junyou0424" for granting me permission to use "DCA Bot with SuperTrend Emulator" which I used for adding bot inputs, calculations, and strategy- 1