
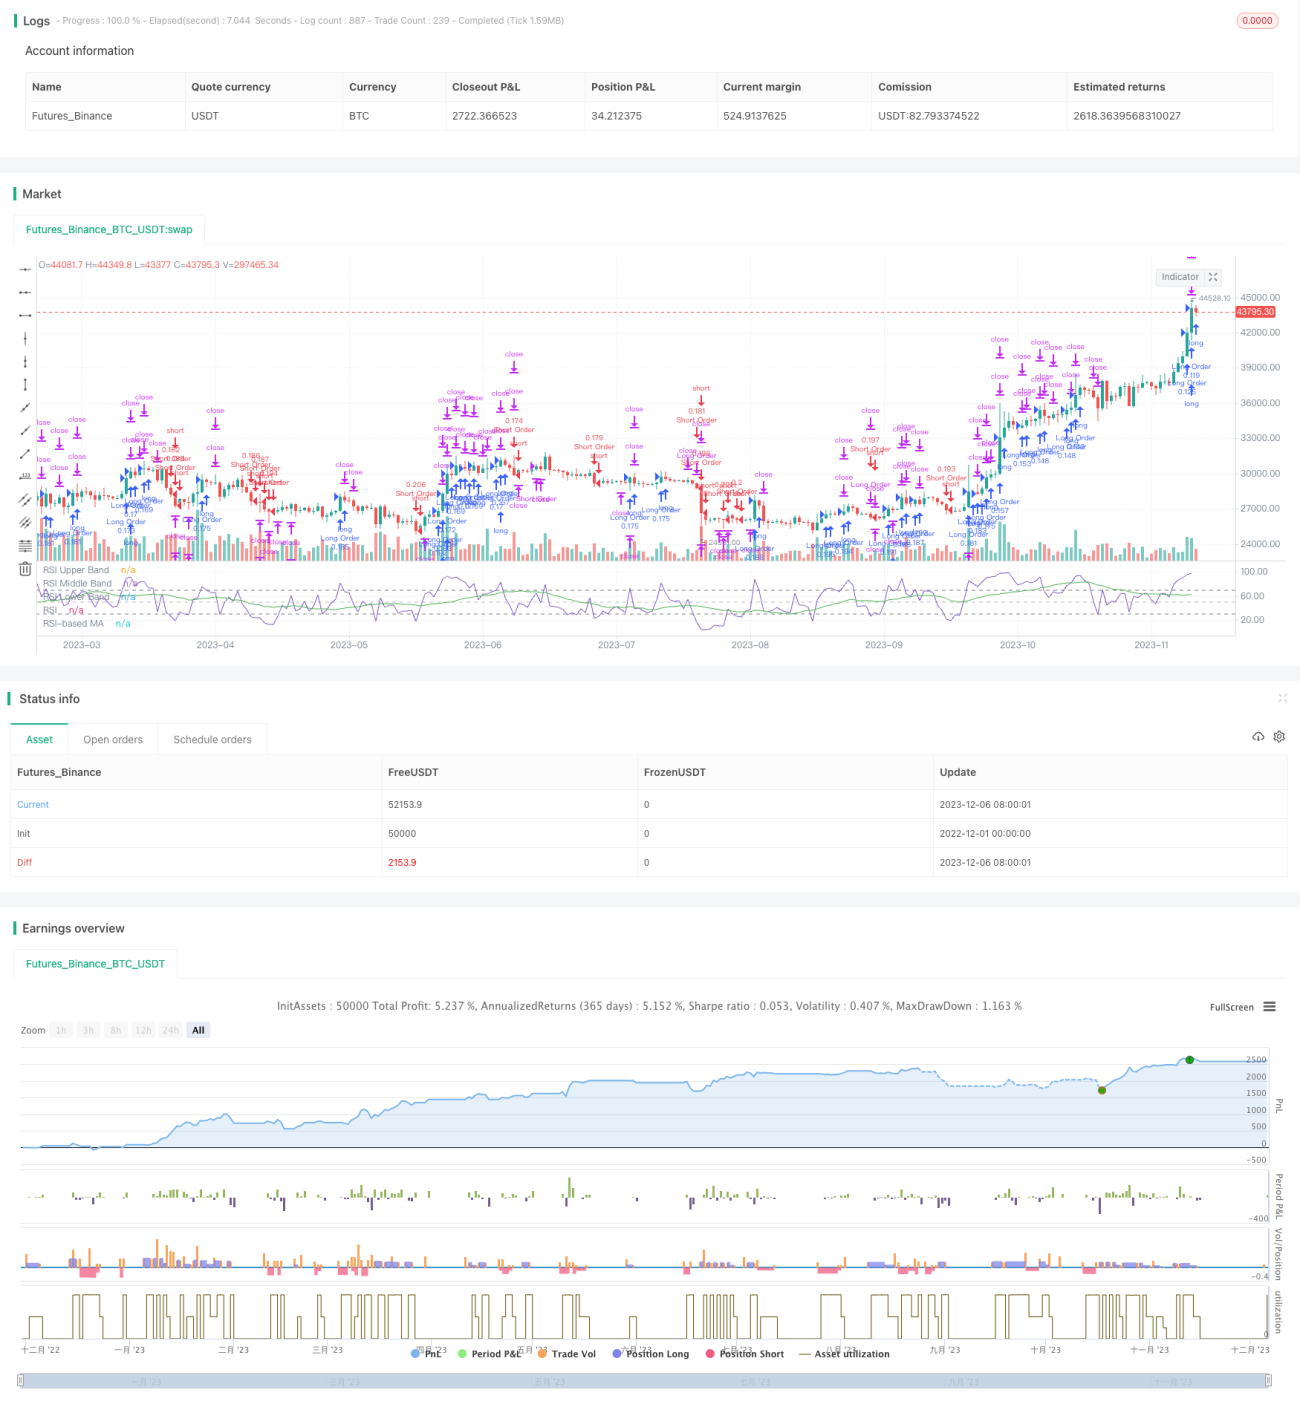
Chiến lược này là một chiến lược giao dịch tự động sử dụng chỉ số RSI để xác định xu hướng và kết hợp với đường trung bình di chuyển để xác nhận xu hướng, thiết lập điểm dừng lỗ. Khi RSI lớn hơn 68 và trên đường trung bình di chuyển hiện tại, hãy làm nhiều; khi RSI nhỏ hơn 28 và trên đường trung bình di chuyển hiện tại, hãy làm trống.
Chiến lược này chủ yếu sử dụng chỉ số RSI để xác định xu hướng quá mua và quá bán. RSI lớn hơn 70 là khu vực quá mua và nhỏ hơn 30 là khu vực quá bán.
Tín hiệu đa đầu: RSI lớn hơn 68 và trên đường trung bình di chuyển hiện tại trước đường trung bình di chuyển, làm nhiều hơn. Tín hiệu đầu trống: RSI nhỏ hơn 28 và đi dưới đường trung bình di chuyển hiện tại trước khi đi ngang.
Cài đặt dừng lỗ cho mỗi điểm đặt tỷ lệ dừng lỗ khác nhau, từ thoải mái hơn đến nghiêm ngặt hơn, cụ thể là:
Multihead Stop: 1,4% stop bán một nửa vị trí tại điểm cao, 0,8% stop bán toàn bộ vị trí tại điểm cao. Hạn chế nhiều đầu: 2% giá vé.
Ngăn chặn đầu không: 0.4% ở mức thấp dừng một nửa vị trí, 0.8% ở mức thấp dừng toàn bộ vị trí.
Hạn chế đầu rỗng: 2% giá vé.
Trong khi đó, khi xu hướng đảo ngược, ví dụ như làm nhiều khi RSI phá vỡ 30 thì giá thị trường sẽ hoàn toàn bằng phẳng; khi RSI phá vỡ 60 thì giá thị trường sẽ hoàn toàn bằng phẳng.
Đối với các rủi ro trên, các tham số phải được thử nghiệm nhiều lần. Cài đặt trạm dừng lỗ phải phù hợp, nới lỏng một khoảng nhất định và điều chỉnh tham số tùy theo biến động của thị trường. Chiến lược thanh toán phải thận trọng để tránh thiệt hại do đánh giá sai về chỉ số.
Có thể tối ưu hóa hơn nữa bằng cách:
Chiến lược tổng thể là một chiến lược theo dõi xu hướng đáng tin cậy hơn. Sử dụng RSI để đánh giá quá mua quá bán để xác định hướng giao dịch. Sử dụng trung bình di chuyển để xác nhận sóng. Đồng thời thiết lập các điểm dừng và dừng đà thích hợp. Có thể nhận được lợi nhuận tốt hơn trong xu hướng.
// © CRabbit
//@version=5
// Starting with $100 and using 10% of the account per trade
strategy("RSI Template", shorttitle="RSI", overlay=false, initial_capital=100, default_qty_value=10, default_qty_type=strategy.percent_of_equity)
// RSI Indicator
ma(source, length, type) =>
switch type
"SMA" => ta.sma(source, length)
"Bollinger Bands" => ta.sma(source, length)
"EMA" => ta.ema(source, length)
"SMMA (RMA)" => ta.rma(source, length)
"WMA" => ta.wma(source, length)
"VWMA" => ta.vwma(source, length)
rsiLengthInput = input.int(4, minval=1, title="RSI Length", group="RSI Settings")
rsiSourceInput = input.source(close, "Source", group="RSI Settings")
maTypeInput = input.string("SMA", title="MA Type", options=["SMA", "Bollinger Bands", "EMA", "SMMA (RMA)", "WMA", "VWMA"], group="MA Settings")
maLengthInput = input.int(23, title="MA Length", group="MA Settings")
bbMultInput = input.float(2.0, minval=0.001, maxval=50, title="BB StdDev", group="MA Settings")
up = ta.rma(math.max(ta.change(rsiSourceInput), 0), rsiLengthInput)
down = ta.rma(-math.min(ta.change(rsiSourceInput), 0), rsiLengthInput)
rsi = down == 0 ? 100 : up == 0 ? 0 : 100 - (100 / (1 + up / down))
rsiMA = ma(rsi, maLengthInput, maTypeInput)
isBB = maTypeInput == "Bollinger Bands"
plot(rsi, "RSI", color=#7E57C2)
plot(rsiMA, "RSI-based MA", color=color.green)
rsiUpperBand = hline(70, "RSI Upper Band", color=#787B86)
hline(50, "RSI Middle Band", color=color.new(#787B86, 50))
rsiLowerBand = hline(30, "RSI Lower Band", color=#787B86)
fill(rsiUpperBand, rsiLowerBand, color=color.rgb(126, 87, 194, 90), title="RSI Background Fill")
// Configure backtest start date with inputs
startDate = input.int(title="Start Date", defval=1, minval=1, maxval=31)
startMonth = input.int(title="Start Month", defval=6, minval=1, maxval=12)
startYear = input.int(title="Start Year", defval=2022, minval=1800, maxval=2100)
// See if this bar's time happened on/after start date
afterStartDate = (time >= timestamp(syminfo.timezone,
startYear, startMonth, startDate, 0, 0))
// Long and Short buy strategy
// Submit a market open/ close Long order, but only on/after start date
if (afterStartDate)
if rsi > 68 and (rsiMA > rsiMA[1])
strategy.entry("Long Order", strategy.long, comment="ENTER-LONG")
if rsi < 30
strategy.close("Long Order", alert_message="L-CL")
strategy.exit("L-TP1", from_entry="Long Order", limit=high * 1.004, qty_percent=50, alert_message="L-TP1" + str.tostring(high * 1.004))
strategy.exit("L-TP2", from_entry="Long Order", limit=high * 1.008, qty_percent=100, alert_message="L-TP2" + str.tostring(high * 1.008))
strategy.exit("Exit Long", from_entry="Long Order", stop=low * 0.98, alert_message="L-SL" + str.tostring(low * 0.98))
// Submit a market Open/ Close Short order, but only on/after start date
if (afterStartDate)
if rsi < 28 and (rsiMA < rsiMA[1])
strategy.entry("Short Order", strategy.short, comment="ENTER-SHORT")
if rsi > 60
strategy.close("Short Order", alert_message="S-CL")
strategy.exit("S-TP1", from_entry="Short Order", limit=low * 0.996, qty_percent=50, alert_message="S-TP1" + str.tostring(low * 0.996))
strategy.exit("S-TP2", from_entry="Short Order", limit=low * 0.992, qty_percent=100, alert_message="S-TP2" + str.tostring(low * 0.992))
strategy.exit("Exit Short", from_entry="Short Order", stop=high * 1.02, alert_message="S-SL" + str.tostring(high * 1.02))
// MONTHLY TABLE //
prec = input(2, title = "Return Precision")
new_month = month(time) != month(time[1])
new_year = year(time) != year(time[1])
eq = strategy.equity
bar_pnl = eq / eq[1] - 1
cur_month_pnl = 0.0
cur_year_pnl = 0.0
// Current Monthly P&L
cur_month_pnl := new_month ? 0.0 :
(1 + cur_month_pnl[1]) * (1 + bar_pnl) - 1
// Current Yearly P&L
cur_year_pnl := new_year ? 0.0 :
(1 + cur_year_pnl[1]) * (1 + bar_pnl) - 1
// Arrays to store Yearly and Monthly P&Ls
var month_pnl = array.new_float(0)
var month_time = array.new_int(0)
var year_pnl = array.new_float(0)
var year_time = array.new_int(0)
if (not na(cur_month_pnl[1]) and (new_month or barstate.islast))
array.push(month_pnl , cur_month_pnl[1])
array.push(month_time, time[1])
if (not na(cur_year_pnl[1]) and (new_year or barstate.islast))
array.push(year_pnl , cur_year_pnl[1])
array.push(year_time, time[1])
// Monthly P&L Table
var monthly_table = table(na)
if (barstate.islast)
monthly_table := table.new(position.bottom_right, columns = 14, rows = array.size(year_pnl) + 1, border_width = 1)
table.cell(monthly_table, 0, 0, "", bgcolor = #cccccc)
table.cell(monthly_table, 1, 0, "Jan", bgcolor = #cccccc)
table.cell(monthly_table, 2, 0, "Feb", bgcolor = #cccccc)
table.cell(monthly_table, 3, 0, "Mar", bgcolor = #cccccc)
table.cell(monthly_table, 4, 0, "Apr", bgcolor = #cccccc)
table.cell(monthly_table, 5, 0, "May", bgcolor = #cccccc)
table.cell(monthly_table, 6, 0, "Jun", bgcolor = #cccccc)
table.cell(monthly_table, 7, 0, "Jul", bgcolor = #cccccc)
table.cell(monthly_table, 8, 0, "Aug", bgcolor = #cccccc)
table.cell(monthly_table, 9, 0, "Sep", bgcolor = #cccccc)
table.cell(monthly_table, 10, 0, "Oct", bgcolor = #cccccc)
table.cell(monthly_table, 11, 0, "Nov", bgcolor = #cccccc)
table.cell(monthly_table, 12, 0, "Dec", bgcolor = #cccccc)
table.cell(monthly_table, 13, 0, "Year", bgcolor = #999999)
for yi = 0 to array.size(year_pnl) - 1
table.cell(monthly_table, 0, yi + 1, str.tostring(year(array.get(year_time, yi))), bgcolor = #cccccc)
y_color = array.get(year_pnl, yi) > 0 ? color.new(color.green, transp = 50) : color.new(color.red, transp = 50)
table.cell(monthly_table, 13, yi + 1, str.tostring(math.round(array.get(year_pnl, yi) * 100, prec)), bgcolor = y_color)
for mi = 0 to array.size(month_time) - 1
m_row = year(array.get(month_time, mi)) - year(array.get(year_time, 0)) + 1
m_col = month(array.get(month_time, mi))
m_color = array.get(month_pnl, mi) > 0 ? color.new(color.green, transp = 70) : color.new(color.red, transp = 70)
table.cell(monthly_table, m_col, m_row, str.tostring(math.round(array.get(month_pnl, mi) * 100, prec)), bgcolor = m_color)