Chiến lược đột phá đường trung bình động Bollinger band

1
Follow
1779
Followers
Tổng quan
Chiến lược này kết hợp các chỉ số đường trung bình di chuyển, chỉ số Brin và chỉ số UT Bot Alerts để thực hiện một chiến lược hoạt động đột phá đơn giản. Khi giá vượt qua đường dây Brin, hãy làm nhiều hơn; Khi giá vượt qua đường dây Brin, hãy bỏ đi.
Nguyên tắc chiến lược
- Sử dụng EMA 200 chu kỳ như là trục trung tâm để đánh giá xu hướng. Giá trên EMA là giá lên và giá dưới EMA là giá xuống.
- Chỉ số UT Bot Alerts kết hợp với ATR, tạo ra tín hiệu mua và bán. Đánh dấu đa được tạo ra khi giá và EMA giao thoa nhanh bị đẩy lên đường và tín hiệu ngắn khi giá và EMA giao thoa nhanh bị đẩy xuống đường.
- Chỉ số dừng ATR được sử dụng để thiết lập điểm dừng. Khoảng cách dừng là 1,5 lần giá trị ATR.
- Sau khi vào thị trường, hãy đặt điểm dừng lỗ, điểm dừng và điểm dừng để chuyển sang giá vào thị trường.
Phân tích lợi thế
- Sử dụng chỉ số BRI để xác định thời điểm thích hợp để thực hiện nhiều giao dịch, bạn có thể tăng tỷ lệ lợi nhuận.
- Chỉ số UT Bot Alerts có thể tạo ra tín hiệu chính xác hơn.
- Sử dụng tỷ lệ lợi nhuận rủi ro để dừng lỗ, có thể kiểm soát rủi ro hiệu quả.
Phân tích rủi ro
- Blinking có thể tạo ra tín hiệu sai trong một thành phố bị rung động.
- ATR có sự chậm trễ, khoảng cách dừng lỗ có thể quá lớn trong giai đoạn bắt đầu của xu hướng.
- Tỷ lệ rủi ro/lợi nhuận không được thiết lập đúng cũng có thể dẫn đến quá cực đoan hoặc quá bảo thủ.
Hướng tối ưu hóa
- Bạn có thể thử sử dụng các chỉ số khác thay vì chỉ số UT Bot Alerts.
- Có thể tối ưu hóa chu kỳ và nhân của ATR để làm cho khoảng cách dừng lỗ phù hợp hơn.
- Có thể thử nghiệm các tỷ lệ lợi nhuận rủi ro khác nhau để tìm tham số tối ưu.
Tóm tắt
Chiến lược này tích hợp các ưu điểm của nhiều chỉ số, có tính thực tiễn mạnh mẽ. Bằng cách tối ưu hóa tham số, có thể trở thành một hệ thống đột phá ổn định và đáng tin cậy. Tuy nhiên, cũng cần chú ý đến việc phòng ngừa rủi ro do không hiệu quả của chỉ số và tham số không đúng.
Source
Pine
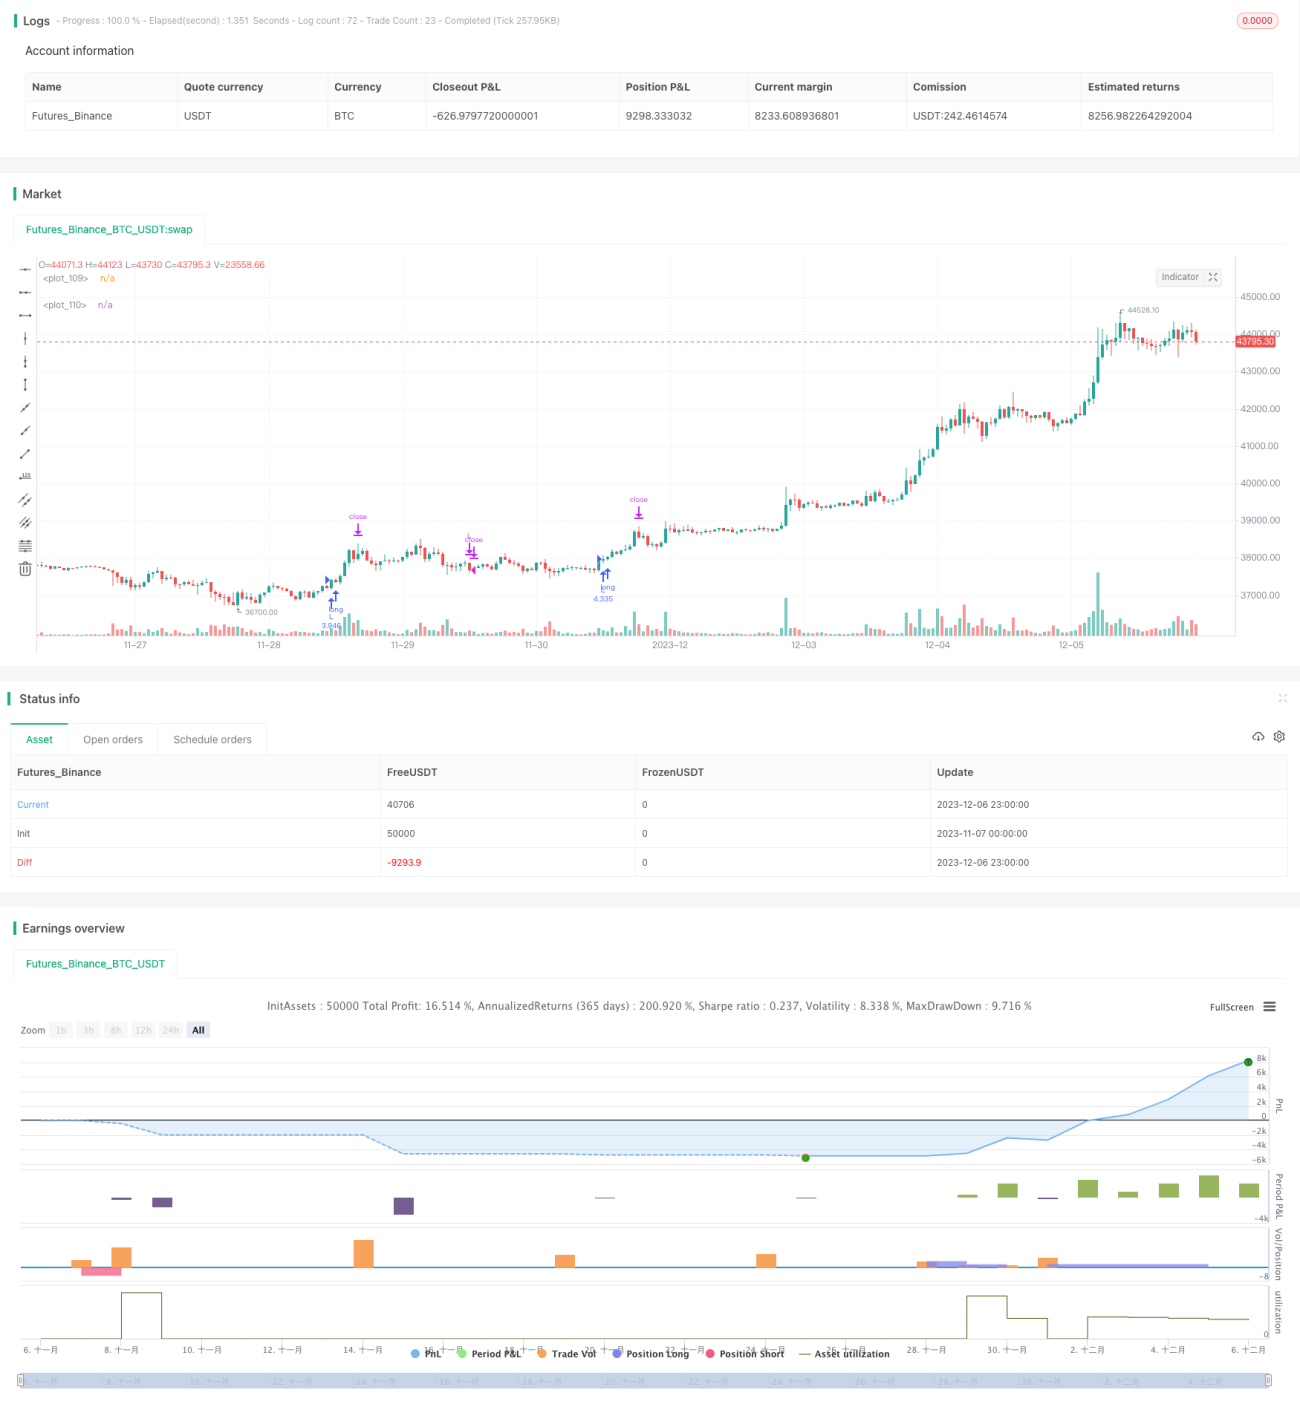
/*backtest
start: 2023-11-07 00:00:00
end: 2023-12-07 00:00:00
period: 1h
basePeriod: 15m
exchanges: [{"eid":"Futures_Binance","currency":"BTC_USDT"}]
*/

// This source code is subject to the terms of the Mozilla Public License 2.0 at https://mozilla.org/MPL/2.0/
//@version=5
//Developed by StrategiesForEveryone
Strategy parameters
Related strategies
Comment
All comments (0)
No data
- 1