Chiến lược đảo ngược xu hướng tư tưởng năng động

Tổng quan
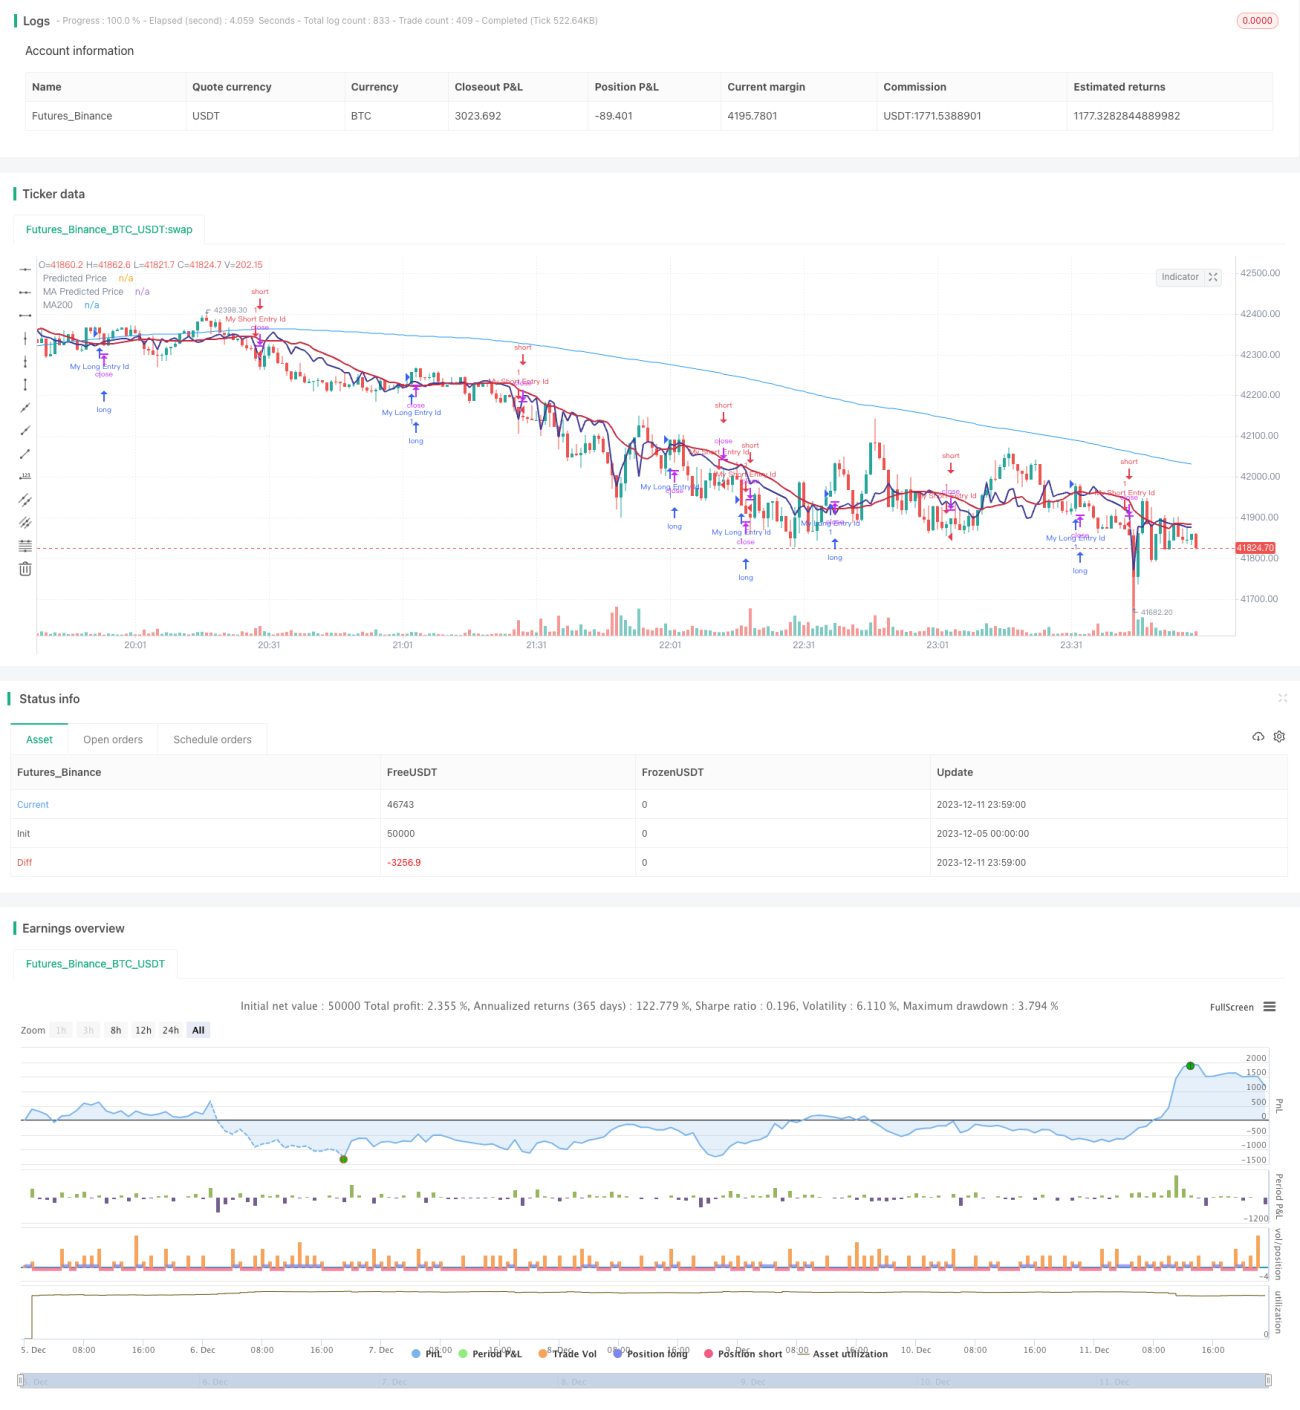
Chiến lược đảo ngược xu hướng ý thức hệ động sử dụng giá dự báo quay ngược tuyến tính và kết hợp với ý thức hệ hình thành của đường trung bình di chuyển để tạo tín hiệu giao dịch. Nó tạo ra tín hiệu mua khi giá dự báo đi qua đường trung bình di chuyển từ dưới lên; tạo ra tín hiệu bán khi giá dự báo đi qua đường trung bình di chuyển từ trên xuống, để nắm bắt sự đảo ngược xu hướng.
Nguyên tắc chiến lược
- Phản hồi tuyến tính tính giá cổ phiếu dựa trên khối lượng giao dịch, có giá dự báo
- Tính toán trung bình di chuyển trong các điều kiện khác nhau
- Một tín hiệu mua được tạo ra khi giá dự báo đi từ dưới lên qua đường trung bình di chuyển
- Một tín hiệu bán ra được tạo ra khi giá dự báo đi từ trên xuống qua đường trung bình di chuyển
- Kết hợp với MACD để đánh giá thời gian thay đổi xu hướng
Các tín hiệu trên được kết hợp với nhiều loại xác nhận, tránh đột phá giả, do đó tăng độ chính xác của tín hiệu.
Phân tích lợi thế
- Sử dụng hồi quy tuyến tính để dự đoán xu hướng giá, cải thiện độ chính xác của tín hiệu
- Kết hợp với trung bình di chuyển để tạo ra ý thức hệ, nắm bắt xu hướng đảo ngược
- Phản hồi tuyến tính dựa trên khối lượng giao dịch có ý nghĩa kinh tế hơn
- Kết hợp các chỉ số như MACD để xác nhận nhiều lần, giảm tín hiệu giả
Phân tích rủi ro
- Các thiết lập tham số của hồi quy tuyến tính có ảnh hưởng lớn đến kết quả
- Cài đặt đường trung bình di chuyển cũng ảnh hưởng đến chất lượng tín hiệu
- Có cơ chế xác nhận nhưng vẫn có nguy cơ nhận được tín hiệu sai
- Mã có thể được tối ưu hóa hơn nữa để giảm số lần giao dịch và tăng lợi nhuận
Hướng tối ưu hóa
- Các tham số để tối ưu hóa hồi quy tuyến tính và trung bình di chuyển
- Tăng điều kiện xác nhận, giảm tỷ lệ tín hiệu giả
- Kết hợp nhiều yếu tố để đánh giá xu hướng đảo ngược chất lượng
- Tối ưu hóa chiến lược dừng lỗ, giảm rủi ro giao dịch đơn lẻ
Tóm tắt
Chiến lược đảo ngược xu hướng của ý thức hệ động tích hợp dự đoán hồi quy tuyến tính và hình thành đường trung bình di chuyển để nắm bắt thời gian đảo ngược xu hướng. Nó có độ tin cậy cao hơn so với chỉ số đơn lẻ. Đồng thời, chiến lược có thể nâng cao hơn nữa chất lượng tín hiệu và mức lợi nhuận bằng cách điều chỉnh tham số và tối ưu hóa điều kiện xác nhận.
/*backtest
start: 2023-12-05 00:00:00
end: 2023-12-12 00:00:00
period: 1m
basePeriod: 1m
exchanges: [{"eid":"Futures_Binance","currency":"BTC_USDT"}]
*/

// This source code is subject to the terms of the Mozilla Public License 2.0 at https://mozilla.org/MPL/2.0/
// © stocktechbot
//@version=5
strategy("Linear Cross", overlay=true, margin_long=100, margin_short=0)- 1