Chiến lược dừng lỗ theo xu hướng siêu việt

Tổng quan
Chiến lược này dựa trên chỉ số siêu xu hướng và theo dõi dừng để mở vị trí hòa bình. Nó sử dụng 4 báo động để mở vị trí hòa bình và sử dụng chiến lược siêu xu hướng. Chiến lược này được thiết kế đặc biệt cho robot và có chức năng theo dõi dừng.
Nguyên tắc chiến lược
Chiến lược này sử dụng chỉ số ATR để tính toán đường lên và đường xuống. Khi giá đóng cửa phá vỡ đường lên, nó tạo ra tín hiệu mua, và khi phá vỡ đường xuống, nó tạo ra tín hiệu bán. Chiến lược cũng sử dụng đường xu hướng siêu để xác định hướng xu hướng. Khi đường xu hướng siêu đi, nó cho thấy thị trường bò bắt đầu; khi đường xu hướng siêu đi, nó cho thấy thị trường gấu bắt đầu.
Phân tích lợi thế
Chiến lược này kết hợp các ưu điểm của chỉ số siêu xu hướng để xác định hướng xu hướng và chỉ số ATR để thiết lập dừng lỗ, có thể lọc hiệu quả các phá vỡ giả. Theo dõi dừng lỗ có thể rất tốt để khóa lợi nhuận và giảm rút lui. Ngoài ra, chiến lược được thiết kế đặc biệt cho robot, có thể tự động hóa giao dịch.
Phân tích rủi ro
Chỉ số siêu xu hướng dễ tạo ra nhiều tín hiệu sai. Khi giá dừng điều chỉnh lớn, nó sẽ làm tăng khả năng phá vỡ lệnh dừng. Ngoài ra, giao dịch robot cũng phải đối mặt với các rủi ro kỹ thuật như máy chủ sụp đổ, gián đoạn mạng.
Để giảm khả năng tín hiệu sai, bạn có thể điều chỉnh tham số ATR thích hợp hoặc thêm các chỉ số khác để lọc. Cần cân bằng lợi nhuận và rủi ro khi điều chỉnh độ dài theo dõi dừng lỗ. Đồng thời, hãy chuẩn bị các máy chủ và mạng dự phòng để phòng ngừa rủi ro lỗi kỹ thuật.
Hướng tối ưu hóa
Chiến lược này có thể được tối ưu hóa ở một số khía cạnh:
-
Thêm các chỉ số hoặc điều kiện để lọc tín hiệu nhập cảnh, tránh tín hiệu sai. Ví dụ: có thể thêm chỉ số MACD.
-
Có thể thử nghiệm các kết hợp khác nhau của tham số ATR để tìm tham số tối ưu.
-
Có thể tối ưu hóa theo dõi mức độ dừng để tìm điểm cân bằng tốt nhất.
-
Bạn có thể thêm giá dừng lỗ để thực hiện dừng lỗ theo lô.
-
Có thể xây dựng kiến trúc máy chủ dự phòng đôi để chuyển đổi nhanh chóng khi máy chủ chính bị hỏng.
Tóm tắt
Chiến lược này tích hợp các lợi thế của chỉ số vượt quá xu hướng và theo dõi dừng lỗ, có thể tự động mở vị trí và dừng lỗ. Các biện pháp cải tiến kết hợp với hướng tối ưu hóa trong thực tế có thể trở thành một chiến lược giao dịch định lượng rất hữu ích.
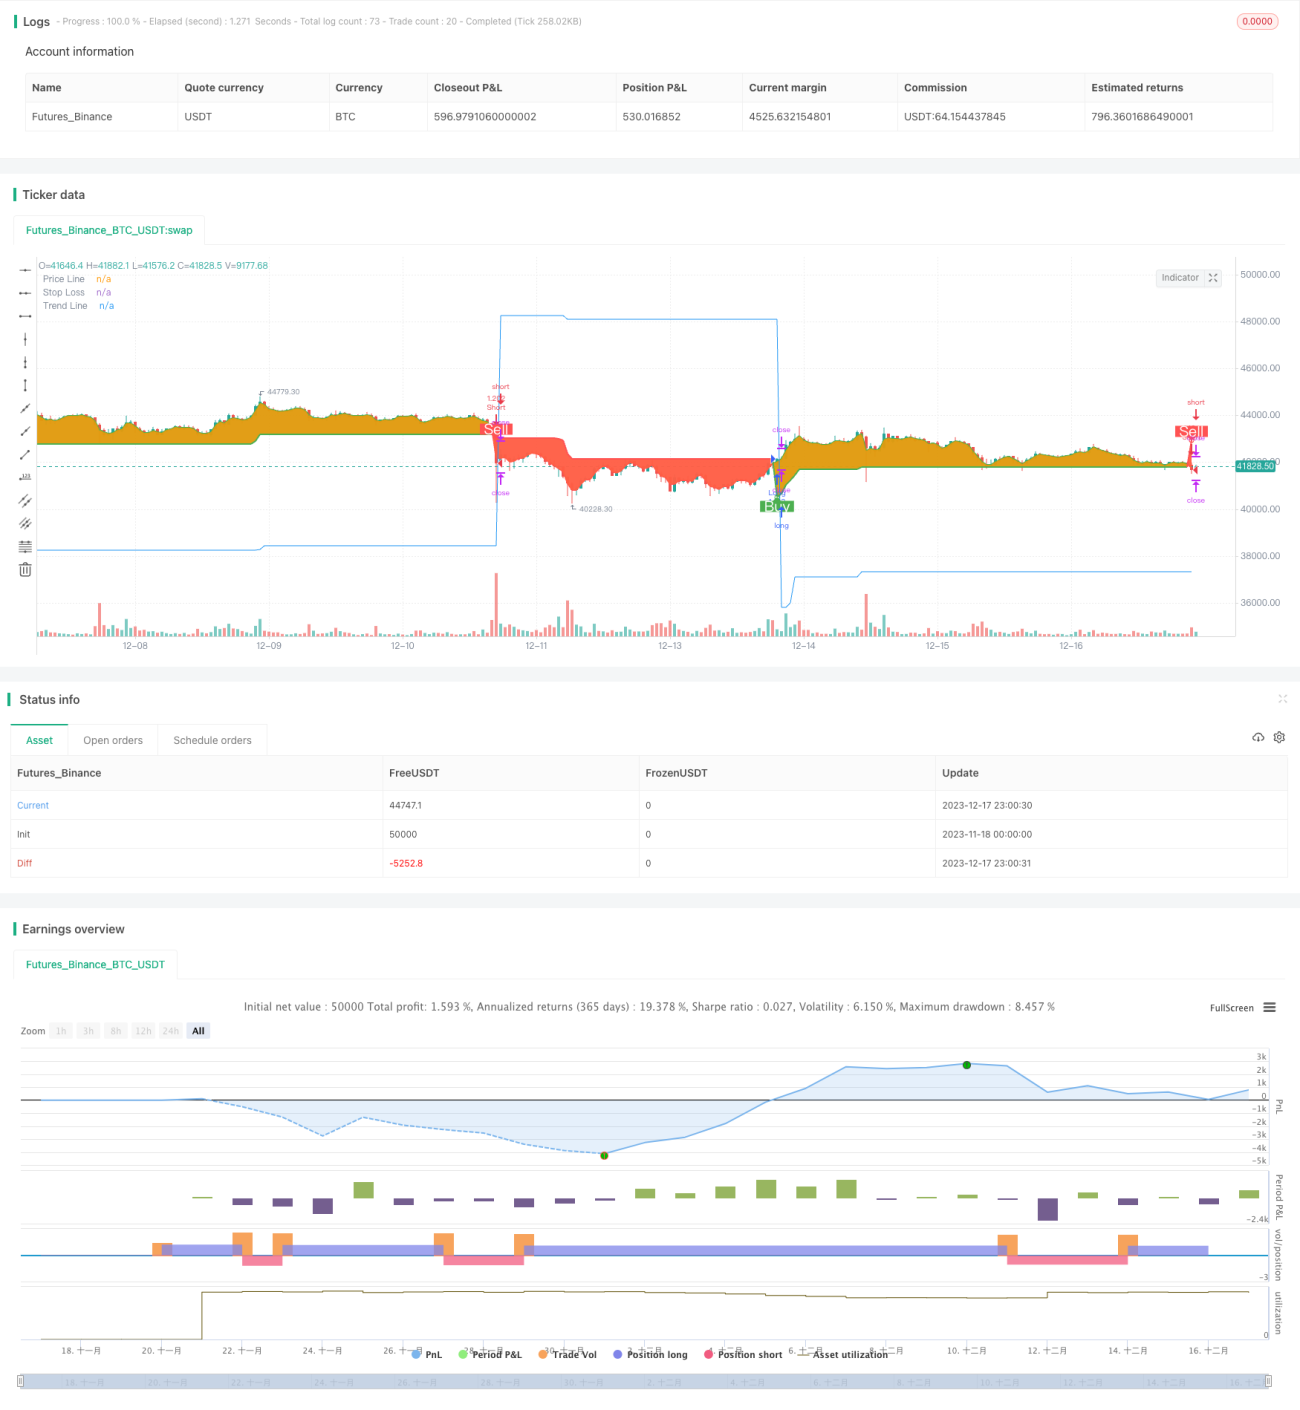
/*backtest
start: 2023-11-18 00:00:00
end: 2023-12-18 00:00:00
period: 1h
basePeriod: 15m
exchanges: [{"eid":"Futures_Binance","currency":"BTC_USDT"}]
*/

// This source code is subject to the terms of the Mozilla Public License 2.0 at https://mozilla.org/MPL/2.0/
// © arminomid1375
//@version=5
strategy('Mizar_BOT_super trend', overlay=true, default_qty_value=100, currency=currency.USD, default_qty_type=strategy.percent_of_equity, initial_capital=100, max_bars_back=4000)- 1