
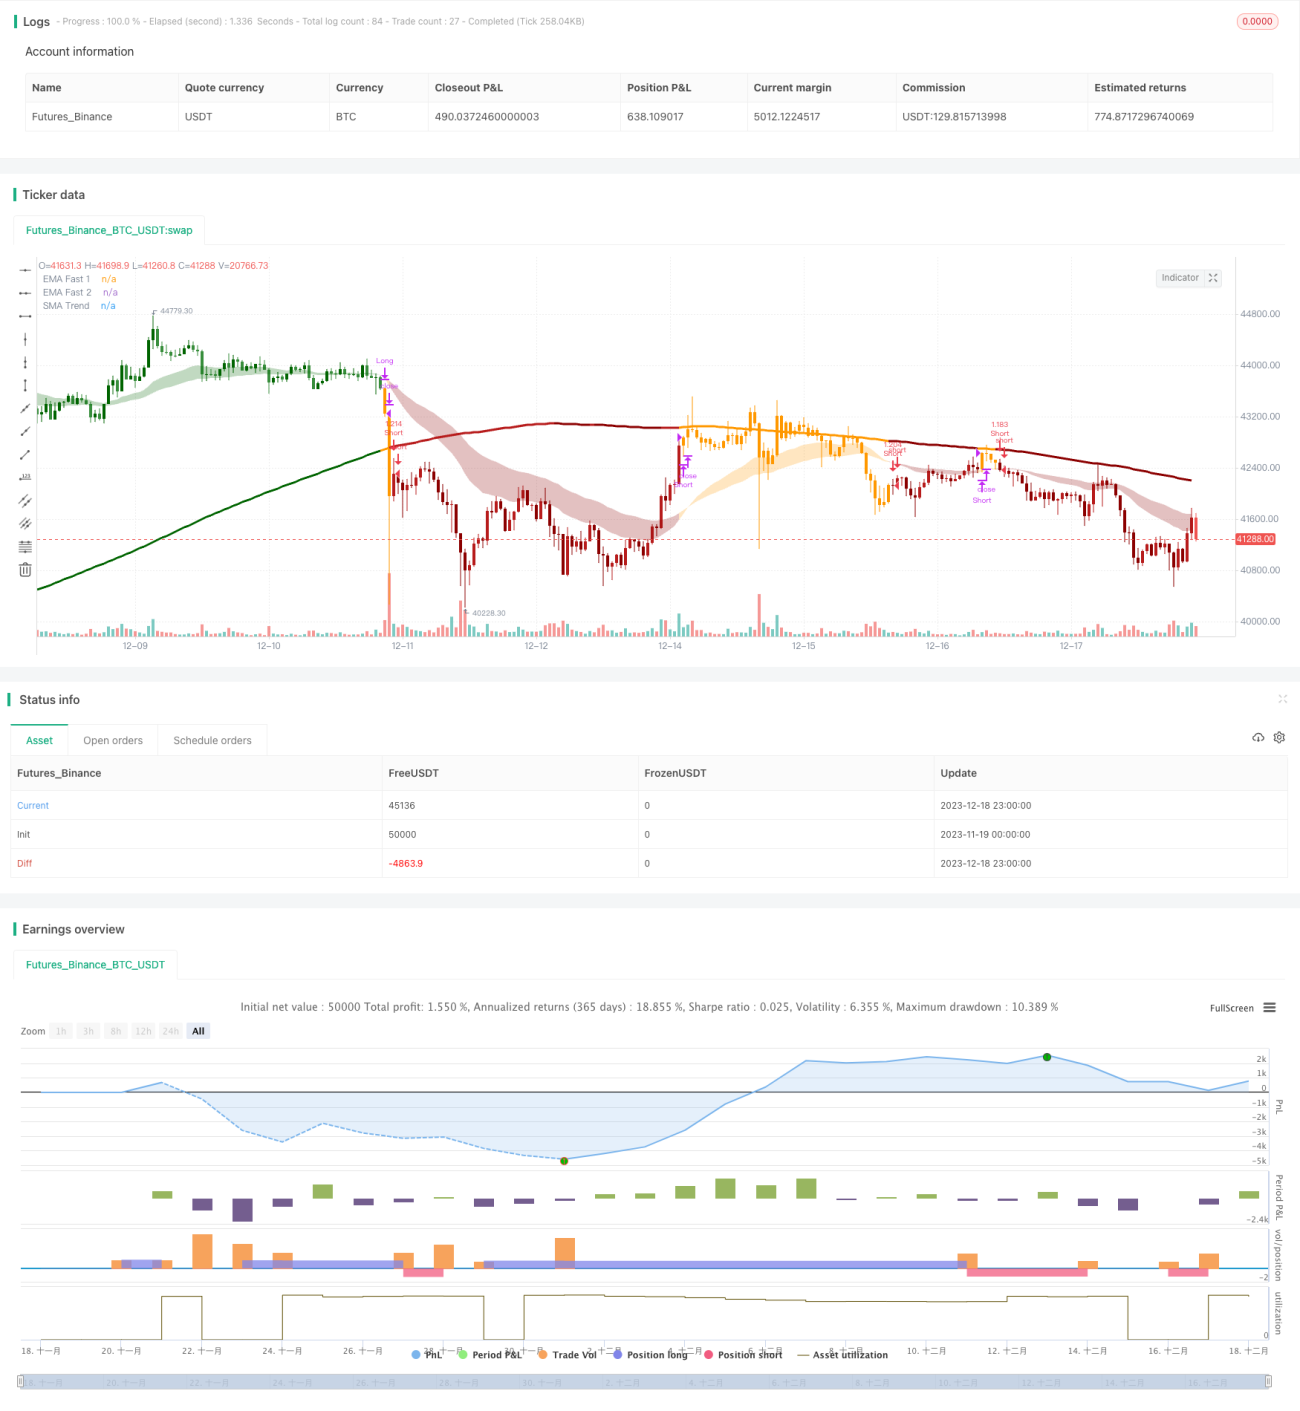
Chiến lược này xác định hướng xu hướng và giao dịch bằng cách kết hợp hai chỉ số. Đầu tiên, nó sử dụng chéo của hai đường trung bình di chuyển (đường nhanh và đường trung bình) để đánh giá xu hướng ngắn hạn; thứ hai, nó sử dụng phạm vi kênh và đường trung bình di chuyển dài hạn để đánh giá hướng xu hướng chính. Chỉ khi hai kết quả đánh giá phù hợp, tín hiệu giao dịch sẽ được tạo ra.
Chiến lược này sử dụng ba nhóm chỉ số để đánh giá. Đầu tiên, đường nhanh EMA ((26 chu kỳ) và đường trung bình EMA ((50 chu kỳ) để đánh giá xu hướng ngắn hạn; tiếp theo, tính toán phạm vi kênh để đánh giá liệu giá có phá vỡ phạm vi đó để đánh giá xu hướng trung hạn hay không; cuối cùng, tính toán đường trung bình dài SMA ((200 chu kỳ), so với giá để đánh giá hướng xu hướng chính. Chỉ khi ba kết quả đánh giá đều phù hợp, tín hiệu giao dịch sẽ được phát ra.
Theo đó, logic của phán quyết là:
Đường giao thoa giữa đường nhanh và đường trung bình (gói vàng đi lên, gót chết đi xuống) để xác định hướng xu hướng ngắn hạn.
Nếu giá phá vỡ phạm vi kênh, hướng xu hướng trung hạn sẽ được xác định. Phạm vi kênh được nhân bởi một hệ số dựa trên đường trung bình dài hạn cộng với ATR. Nếu giá phá vỡ giới hạn trên, nó sẽ là đà tăng; Nếu phá vỡ giới hạn dưới, nó sẽ là đà giảm.
So sánh giá cả và kích thước đường trung bình dài hạn để xác định xu hướng chính.
Cuối cùng, chỉ khi ba kết quả phán đoán ngắn, trung và dài đều phù hợp, tín hiệu giao dịch sẽ được phát ra. Sự phán đoán hỗn hợp này có thể lọc hiệu quả tín hiệu giả và tăng sự ổn định.
Chiến lược hỗn hợp hai chỉ số này có một số lợi thế:
Có thể lọc hiệu quả các tín hiệu giả, tăng sự ổn định. Vì tín hiệu giao dịch cần xác minh kết quả của nhiều chỉ số ngắn, trung bình và dài, do đó tránh các tín hiệu sai do chỉ số đơn lẻ.
Tính linh hoạt cao, có thể điều chỉnh các tham số chỉ số theo thị trường. Các tham số của đường trung bình và phạm vi kênh có thể được điều chỉnh để phù hợp với môi trường thị trường khác nhau.
Kết hợp giao dịch xu hướng và giao dịch phân đoạn. Chỉ số trung hạn nắm bắt xu hướng, chỉ số dài hạn xác định phân đoạn, tổng thể có lợi thế của xu hướng và chiến lược đảo ngược.
Tiết kiệm tiền sử dụng hiệu quả. Chỉ đặt hàng khi kết quả của nhiều chỉ số được đánh giá là phù hợp, bạn có thể sử dụng tiền hiệu quả và tránh giao dịch không cần thiết.
Chiến lược này cũng có một số rủi ro:
Rủi ro khi đặt tham số. Chu kỳ trung bình di chuyển và tham số phạm vi kênh cần được đặt hợp lý, nếu không đúng có thể không phát hiện được xu hướng hiệu quả hoặc gây ra quá nhiều tín hiệu sai.
Các chỉ số kép làm tăng chi phí cơ hội giao dịch. So với chiến lược chỉ số đơn, có thể bỏ lỡ một số cơ hội giao dịch, không thể vào và ra khỏi vị trí tốt nhất.
Chiến lược dừng lỗ cần thận trọng. Việc phá vỡ các cơ chế dừng lỗ trong chiến lược có thể gây ra tổn thất không cần thiết và cần thận trọng trong việc thiết lập tỷ lệ dừng lỗ.
Chiến lược này có thể không hiệu quả trong một thị trường biến động lớn. Chiến lược này phù hợp hơn với một môi trường thị trường có xu hướng rõ ràng.
Chiến lược này có thể được tối ưu hóa theo các khía cạnh sau:
Kiểm tra các kết hợp tham số khác nhau để tìm ra tham số tối ưu. Bạn có thể tìm ra thiết lập tham số tối ưu bằng cách kiểm tra dữ liệu lịch sử nhiều hơn.
Thêm cơ chế dừng lỗ thích ứng. Có thể kết hợp với chỉ số biến động để điều chỉnh động lượng dừng lỗ.
Tăng chỉ số năng lượng hỗ trợ phán đoán. Giúp xác định kích thước vị trí tại các điểm quan trọng, nâng cao hiệu quả sử dụng vốn.
Tối ưu hóa logic nhập học. Cân nhắc nhiều hơn về chiến lược Cost Average cho nhập học theo nhóm, giảm nguy cơ nhập học một lần.
Kết hợp các mô hình học máy để đánh giá. Các mô hình như mạng thần kinh được đưa vào để đánh giá sức mạnh và tính phù hợp của mô hình.
Chiến lược này có thể được cải thiện bằng nhiều cách khác nhau như tối ưu hóa tham số, tối ưu hóa dừng lỗ, kết hợp các chỉ số năng lượng định lượng. Đây là một chiến lược định lượng hỗn hợp đáng khuyên.
/*backtest
start: 2023-11-19 00:00:00
end: 2023-12-19 00:00:00
period: 1h
basePeriod: 15m
exchanges: [{"eid":"Futures_Binance","currency":"BTC_USDT"}]
*/
//@version=5
// Indicator to combines:
// Trend Channel[Gu5] (SMA 200) +
// EMA's cross (26, 50 ) +
// Golden Cross (50, 200)
// Author: @gu5tavo71 08/2019
// v2.3.6, 2022.02.18
// Trend Channel [Gu5] // Author: @gu5tavo71 08/2019
//
// This source code is subject to these terms:
// Attribution-NonCommercial 4.0 International (CC BY-NC 4.0)
// https://www.safecreative.org/work/2202190517452-mix1-ema-cross-trend-channel-gu5-
// You are free to:
// Share, copy and redistribute this script
// Adapt, transform and build on this script
// Under the following terms:
// Non-commercial: You cannot sell my indicator. You can't sell my work.
// Attribution: If you post part of my code, you must give me proper credit
//
// I am using part of this code published by @PineCoders and Public Library
// Disclaimer: I am not a financial advisor.
// For purpose educate only. Use at your own risk.
strategy(title = 'Mix1 : Ema Cross + Trend Channel [Gu5] - Backtest', shorttitle = 'Mix01', overlay = true,
initial_capital = 100,
default_qty_value = 100,
default_qty_type = strategy.percent_of_equity,
commission_value = 0.075,
commission_type = strategy.commission.percent,
format = format.price,
precision = 2,
process_orders_on_close = true)
// --------- Inputs "==============================" |
i_maSrc = input.source (close, 'MA Source' , group = 'EMAs')
i_maFast1 = input.int (26, 'EMA Fast' , group = 'EMAs')
i_maFast2 = input.int (50, 'EMA Medium' , group = 'EMAs')
i_maLen = input.int (200, 'MA Trend' , group = 'Trend Channel')
o_maLen1 = 'EMA'
o_maLen2 = 'SMA'
i_maLenSel = input.string (o_maLen2, 'MA Type' , group = 'Trend Channel',
options = [o_maLen1, o_maLen2],
tooltip = "EMA or SMA")
i_htf = input.timeframe ('', 'Select Higher Timeframe' , tooltip = 'Only for MA Trend' , group = 'Trend Channel')
i_rangeLen = input.float (0.618, 'Channel Range Length' , tooltip = 'ATR of the MA Trend', group = 'Trend Channel')
i_slOn = input.bool (false, '■ Stop Loss On/Off' , group = 'Stop Loss')
i_sl = input.float (2.618, 'SL %' , step = 0.1, group = 'Stop Loss')
i_periodSw = input.bool (true, '■ Period On/Off' , group = 'Period')
o_start = timestamp ( '2020-01-01 00:00 GMT-3' )
o_end = timestamp ( '2099-12-31 00:00 GMT-3' )
i_periodStar = input (o_start, 'Start Time' , group = 'Period')
i_periodEnd = input (o_end, 'End Time' , group = 'Period')
o_posSel1 = 'Only Long'
o_posSel2 = 'Only Short'
o_posSel3 = 'Both'
i_posSel = input.string (o_posSel3, 'Position Type' , group = 'Strategy',
options = [o_posSel1, o_posSel2, o_posSel3],
tooltip = "Only Long, Only short or Both")
o_typeS1 = 'Strategy 1'
o_typeS2 = 'Strategy 2'
i_typeS = input.string (o_typeS2, 'Strategy Type' , group = 'Strategy',
options = [o_typeS1, o_typeS2],
tooltip = "Strategy 1:\nLong, when the price (close) crosses the ema.\nStrategy 2:\nLong, only when ema goes up")
i_barColOn = input.bool (true, '■ Bar Color On/Off' , group = 'Display')
i_alertOn = input.bool (false, '■ Alert On/Off' , group = 'Display')
i_channelOn = input.bool (false, '■ Channel Range On/Off' , tooltip = 'If the price (close) is over than the channel, the trend is bullish. If the price is under, bearish. And if the price is in the channel, it is in range', group = 'Display')
i_goldenOn = input.bool (false, '■ Golden Cross On/Off' )
o_alert = '{{strategy.order.comment}}'
i_alert = input.string (o_alert, 'Setting alert' , tooltip = 'For Alerts, just copy {{strategy.order.comment}} and paste in alert window.', group = 'Display')
// --------- Calculations
maFast1 = ta.ema(i_maSrc, i_maFast1)
maFast2 = ta.ema(i_maSrc, i_maFast2)
maDir = maFast1 > maFast2 ? 1 : -1
maTrend = request.security(syminfo.tickerid, i_htf,
i_maLenSel == "SMA" ? ta.sma(close, i_maLen)[1] : ta.ema(close, i_maLen)[1],
lookahead = barmerge.lookahead_on) //No repaint
maTrendDir = i_maSrc >= maTrend ? 1 : -1
rangeAtr = ta.atr(i_maLen) * i_rangeLen
rangeTop = maTrend + rangeAtr
rangeBot = maTrend - rangeAtr
rangeCh = (open <= rangeTop or close <= rangeTop) and
(open >= rangeBot or close >= rangeBot)
trendDir = i_typeS == 'Strategy 1' ?
rangeCh ? 0 :
maTrendDir == 1 and maDir == 1 and maTrend > maFast2 ? 0 :
maTrendDir == -1 and maDir == -1 and maTrend < maFast2 ? 0 :
maTrendDir == 1 and maDir == 1 ? 1 :
maTrendDir == -1 and maDir == -1 ? -1 : 0 :
rangeCh ? 0 :
maTrendDir == 1 and maDir == 1 ? 1 :
maTrendDir == -1 and maDir == -1 ? -1 : 0
GCross = i_goldenOn ? ta.crossover (maFast2, maTrend) : na
DCross = i_goldenOn ? ta.crossunder(maFast2, maTrend) : na
period = true
// Set initial values
condition = 0.0
entryLong = trendDir == 1 and
i_posSel != 'Only Short' and
(i_periodSw ? period : true)
entryShort = trendDir == -1 and
i_posSel != 'Only Long' and
(i_periodSw ? period : true)
exitLong = (trendDir != 1 or maDir == -1) and
condition[1] == 1 and
i_posSel != 'Only Short' and
(i_periodSw ? period : true)
exitShort = (trendDir != -1 or maDir == 1) and
condition[1] == -1 and
i_posSel != 'Only Long' and
(i_periodSw ? period : true)
closeCond = exitLong or exitShort
// Stop Loss (sl)
slEntry = close * i_sl / 100
slTop = close + slEntry
slBot = close - slEntry
slTopBuff = ta.valuewhen(condition[1] != 1 and entryLong, slBot, 0)
slBotBuff = ta.valuewhen(condition[1] != -1 and entryShort, slTop, 0)
slLine = condition[1] == -1 and entryLong ? slTopBuff :
condition[1] == 1 and entryShort ? slBotBuff :
condition[1] == 1 or entryLong ? slTopBuff :
condition[1] == -1 or entryShort ? slBotBuff : na
slTopCross = condition[1] == 1 and ta.crossunder(close, slLine) or high > slLine and low < slLine
slBotCross = condition[1] == -1 and ta.crossover (close, slLine) or high > slLine and low < slLine
slExit = i_slOn ? slTopCross or slBotCross : na
// Conditions
condition := condition[1] != 1 and entryLong ? 1 :
condition[1] != -1 and entryShort ? -1 :
condition[1] != 0 and slExit ? 0 :
condition[1] != 0 and exitLong ? 0 :
condition[1] != 0 and exitShort ? 0 : nz(condition[1])
long = condition[1] != 1 and condition == 1
short = condition[1] != -1 and condition == -1
xl = condition[1] == 1 and exitLong and not slExit
xs = condition[1] == -1 and exitShort and not slExit
sl = condition[1] != 0 and slExit
// --------- Colors
c_green = #006400 //Green
c_greenLight = #388e3c //Green Light
c_red = #8B0000 //Red
c_redLight = #b71c1c //Red Light
c_emas = xl ? color.new(color.orange, 99) :
xs ? color.new(color.orange, 99) :
trendDir == 1 and maDir == 1 ? color.new(c_green, 99) :
trendDir == -1 and maDir == -1 ? color.new(c_red, 99) :
color.new(color.orange, 99)
c_maFill = xl ? color.new(color.orange, 70) :
xs ? color.new(color.orange, 70) :
trendDir == 1 and maDir == 1 ? color.new(c_green, 70) :
trendDir == -1 and maDir == -1 ? color.new(c_red, 70) :
color.new(color.orange, 70)
c_maTrend = trendDir == 0 ? color.new(color.orange, 0) :
trendDir == 1 and maTrend[1] < maTrend ? color.new(c_green, 0) :
trendDir == 1 and maTrend[1] >= maTrend ? color.new(c_greenLight, 0) :
trendDir == -1 and maTrend[1] < maTrend ? color.new(c_redLight, 0) :
trendDir == -1 and maTrend[1] >= maTrend ? color.new(c_red, 0) : na
c_ch = trendDir == 0 ? color.new(color.orange, 50) :
trendDir == 1 ? color.new(c_green, 50) :
trendDir == -1 ? color.new(c_red, 50) : na
c_slLineUp = ta.rising (slLine, 1)
c_slLineDn = ta.falling(slLine, 1)
c_slLine = c_slLineUp ? na :
c_slLineDn ? na : color.red
c_barCol = trendDir == 0 ? color.new(color.orange, 0) :
trendDir == 1 and open <= close ? color.new(c_green, 0) :
trendDir == 1 and open > close ? color.new(c_greenLight, 0) :
trendDir == -1 and open >= close ? color.new(c_red, 0) :
trendDir == -1 and open < close ? color.new(c_redLight, 0) :
color.new(color.orange, 0)
// --------- Plots
p_maFast1 = plot(
maFast1,
title = 'EMA Fast 1',
color = c_emas,
linewidth = 1)
p_maFast2 = plot(
maFast2,
title = 'EMA Fast 2',
color = c_emas,
linewidth = 2)
fill(
p_maFast1, p_maFast2,
title = 'EMAs Fill',
color = c_maFill)
plot(
maTrend,
title = 'SMA Trend',
color = c_maTrend,
linewidth = 3)
p_chTop = plot(
i_channelOn ? rangeTop : na,
title = 'Top Channel',
color = c_maTrend,
linewidth = 1)
p_chBot = plot(
i_channelOn ? rangeBot : na,
title = 'Bottom Channel',
color = c_maTrend,
linewidth = 1)
fill(
p_chTop, p_chBot,
title = 'Channel',
color = c_ch)
plot(
i_slOn and condition != 0 ? slLine : na,
title = 'Stop Loss Line',
color = c_slLine,
linewidth = 1,
style = plot.style_linebr)
// --------- Alerts
barcolor(i_barColOn ? c_barCol : na)
plotshape(
i_alertOn and long ? high : na,
title = 'Long Label',
text = 'Long',
textcolor = color.white,
color = color.new(c_green, 0),
style = shape.labelup,
size = size.normal,
location = location.belowbar)
plotshape(
i_alertOn and short ? low : na,
title = 'Short Label',
text = 'Short',
textcolor = color.white,
color = color.new(c_red, 0),
style = shape.labeldown,
size = size.normal,
location = location.abovebar)
plotshape(
i_alertOn and (xl or xs) ? close : na,
title = 'Close Label',
text = 'Close',
textcolor = color.orange,
color = color.new(color.orange, 0),
style = shape.xcross,
size = size.small,
location = location.absolute)
plotshape(
i_alertOn and sl ? slLine : na,
title = 'Stop Loss',
text = 'Stop\nLoss',
textcolor = color.orange,
color = color.new(color.orange, 0),
style = shape.xcross,
size = size.small,
location = location.absolute)
plotshape(
i_alertOn and i_goldenOn and GCross ? maTrend : na,
title = 'Golden Cross Label',
text = 'Golden\nCross',
textcolor = color.white,
color = color.new(color.orange, 0),
style = shape.labelup,
size = size.normal,
location = location.absolute)
plotshape(
i_alertOn and i_goldenOn and DCross ? maTrend : na,
title = 'Death Cross Label',
text = 'Death\nCross',
textcolor = color.white,
color = color.new(color.orange, 0),
style = shape.labeldown,
size = size.normal,
location = location.absolute)
bgcolor(
i_periodSw and not period ? color.new(color.gray, 90) : na,
title = 'Session')
// --------- Backtest
if long and strategy.position_size == 0 and barstate.isconfirmed
strategy.entry('Long', strategy.long, comment = 'long')
if short and strategy.position_size == 0 and barstate.isconfirmed
strategy.entry('Short', strategy.short, comment = 'short')
strategy.exit(
id = 'XL',
from_entry = 'Long',
stop = i_slOn ? slLine : na)
strategy.exit(
id = 'XS',
from_entry = 'Short',
stop = i_slOn ? slLine : na)
strategy.close(
'Long',
comment = 'Close',
when = xl)
strategy.close(
'Short',
comment = 'Close',
when = xs)