Chỉ báo RSI kết hợp với chiến lược giao dịch Bollinger Bands


Ngày tạo: 2023-12-21 11:17:19 sửa đổi lần cuối: 2023-12-21 11:17:19
sao chép: 0 Số nhấp chuột: 809
1
tập trung vào
1623
Người theo dõi

Chỉ báo RSI kết hợp với chiến lược giao dịch Bollinger Bands

1. Ghi chú về chiến lược

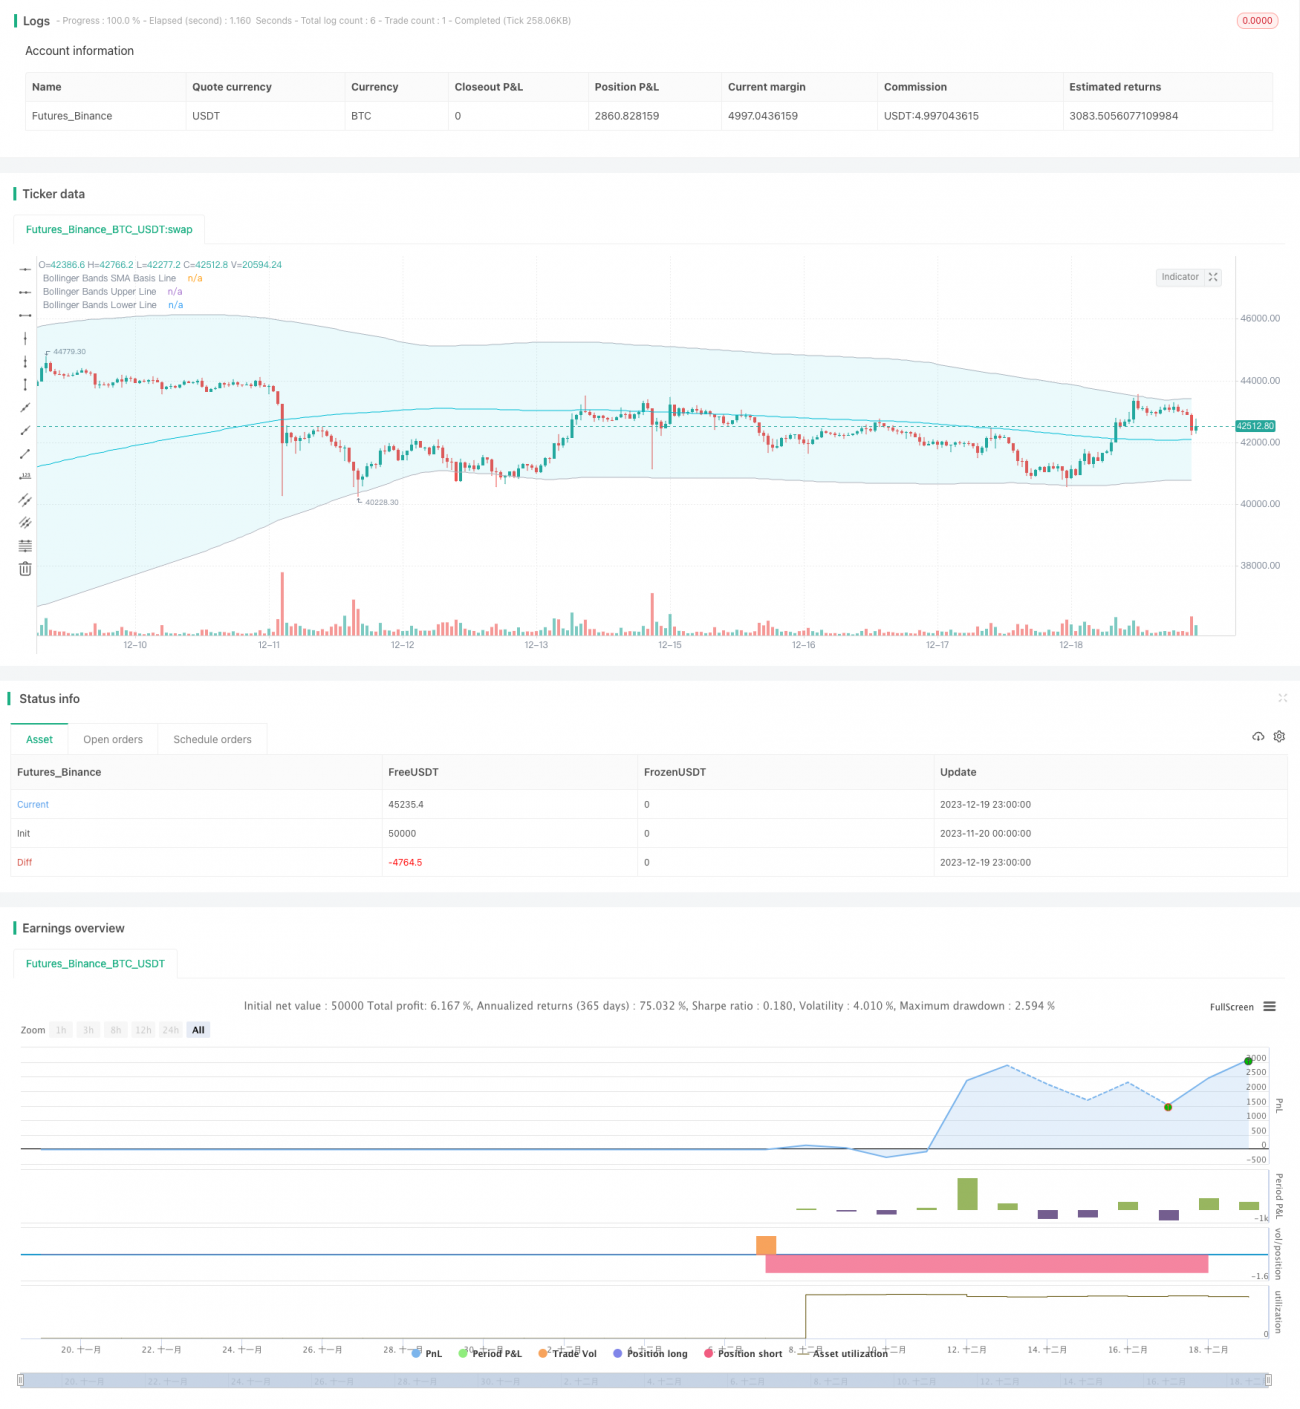
Chiến lược này được gọi là chiến lược dừng lỗ RSI Bollinger Bands (RSI Bollinger Bands TP / SL Strategy). Chiến lược này kết hợp các chỉ số RSI và các chỉ số Bollinger Bands để thực hiện định vị xu hướng và giao dịch phá vỡ.

2. Nguyên tắc chiến lược

1. RSI đánh giá sự đảo ngược

Chỉ số RSI có thể xác định xem một cổ phiếu có nằm trong phạm vi mua bán quá mức hay không. Khi RSI lớn hơn đường mua bán quá mức được đặt, thì nó là mua quá mức và khi nhỏ hơn đường bán quá mức được đặt thì nó là bán quá mức. Chiến lược này đặt đường mua quá mức là 50 và đường bán quá mức là 50.

2. Brin có xu hướng phán xét

Thường xuyên Brinh bằng cách tính toán chênh lệch tiêu chuẩn của giá cổ phiếu, để có được đường ray lên xuống của giá cổ phiếu. Đường ray trên là đường kháng cự, đường ray dưới là đường hỗ trợ.

3. RSI kết hợp với BRI

Khi chỉ số RSI xuất hiện tín hiệu đảo ngược dưới cùng, đồng thời giá cổ phiếu phá vỡ đường dây Brin xuống, cho rằng thị trường đã đảo ngược từ dưới lên, làm nhiều; khi chỉ số RSI xuất hiện tín hiệu đảo ngược trên cùng, đồng thời giá cổ phiếu phá vỡ đường dây Brin lên, cho rằng thị trường đã đảo ngược từ lên xuống, làm lỗ.

Ba, lợi thế chiến lược.

1. Bộ lọc hai chỉ số tăng độ chính xác tín hiệu

Chỉ số RSI và chỉ số Bollinger Bands được sử dụng để xác định xu hướng và điểm đảo ngược. Sử dụng cả hai kết hợp, có thể cải thiện độ chính xác nhận các tín hiệu mua và bán thực sự, tránh phá vỡ giả.

2. Kiểm soát rủi ro của cơ chế dừng lỗ

Chiến lược thiết lập điểm dừng để dừng lỗ, thêm điểm dừng vào giá nhập(1 + Stop Loss Ratio), điểm dừng là giá nhập(1- Stop Loss Ratio); trái lại, giao dịch ngoại hối có thể khóa lợi nhuận, tránh thiệt hại tối đa và kiểm soát rủi ro.

3. Định hướng mua bán tùy chỉnh

Chiến lược có thể lựa chọn chỉ giao dịch nhiều, chỉ giao dịch ngắn hoặc giao dịch hai chiều, người dùng có thể chọn hướng khác nhau tùy thuộc vào môi trường thị trường, kiểm soát rủi ro linh hoạt.

Bốn, rủi ro chiến lược

1. Brin-Band Parameter Sensitive

Kích thước chuẩn của dải Brin ảnh hưởng đến chiều rộng của dải Brin, do đó ảnh hưởng đến tín hiệu giao dịch. Nếu các tham số được thiết lập không đúng, có thể tạo ra một số lượng lớn tín hiệu sai.

2. Rủi ro của dừng lỗ

Nếu thị trường có sự đảo ngược kiểu V, các thiết lập dừng lỗ có thể quá quyết liệt, gây ra tổn thất không cần thiết.

3. RSI tham số nhạy cảm

Các tham số của RSI cũng ảnh hưởng đến hình dạng của đường cong RSI. Nếu tham số RSI được đặt sai, tín hiệu đảo ngược RSI sẽ giảm độ chính xác.

V. Chiến lược tối ưu hóa

1. Tối ưu hóa tham số RSI

Bạn có thể thử nghiệm nhiều tham số chiều dài RSI khác nhau để tìm các tham số kết hợp tốt nhất.

2. Tối ưu hóa tham số Brin

Có thể thử nghiệm nhiều chiều dài và tham số chênh lệch tiêu chuẩn hơn để tìm ra sự kết hợp tham số tốt nhất.

3. Kiểm tra tỷ lệ dừng khác nhau

Các tham số tỷ lệ dừng lỗ tốt nhất có thể được tìm thấy bằng cách tra lại.

VI. Kết luận

Chiến lược này sử dụng chỉ số RSI và chỉ số Brin để đánh giá xu hướng và đảo ngược, thêm vào cơ chế kiểm soát rủi ro dừng lỗ, có thể tự động xác định điểm mua và bán và dừng lỗ. Chiến lược này cũng có một số rủi ro, chủ yếu có thể được cải thiện thông qua các phương pháp như tối ưu hóa tham số.

Mã nguồn chiến lược
/*backtest
start: 2023-11-20 00:00:00
end: 2023-12-20 00:00:00
period: 1h
basePeriod: 15m
exchanges: [{"eid":"Futures_Binance","currency":"BTC_USDT"}]
*/

// This source code is subject to the terms of the Mozilla Public License 2.0 at https://mozilla.org/MPL/2.0/
// © BigCoinHunter

//@version=5
strategy(title="RSI_Boll-TP/SL", overlay=true, 
     pyramiding=0, default_qty_type=strategy.percent_of_equity, 
     default_qty_value=100, initial_capital=1000, 
     currency=currency.USD, commission_value=0.05, 
     commission_type=strategy.commission.percent, 
     process_orders_on_close=true)

//----------- get the user inputs --------------

//---------- RSI -------------
price = input(close, title="Source")

RSIlength = input.int(defval=6,title="RSI Length") 
RSIoverSold = input.int(defval=50, title="RSI OverSold", minval=1)
RSIoverBought = input.int(defval=50, title="RSI OverBought", minval=1)

//------- Bollinger Bands -----------
BBlength = input.int(defval=200, title="Bollinger Period Length", minval=1)
BBmult = input.float(defval=2.0, minval=0.001, maxval=50, step=0.1, title="Bollinger Bands Standard Deviation")
BBbasis = ta.sma(price, BBlength)
BBdev = BBmult * ta.stdev(price, BBlength)
BBupper = BBbasis + BBdev
BBlower = BBbasis - BBdev
source = close
buyEntry = ta.crossover(source, BBlower)
sellEntry = ta.crossunder(source, BBupper)
plot(BBbasis, color=color.aqua, title="Bollinger Bands SMA Basis Line")
p1 = plot(BBupper, color=color.silver, title="Bollinger Bands Upper Line")
p2 = plot(BBlower, color=color.silver, title="Bollinger Bands Lower Line")
fill(plot1=p1, plot2=p2, title="Bollinger BackGround", color=color.new(color.aqua,90), fillgaps=false, editable=true)

//---------- input TP/SL ---------------
tp = input.float(title="Take Profit:", defval=0.0, minval=0.0, maxval=100.0, step=0.1) * 0.01
sl = input.float(title="Stop Loss:  ", defval=0.0, minval=0.0, maxval=100.0, step=0.1) * 0.01

longEntry = input.bool(defval=true, title= 'Long Entry', inline="11")
shortEntry = input.bool(defval=true, title='Short Entry', inline="11")

//---------- backtest range setup ------------
fromDay   = input.int(defval = 1, title = "From Day", minval = 1, maxval = 31)
fromMonth = input.int(defval = 1, title = "From Month", minval = 1, maxval = 12)
fromYear  = input.int(defval = 2021, title = "From Year", minval = 2010)
toDay     = input.int(defval = 30, title = "To Day", minval = 1, maxval = 31)
toMonth   = input.int(defval = 12, title = "To Month", minval = 1, maxval = 12)
toYear    = input.int(defval = 2042, title = "To Year", minval = 2010)

//------------ time interval setup -----------
start     = timestamp(fromYear, fromMonth, fromDay, 00, 00)  // backtest start window
finish    = timestamp(toYear, toMonth, toDay, 23, 59)        // backtest finish window
window()  => time >= start and time <= finish ? true : false // create function "within window of time"

//------- define the global variables ------
var bool long = true
var bool stoppedOutLong = false
var bool stoppedOutShort = false
//--------- Colors ---------------

TrendColor = RSIoverBought and (price[1] > BBupper and price < BBupper) and BBbasis < BBbasis[1] ? color.red : RSIoverSold and (price[1] < BBlower and price > BBlower) and BBbasis > BBbasis[1] ? color.green : na
//bgcolor(switch2?(color.new(TrendColor,50)):na)


//--------- calculate the input/output points -----------
longProfitPrice  = strategy.position_avg_price * (1 + tp)     // tp -> take profit percentage
longStopPrice = strategy.position_avg_price * (1 - sl)        // sl -> stop loss percentage

shortProfitPrice  = strategy.position_avg_price * (1 - tp)
shortStopPrice = strategy.position_avg_price * (1 + sl)


//---------- RSI + Bollinger Bands Strategy -------------
vrsi = ta.rsi(price, RSIlength)

rsiCrossOver = ta.crossover(vrsi, RSIoverSold)
rsiCrossUnder = ta.crossunder(vrsi, RSIoverBought)

BBCrossOver = ta.crossover(source, BBlower)
BBCrossUnder = ta.crossunder(source, BBupper)

if (not na(vrsi))

    if rsiCrossOver and BBCrossOver
        long := true
        
    if rsiCrossUnder and BBCrossUnder
        long := false

//------------------- determine buy and sell points ---------------------
buySignall = window() and long  and (not stoppedOutLong)
sellSignall = window() and (not long)  and (not stoppedOutShort)

//---------- execute the strategy -----------------
if(longEntry and shortEntry)
    if long 
        strategy.entry("LONG", strategy.long, when = buySignall, comment = "ENTER LONG")
        stoppedOutLong := true
        stoppedOutShort := false
    else 
        strategy.entry("SHORT", strategy.short, when = sellSignall, comment = "ENTER SHORT")
        stoppedOutLong  := false
        stoppedOutShort := true

else if(longEntry)
    strategy.entry("LONG", strategy.long,  when = buySignall)
    strategy.close("LONG", when = sellSignall)
    if long 
        stoppedOutLong := true
    else
        stoppedOutLong  := false

else if(shortEntry)
    strategy.entry("SHORT", strategy.short, when = sellSignall)
    strategy.close("SHORT", when = buySignall)
    if not long
        stoppedOutShort := true
    else
        stoppedOutShort := false
    

//----------------- take profit and stop loss -----------------
if(tp>0.0 and sl>0.0)
    if ( strategy.position_size > 0 )
        strategy.exit(id="LONG", limit=longProfitPrice, stop=longStopPrice, comment="Long TP/SL Trigger")

    else if ( strategy.position_size < 0 )
        strategy.exit(id="SHORT", limit=shortProfitPrice, stop=shortStopPrice, comment="Short TP/SL Trigger")

else if(tp>0.0)
    if ( strategy.position_size > 0 )
        strategy.exit(id="LONG", limit=longProfitPrice, comment="Long TP Trigger")

    else if ( strategy.position_size < 0 )
        strategy.exit(id="SHORT", limit=shortProfitPrice, comment="Short TP Trigger")
        
else if(sl>0.0)
    if ( strategy.position_size > 0 )
        strategy.exit(id="LONG",  stop=longStopPrice, comment="Long SL Trigger")

    else if ( strategy.position_size < 0 )
        strategy.exit(id="SHORT",  stop=shortStopPrice, comment="Short SL Trigger")