Chiến lược giao dịch định lượng tự động dựa trên các thanh nội bộ và đường trung bình động
Tổng quan
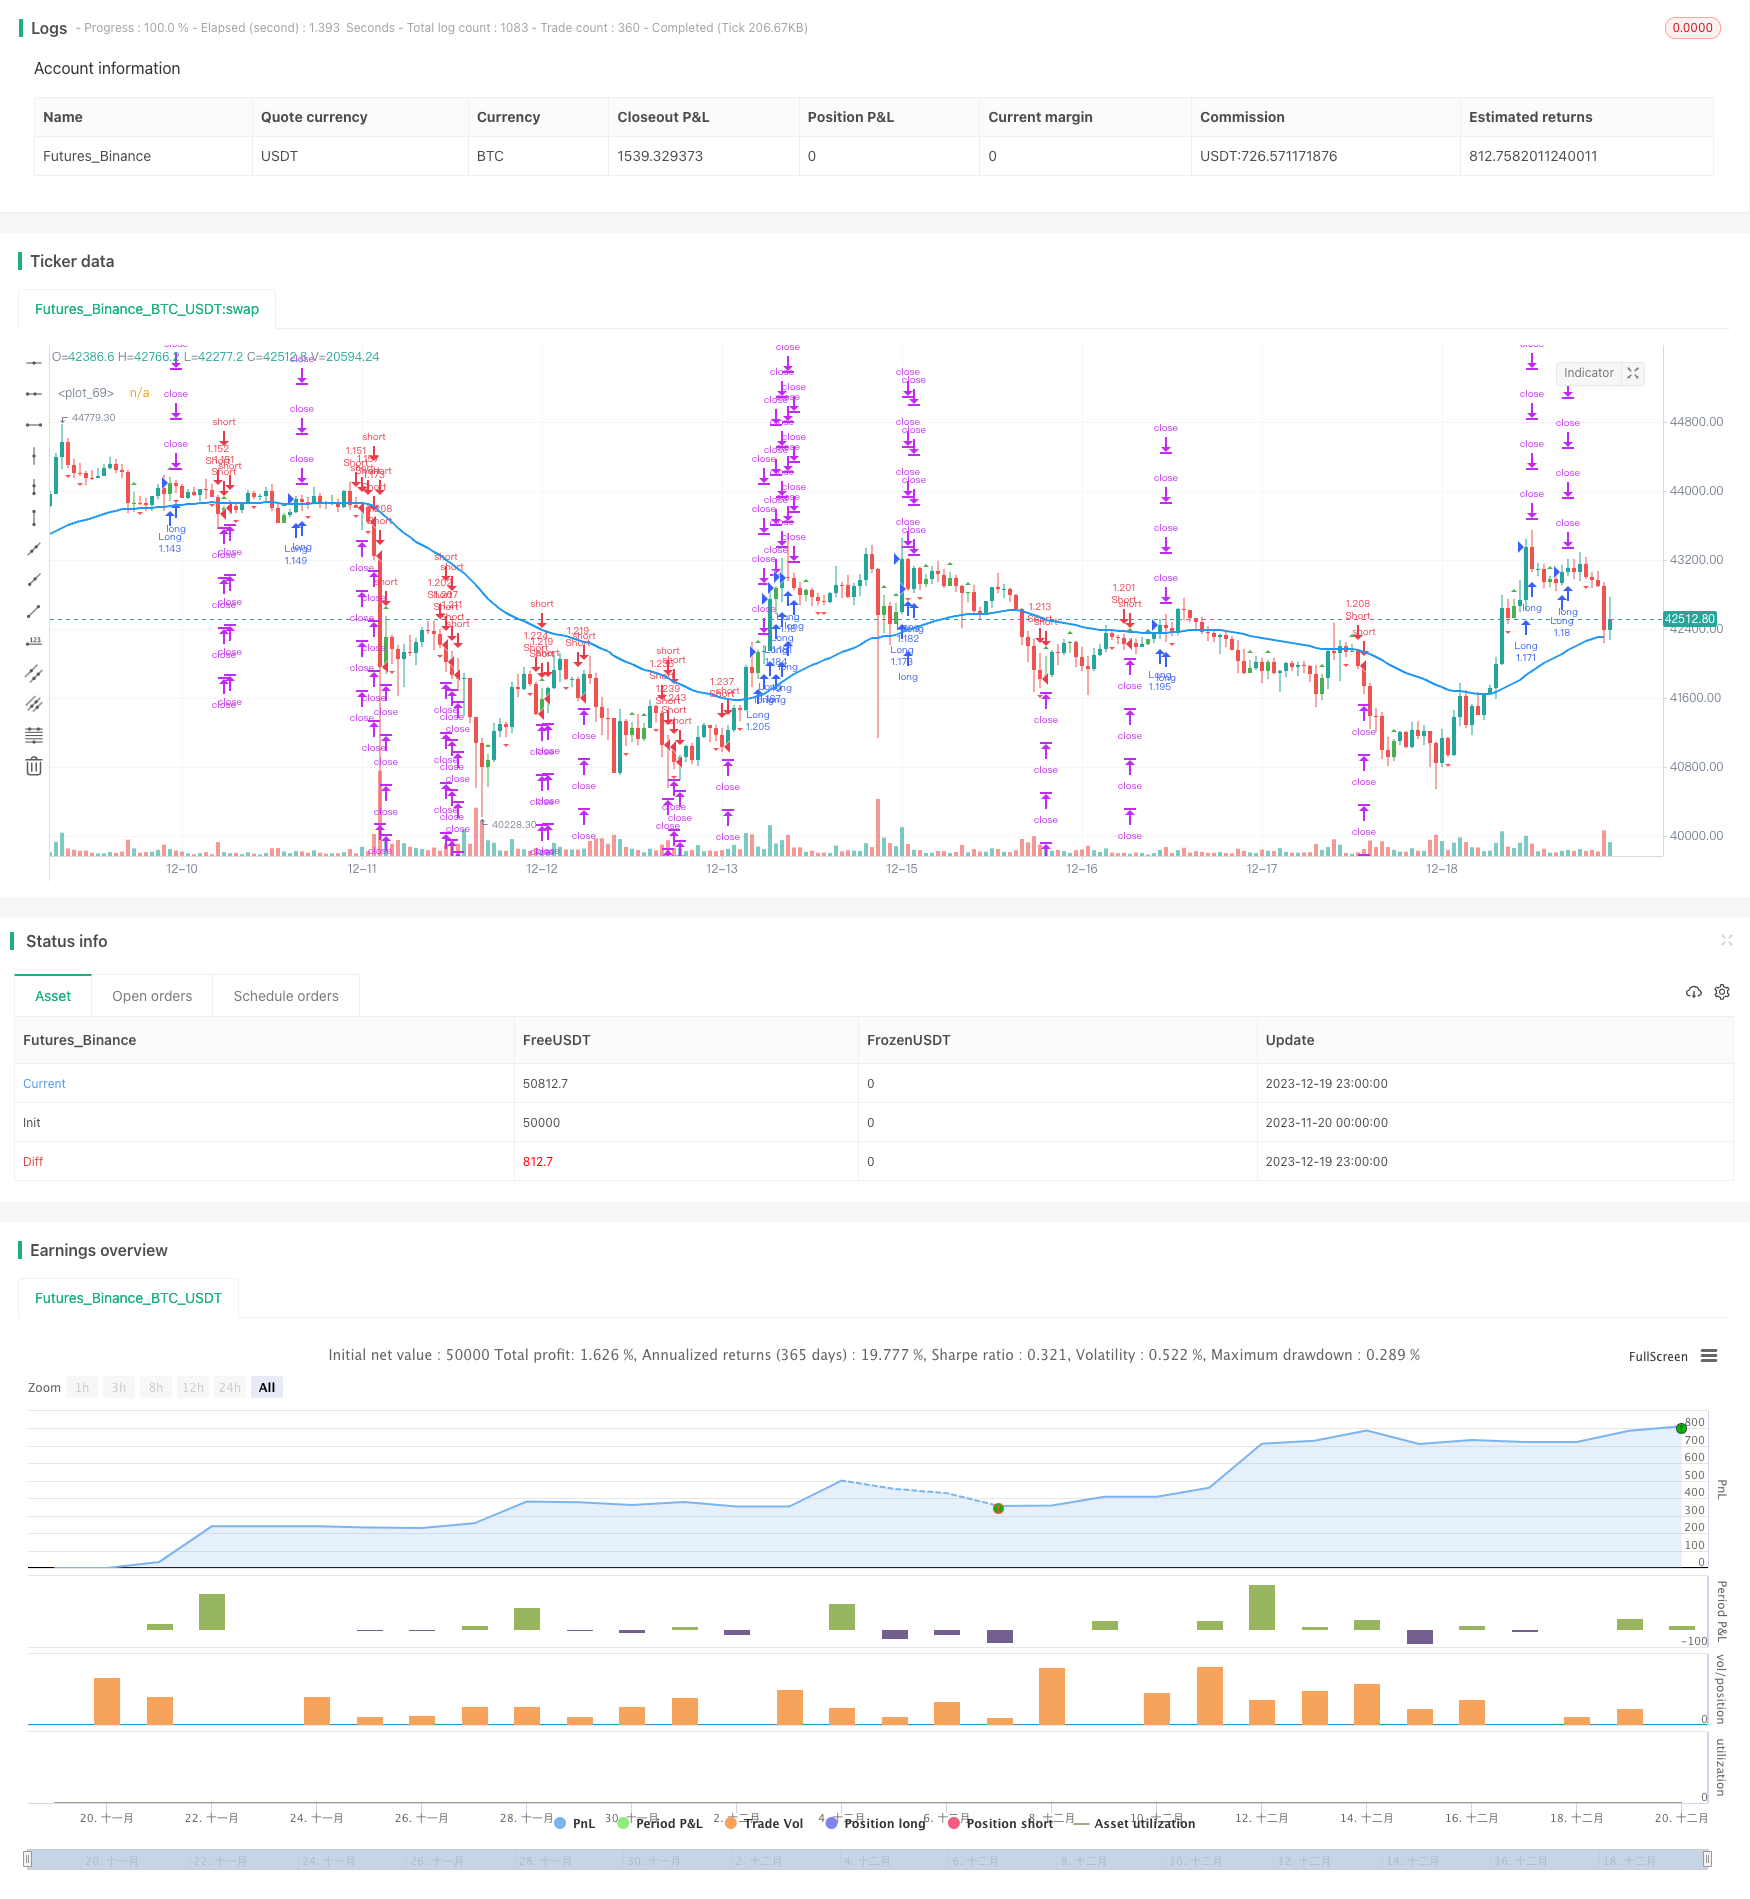
Ý tưởng cốt lõi của chiến lược này là kết hợp các hình ảnh cột bên trong và các chỉ số đường trung bình di chuyển để thực hiện giao dịch tự động. Khi hình ảnh cột bên trong xuất hiện, nó cho thấy xu hướng hiện tại có thể bị đảo ngược, tại thời điểm này, chúng tôi sử dụng vị trí của đường trung bình di chuyển để đánh giá hướng giao dịch cuối cùng.
Nguyên tắc chiến lược
Tìm hình dạng đường cột bên trong. Hình dạng đường cột bên trong là giá cao nhất và giá thấp nhất của một đường K nằm giữa các phần thực thể của đường K trước đó. Dựa trên màu sắc của thực thể, chúng ta có thể đánh giá cột bên trong là cột bên trong nhiều đầu hoặc cột bên trong không đầu.
Xác định vị trí của đường trung bình di chuyển. Khi tìm kiếm đường cột bên trong, nếu giá cao hơn đường trung bình di chuyển là tín hiệu đa đầu và giá thấp hơn đường trung bình di chuyển là tín hiệu đầu không.
Kết hợp hình dạng cột bên trong và tín hiệu đa trục của đường trung bình di chuyển, bạn có được hướng giao dịch cuối cùng. Đó là, giá xuống dưới cột bên trong phá vỡ đường trung bình để làm cho trống, giá trên cột bên trong phá vỡ đường trung bình để làm cho nhiều hơn.
Lợi thế chiến lược
Kết hợp các chỉ số kỹ thuật và hình thức giá để tăng độ chính xác của quyết định giao dịch.
Hình dạng cột bên trong tự nó chứa các tín hiệu biến đổi giá mạnh hơn, có thể xác định sớm điểm biến đổi xu hướng.
Đường trung bình di chuyển loại bỏ một phần tiếng ồn, tránh bị mắc kẹt trong các rung động trong khoảng.
Việc thực hiện giao dịch hoàn toàn tự động đã làm giảm đáng kể chi phí thời gian và công sức của giao dịch bằng tay.
Rủi ro chiến lược và giải pháp
Khi giá dao động gần đường trung bình, sẽ có nhiều tín hiệu sai, dẫn đến giao dịch quá mức. Bạn có thể giảm tín hiệu sai bằng cách tối ưu hóa tham số trung bình di chuyển hoặc thêm điều kiện lọc.
Chiến lược này phù hợp hơn với thị trường có xu hướng rõ ràng hơn, hiệu quả có thể bị chiết khấu trong tình huống chấn động. Có thể kết hợp với các chỉ số định xu hướng như ADX để kiểm soát sự khởi động của thuật toán.
Có một khoảng thời gian bị trễ. Các tham số có thể được rút ngắn thích hợp, hoặc tối ưu hóa cách tính toán của trung bình di chuyển để giảm độ trễ.
Có nhiều rủi ro rút tiền. Bạn có thể đặt lệnh dừng để kiểm soát rủi ro mất tiền, và điều chỉnh quản lý vị trí thích hợp cũng có thể giúp giảm rút tiền.
Hướng tối ưu hóa chiến lược
Tối ưu hóa cột bên trong để xác định tham số chu kỳ, tìm kiếm sự kết hợp tham số tốt nhất.
Thử các loại moving average khác nhau, như EMA, SMA, để xác định chỉ số moving average phù hợp nhất.
Thêm các chỉ số phụ trợ như MACD, KDJ, làm phong phú cơ sở phán đoán đa không gian, tăng độ chính xác tín hiệu.
Thêm các chỉ số lọc như ADX, ATR, kiểm soát môi trường mở thuật toán, tránh hoạt động trong thị trường không phù hợp.
Tối ưu hóa các chiến lược quản lý vị trí, chẳng hạn như kiểm soát vị trí rủi ro, lấy lại vị trí lỗ lợi nhuận để kiểm soát rủi ro và theo đuổi lợi nhuận cao hơn.
Tóm tắt
Chiến lược này thực hiện một chương trình giao dịch định lượng hoàn toàn tự động bằng cách theo dõi động các tín hiệu cột bên trong và các chỉ số trung bình di chuyển. Các tín hiệu chiến lược được tạo ra đơn giản, rõ ràng, dễ hiểu và theo dõi. Nó hoạt động tốt hơn trong thị trường có xu hướng rõ ràng.
/*backtest
start: 2023-11-20 00:00:00
end: 2023-12-20 00:00:00
period: 1h
basePeriod: 15m
exchanges: [{"eid":"Futures_Binance","currency":"BTC_USDT"}]
*/

// This source code is subject to the terms of the Mozilla Public License 2.0 at https://mozilla.org/MPL/2.0/
// © myn

//@version=5
strategy('Strategy Myth-Busting #10 - InsideBar+EMA - [MYN]', max_bars_back=5000, overlay=true, pyramiding=0, initial_capital=20000, currency='USD', default_qty_type=strategy.percent_of_equity, default_qty_value=100.0, commission_value=0.075, use_bar_magnifier = false)

/////////////////////////////////////
//* Put your strategy logic below *//
/////////////////////////////////////
//short if: inside bar and bearish & below 50 ema & price falls below low of inside bar. Opposite for long. on 4H TF

// Inside Bar
//░░░░░░░░░░░░░░░░░░░░░░░░░░░░░░░░░░░░░░░░░░░░░░░░░░░░░░░░░░░░░░░░░░░░░░░░░░░░░░░░░░░░░░░░░░░░░░░░░░░░░░░░░░░░░░░░░░░░░░░░░░░░░░░░░░░░░░░░░░░░░░░░░░

f_priorBarsSatisfied(_objectToEval, _numOfBarsToLookBack) =>
    returnVal = false
    for i = 0 to _numOfBarsToLookBack
        if (_objectToEval[i] == true)
            returnVal = true

i_numLookbackBars = input(2,title="Lookback for Inside Bar")


// This source code is subject to the terms of the GNU License 2.0 at https://www.gnu.org/licenses/old-licenses/gpl-2.0.en.html
// © cma

//@version=5
//indicator('Inside Bar Ind/Alert', overlay=true)

bullishBar = 1
bearishBar = -1

isInside() =>
    previousBar = 1
    bodyStatus = close >= open ? 1 : -1
    isInsidePattern = high < high[previousBar] and low > low[previousBar]

    isInsidePattern ? bodyStatus : 0

barcolor(isInside() == bullishBar ? color.green : na)
barcolor(isInside() == bearishBar ? color.red : na)

// When is bullish bar paint green
plotshape(isInside() == bullishBar, style=shape.triangleup, location=location.abovebar, color=color.new(color.green, 0))

// When is bearish bar paint red
plotshape(isInside() == bearishBar, style=shape.triangledown, location=location.belowbar, color=color.new(color.red, 0))

isInsideBarMade = isInside() == bullishBar or isInside() == bearishBar

alertcondition(isInsideBarMade, title='Inside Bar', message='Inside Bar came up!')

i_srcInsideBarLong = input.source(close, title = "_____ falls above HIGH of inside bar (Long condition)")
i_srcInsideBarShort = input.source(close, title = "_____ falls below LOW of inside bar (Short condition)")


//if: inside bar and falls below low of inside bar. I think.
insideBarLongEntry = f_priorBarsSatisfied(isInside() == bullishBar,i_numLookbackBars) and i_srcInsideBarLong > high[i_numLookbackBars]     //isInside() == bullishBar
insideBarShortEntry = f_priorBarsSatisfied(isInside() == bearishBar,i_numLookbackBars)  and i_srcInsideBarShort < low[i_numLookbackBars]    //isInside() == bearishBar


// EMA
//░░░░░░░░░░░░░░░░░░░░░░░░░░░░░░░░░░░░░░░░░░░░░░░░░░░░░░░░░░░░░░░░░░░░░░░░░░░░░░░░░░░░░░░░░░░░░░░░░░░░░░░░░░░░░░░░░░░░░░░░░░░░░░░░░░░░░░░░░░░░░░░░░░

i_src = input.source(close, title = "EMA Source")
i_emaLength = input(50,title="EMA Length")
ema = ta.ema(i_src, i_emaLength)
emaPlot = plot(series=ema,color=color.blue, linewidth=2)

emaLongEntry = i_src > ema
emaShortEntry = i_src < ema

//////////////////////////////////////
//* Put your strategy rules below *//
/////////////////////////////////////

longCondition = insideBarLongEntry and emaLongEntry
shortCondition = insideBarShortEntry and emaShortEntry
//define as 0 if do not want to use
closeLongCondition = 0
closeShortCondition = 0


// ADX
//░░░░░░░░░░░░░░░░░░░░░░░░░░░░░░░░░░░░░░░░░░░░░░░░░░░░░░░░░░░░░░░░░░░░░░░░░░░░░░░░░░░░░░░░░░░░░░░░░░░░░░░░░░░░░░░░░░░░░░░░░░░░░░░░░░░░░░░░░░░░░░░░░░

adxEnabled = input.bool(defval = false , title = "Average Directional Index (ADX)", tooltip = "", group ="ADX" )
adxlen = input(14, title="ADX Smoothing", group="ADX")
adxdilen = input(14, title="DI Length", group="ADX")
adxabove = input(25, title="ADX Threshold", group="ADX")

adxdirmov(len) =>
	adxup = ta.change(high)
	adxdown = -ta.change(low)
	adxplusDM = na(adxup) ? na : (adxup > adxdown and adxup > 0 ? adxup : 0)
	adxminusDM = na(adxdown) ? na : (adxdown > adxup and adxdown > 0 ? adxdown : 0)
	adxtruerange = ta.rma(ta.tr, len)
	adxplus = fixnan(100 * ta.rma(adxplusDM, len) / adxtruerange)
	adxminus = fixnan(100 * ta.rma(adxminusDM, len) / adxtruerange)
	[adxplus, adxminus]
adx(adxdilen, adxlen) =>
	[adxplus, adxminus] = adxdirmov(adxdilen)
	adxsum = adxplus + adxminus
	adx = 100 * ta.rma(math.abs(adxplus - adxminus) / (adxsum == 0 ? 1 : adxsum), adxlen)

adxsig = adxEnabled ? adx(adxdilen, adxlen) : na
isADXEnabledAndAboveThreshold = adxEnabled ? (adxsig > adxabove) : true

//Backtesting Time Period (Input.time not working as expected as of 03/30/2021.  Giving odd start/end dates
//░░░░░░░░░░░░░░░░░░░░░░░░░░░░░░░░░░░░░░░░░░░░░░░░░░░░░░░░░░░░░░░░░░░░░░░░░░░░░░░░░░░░░░░░░░░░░░░░░░░░░░░░░░░░░░░░░░░░░░░░░░░░░░░░░░░░░░░░░░░░░░░░░░
useStartPeriodTime = input.bool(true, 'Start', group='Date Range', inline='Start Period')
startPeriodTime = input(timestamp('1 Jan 2019'), '', group='Date Range', inline='Start Period')
useEndPeriodTime = input.bool(true, 'End', group='Date Range', inline='End Period')
endPeriodTime = input(timestamp('31 Dec 2030'), '', group='Date Range', inline='End Period')

start = useStartPeriodTime ? startPeriodTime >= time : false
end = useEndPeriodTime ? endPeriodTime <= time : false
calcPeriod = true

// Trade Direction
// ░░░░░░░░░░░░░░░░░░░░░░░░░░░░░░░░░░░░░░░░░░░░░░░░░░░░░░░░░░░░░░░░░░░░░░░░░░░░░░░░░░░░░░░░░░░░░░░░░░░░░░░░░░░░░░░░░░░░░░░░░░░░░░░░░░░░░░░░░░░░░░░░░░
tradeDirection = input.string('Long and Short', title='Trade Direction', options=['Long and Short', 'Long Only', 'Short Only'], group='Trade Direction')

// Percent as Points
// ░░░░░░░░░░░░░░░░░░░░░░░░░░░░░░░░░░░░░░░░░░░░░░░░░░░░░░░░░░░░░░░░░░░░░░░░░░░░░░░░░░░░░░░░░░░░░░░░░░░░░░░░░░░░░░░░░░░░░░░░░░░░░░░░░░░░░░░░░░░░░░░░░░
per(pcnt) =>
    strategy.position_size != 0 ? math.round(pcnt / 100 * strategy.position_avg_price / syminfo.mintick) : float(na)

// Take profit 1
// ░░░░░░░░░░░░░░░░░░░░░░░░░░░░░░░░░░░░░░░░░░░░░░░░░░░░░░░░░░░░░░░░░░░░░░░░░░░░░░░░░░░░░░░░░░░░░░░░░░░░░░░░░░░░░░░░░░░░░░░░░░░░░░░░░░░░░░░░░░░░░░░░░░
tp1 = input.float(title='Take Profit 1 - Target %', defval=10.5, minval=0.0, step=0.5, group='Take Profit', inline='Take Profit 1')
q1 = input.int(title='% Of Position', defval=25, minval=0, group='Take Profit', inline='Take Profit 1')

// Take profit 2
// ░░░░░░░░░░░░░░░░░░░░░░░░░░░░░░░░░░░░░░░░░░░░░░░░░░░░░░░░░░░░░░░░░░░░░░░░░░░░░░░░░░░░░░░░░░░░░░░░░░░░░░░░░░░░░░░░░░░░░░░░░░░░░░░░░░░░░░░░░░░░░░░░░░
tp2 = input.float(title='Take Profit 2 - Target %', defval=11, minval=0.0, step=0.5, group='Take Profit', inline='Take Profit 2')
q2 = input.int(title='% Of Position', defval=25, minval=0, group='Take Profit', inline='Take Profit 2')

// Take profit 3
// ░░░░░░░░░░░░░░░░░░░░░░░░░░░░░░░░░░░░░░░░░░░░░░░░░░░░░░░░░░░░░░░░░░░░░░░░░░░░░░░░░░░░░░░░░░░░░░░░░░░░░░░░░░░░░░░░░░░░░░░░░░░░░░░░░░░░░░░░░░░░░░░░░░
tp3 = input.float(title='Take Profit 3 - Target %', defval=11.5, minval=0.0, step=0.5, group='Take Profit', inline='Take Profit 3')
q3 = input.int(title='% Of Position', defval=25, minval=0, group='Take Profit', inline='Take Profit 3')

// Take profit 4
// ░░░░░░░░░░░░░░░░░░░░░░░░░░░░░░░░░░░░░░░░░░░░░░░░░░░░░░░░░░░░░░░░░░░░░░░░░░░░░░░░░░░░░░░░░░░░░░░░░░░░░░░░░░░░░░░░░░░░░░░░░░░░░░░░░░░░░░░░░░░░░░░░░░
tp4 = input.float(title='Take Profit 4 - Target %', defval=12, minval=0.0, step=0.5, group='Take Profit')

/// Stop Loss
// ░░░░░░░░░░░░░░░░░░░░░░░░░░░░░░░░░░░░░░░░░░░░░░░░░░░░░░░░░░░░░░░░░░░░░░░░░░░░░░░░░░░░░░░░░░░░░░░░░░░░░░░░░░░░░░░░░░░░░░░░░░░░░░░░░░░░░░░░░░░░░░░░░░
stoplossPercent = input.float(title='Stop Loss (%)', defval=4, minval=0.01, group='Stop Loss') * 0.01
slLongClose = close < strategy.position_avg_price * (1 - stoplossPercent)
slShortClose = close > strategy.position_avg_price * (1 + stoplossPercent)

/// Leverage
// ░░░░░░░░░░░░░░░░░░░░░░░░░░░░░░░░░░░░░░░░░░░░░░░░░░░░░░░░░░░░░░░░░░░░░░░░░░░░░░░░░░░░░░░░░░░░░░░░░░░░░░░░░░░░░░░░░░░░░░░░░░░░░░░░░░░░░░░░░░░░░░░░░░
leverage = input.float(1, 'Leverage', step=.5, group='Leverage')
contracts = math.min(math.max(.000001, strategy.equity / close * leverage), 1000000000)


/// Trade State Management
// ░░░░░░░░░░░░░░░░░░░░░░░░░░░░░░░░░░░░░░░░░░░░░░░░░░░░░░░░░░░░░░░░░░░░░░░░░░░░░░░░░░░░░░░░░░░░░░░░░░░░░░░░░░░░░░░░░░░░░░░░░░░░░░░░░░░░░░░░░░░░░░░░░░

isInLongPosition = strategy.position_size > 0
isInShortPosition = strategy.position_size < 0

/// ProfitView Alert Syntax String Generation
// ░░░░░░░░░░░░░░░░░░░░░░░░░░░░░░░░░░░░░░░░░░░░░░░░░░░░░░░░░░░░░░░░░░░░░░░░░░░░░░░░░░░░░░░░░░░░░░░░░░░░░░░░░░░░░░░░░░░░░░░░░░░░░░░░░░░░░░░░░░░░░░░░░░

alertSyntaxPrefix = input.string(defval='CRYPTANEX_99FTX_Strategy-Name-Here', title='Alert Syntax Prefix', group='ProfitView Alert Syntax')
alertSyntaxBase = alertSyntaxPrefix + '\n#' + str.tostring(open) + ',' + str.tostring(high) + ',' + str.tostring(low) + ',' + str.tostring(close) + ',' + str.tostring(volume) + ','


/// Trade Execution
// ░░░░░░░░░░░░░░░░░░░░░░░░░░░░░░░░░░░░░░░░░░░░░░░░░░░░░░░░░░░░░░░░░░░░░░░░░░░░░░░░░░░░░░░░░░░░░░░░░░░░░░░░░░░░░░░░░░░░░░░░░░░░░░░░░░░░░░░░░░░░░░░░░░

longConditionCalc = (longCondition and isADXEnabledAndAboveThreshold)
shortConditionCalc = (shortCondition and isADXEnabledAndAboveThreshold)

if calcPeriod
    if longConditionCalc and tradeDirection != 'Short Only' and isInLongPosition == false
        strategy.entry('Long', strategy.long, qty=contracts)

        alert(message=alertSyntaxBase + 'side:long', freq=alert.freq_once_per_bar_close)

    if shortConditionCalc and tradeDirection != 'Long Only' and isInShortPosition == false
        strategy.entry('Short', strategy.short, qty=contracts)

        alert(message=alertSyntaxBase + 'side:short', freq=alert.freq_once_per_bar_close)

    //Inspired from Multiple %% profit exits example by adolgo https://www.tradingview.com/script/kHhCik9f-Multiple-profit-exits-example/
    strategy.exit('TP1', qty_percent=q1, profit=per(tp1))
    strategy.exit('TP2', qty_percent=q2, profit=per(tp2))
    strategy.exit('TP3', qty_percent=q3, profit=per(tp3))
    strategy.exit('TP4', profit=per(tp4))

    strategy.close('Long', qty_percent=100, comment='SL Long', when=slLongClose)
    strategy.close('Short', qty_percent=100, comment='SL Short', when=slShortClose)

    strategy.close_all(when=closeLongCondition or closeShortCondition, comment='Close Postion')

/// Dashboard
// ░░░░░░░░░░░░░░░░░░░░░░░░░░░░░░░░░░░░░░░░░░░░░░░░░░░░░░░░░░░░░░░░░░░░░░░░░░░░░░░░░░░░░░░░░░░░░░░░░░░░░░░░░░░░░░░░░░░░░░░░░░░░░░░░░░░░░░░░░░░░░░░░░░
// Inspired by https://www.tradingview.com/script/uWqKX6A2/ - Thanks VertMT

showDashboard = input.bool(group="Dashboard", title="Show Dashboard", defval=false)

f_fillCell(_table, _column, _row, _title, _value, _bgcolor, _txtcolor) =>
    _cellText = _title + "\n" + _value
    table.cell(_table, _column, _row, _cellText, bgcolor=_bgcolor, text_color=_txtcolor, text_size=size.auto)

// Draw dashboard table
if showDashboard
    var bgcolor = color.new(color.black,0)

    // Keep track of Wins/Losses streaks
    newWin  = (strategy.wintrades  > strategy.wintrades[1]) and (strategy.losstrades == strategy.losstrades[1]) and (strategy.eventrades == strategy.eventrades[1])
    newLoss = (strategy.wintrades == strategy.wintrades[1]) and (strategy.losstrades  > strategy.losstrades[1]) and (strategy.eventrades == strategy.eventrades[1])

    varip int winRow     = 0
    varip int lossRow    = 0
    varip int maxWinRow  = 0
    varip int maxLossRow = 0

    if newWin
        lossRow := 0
        winRow := winRow + 1
    if winRow > maxWinRow
        maxWinRow := winRow

    if newLoss
        winRow := 0
        lossRow := lossRow + 1
    if lossRow > maxLossRow
        maxLossRow := lossRow


    // Prepare stats table
    var table dashTable = table.new(position.bottom_right, 1, 15, border_width=1)


    if barstate.islastconfirmedhistory
        // Update table
        dollarReturn = strategy.netprofit
        f_fillCell(dashTable, 0, 0, "Start:", str.format("{0,date,long}", strategy.closedtrades.entry_time(0)) , bgcolor, color.white) // + str.format(" {0,time,HH:mm}", strategy.closedtrades.entry_time(0))
        f_fillCell(dashTable, 0, 1, "End:", str.format("{0,date,long}", strategy.opentrades.entry_time(0)) , bgcolor, color.white) // + str.format(" {0,time,HH:mm}", strategy.opentrades.entry_time(0))
        _profit = (strategy.netprofit / strategy.initial_capital) * 100
        f_fillCell(dashTable, 0, 2, "Net Profit:", str.tostring(_profit, '##.##') + "%", _profit > 0 ? color.green : color.red, color.white)
        _numOfDaysInStrategy = (strategy.opentrades.entry_time(0) - strategy.closedtrades.entry_time(0)) / (1000 * 3600 * 24)
        f_fillCell(dashTable, 0, 3, "Percent Per Day", str.tostring(_profit / _numOfDaysInStrategy, '#########################.#####')+"%", _profit > 0 ? color.green : color.red, color.white)
        _winRate = ( strategy.wintrades / strategy.closedtrades ) * 100
        f_fillCell(dashTable, 0, 4, "Percent Profitable:", str.tostring(_winRate, '##.##') + "%", _winRate < 50 ? color.red : _winRate < 75 ? #999900 : color.green, color.white)
        f_fillCell(dashTable, 0, 5, "Profit Factor:", str.tostring(strategy.grossprofit / strategy.grossloss,  '##.###'), strategy.grossprofit > strategy.grossloss ? color.green : color.red, color.white)
        f_fillCell(dashTable, 0, 6, "Total Trades:", str.tostring(strategy.closedtrades), bgcolor, color.white)
        f_fillCell(dashTable, 0, 8, "Max Wins In A Row:", str.tostring(maxWinRow, '######') , bgcolor, color.white)
        f_fillCell(dashTable, 0, 9, "Max Losses In A Row:", str.tostring(maxLossRow, '######') , bgcolor, color.white)