Chiến lược theo dõi xu hướng dài hạn dựa trên chỉ báo RSI
Tổng quan
Chiến lược này dựa trên các chỉ số tương đối mạnh mẽ (RSI) thiết kế, theo dõi xu hướng đa đầu đối với RSI thấp điểm mua, cao điểm dừng lỗ. Chiến lược này tạo ra tín hiệu mua khi chỉ số RSI thấp hơn đường mua quá mức và tạo ra tín hiệu bán khi chỉ số RSI cao hơn đường bán quá mức. Chiến lược tối ưu hóa hiệu suất theo dõi xu hướng, có thể kiểm soát rủi ro giao dịch hiệu quả.
Nguyên tắc chiến lược
Chiến lược này sử dụng chỉ số RSI để xác định xem giá cổ phiếu có bị đánh giá quá cao hay thấp không. Chỉ số RSI kết hợp với đường mua bán quá cao để tạo ra tín hiệu mua và bán. Cụ thể, nếu RSI vượt qua đường bán quá mức 20 sẽ tạo ra tín hiệu mua; Nếu RSI vượt qua đường mua quá mức 80 sẽ tạo ra tín hiệu bán.
Sau khi vào vị trí đa đầu, chiến lược thiết lập một đường dừng ban đầu để kiểm soát rủi ro đi xuống. Đồng thời thiết lập hai đường dừng với tỷ lệ khác nhau, ngăn chặn hàng loạt để khóa lợi nhuận. Cụ thể, đầu tiên dừng 50% vị trí, dừng giá 3% giá mua; sau đó dừng 50% vị trí còn lại, dừng giá 5% giá mua.
Chiến lược này sử dụng các chỉ số RSI một cách ngắn gọn và hiệu quả để xác định thời gian đưa ra thị trường. Thiết lập dừng lỗ là hợp lý, có thể kiểm soát rủi ro hiệu quả.
Lợi thế chiến lược
- Sử dụng chỉ số RSI để đánh giá giá dư thừa, tránh làm quá nhiều một cách mù quáng
- Các tham số của chỉ số RSI được tối ưu hóa, hiệu quả chỉ số tốt hơn
- Thiết kế bơm đệm đôi hợp lý, có thể thực hiện bơm bơm đệm theo lô, khóa lợi nhuận nhiều hơn
- Ngăn chặn lỗ ban đầu và ngăn chặn lỗ liên tục để ngăn chặn tổn thất lớn
Phân tích rủi ro
- Chiến lược đa đầu, không hiệu quả trong thị trường bò
- RSI có khả năng phát ra tín hiệu sai, tín hiệu sai có thể làm tăng tổn thất
- Đi quá sâu vào điểm dừng sẽ gây ra rủi ro không thể dừng
- Không có giới hạn về số lần và tỷ lệ đặt hàng có thể làm tăng tổn thất
Hướng tối ưu hóa
- Kết hợp với các chỉ số khác để lọc tín hiệu RSI và tăng độ chính xác tín hiệu
- Thêm giới hạn về số lần và tỷ lệ đặt hàng
- Kiểm tra hiệu quả của các tham số RSI khác nhau
- Tối ưu hóa điểm dừng lỗ, giảm rủi ro
Tóm tắt
Chiến lược này sử dụng chỉ số RSI để đánh giá tình hình, thiết lập dừng lỗ là hợp lý. Có thể đánh giá hiệu quả xu hướng, kiểm soát rủi ro giao dịch, phù hợp để sử dụng chiến lược theo dõi nhiều đầu. Có thể nâng cao thêm sự ổn định của chiến lược thông qua lọc tín hiệu, kiểm tra tham số, tối ưu hóa dừng lỗ.
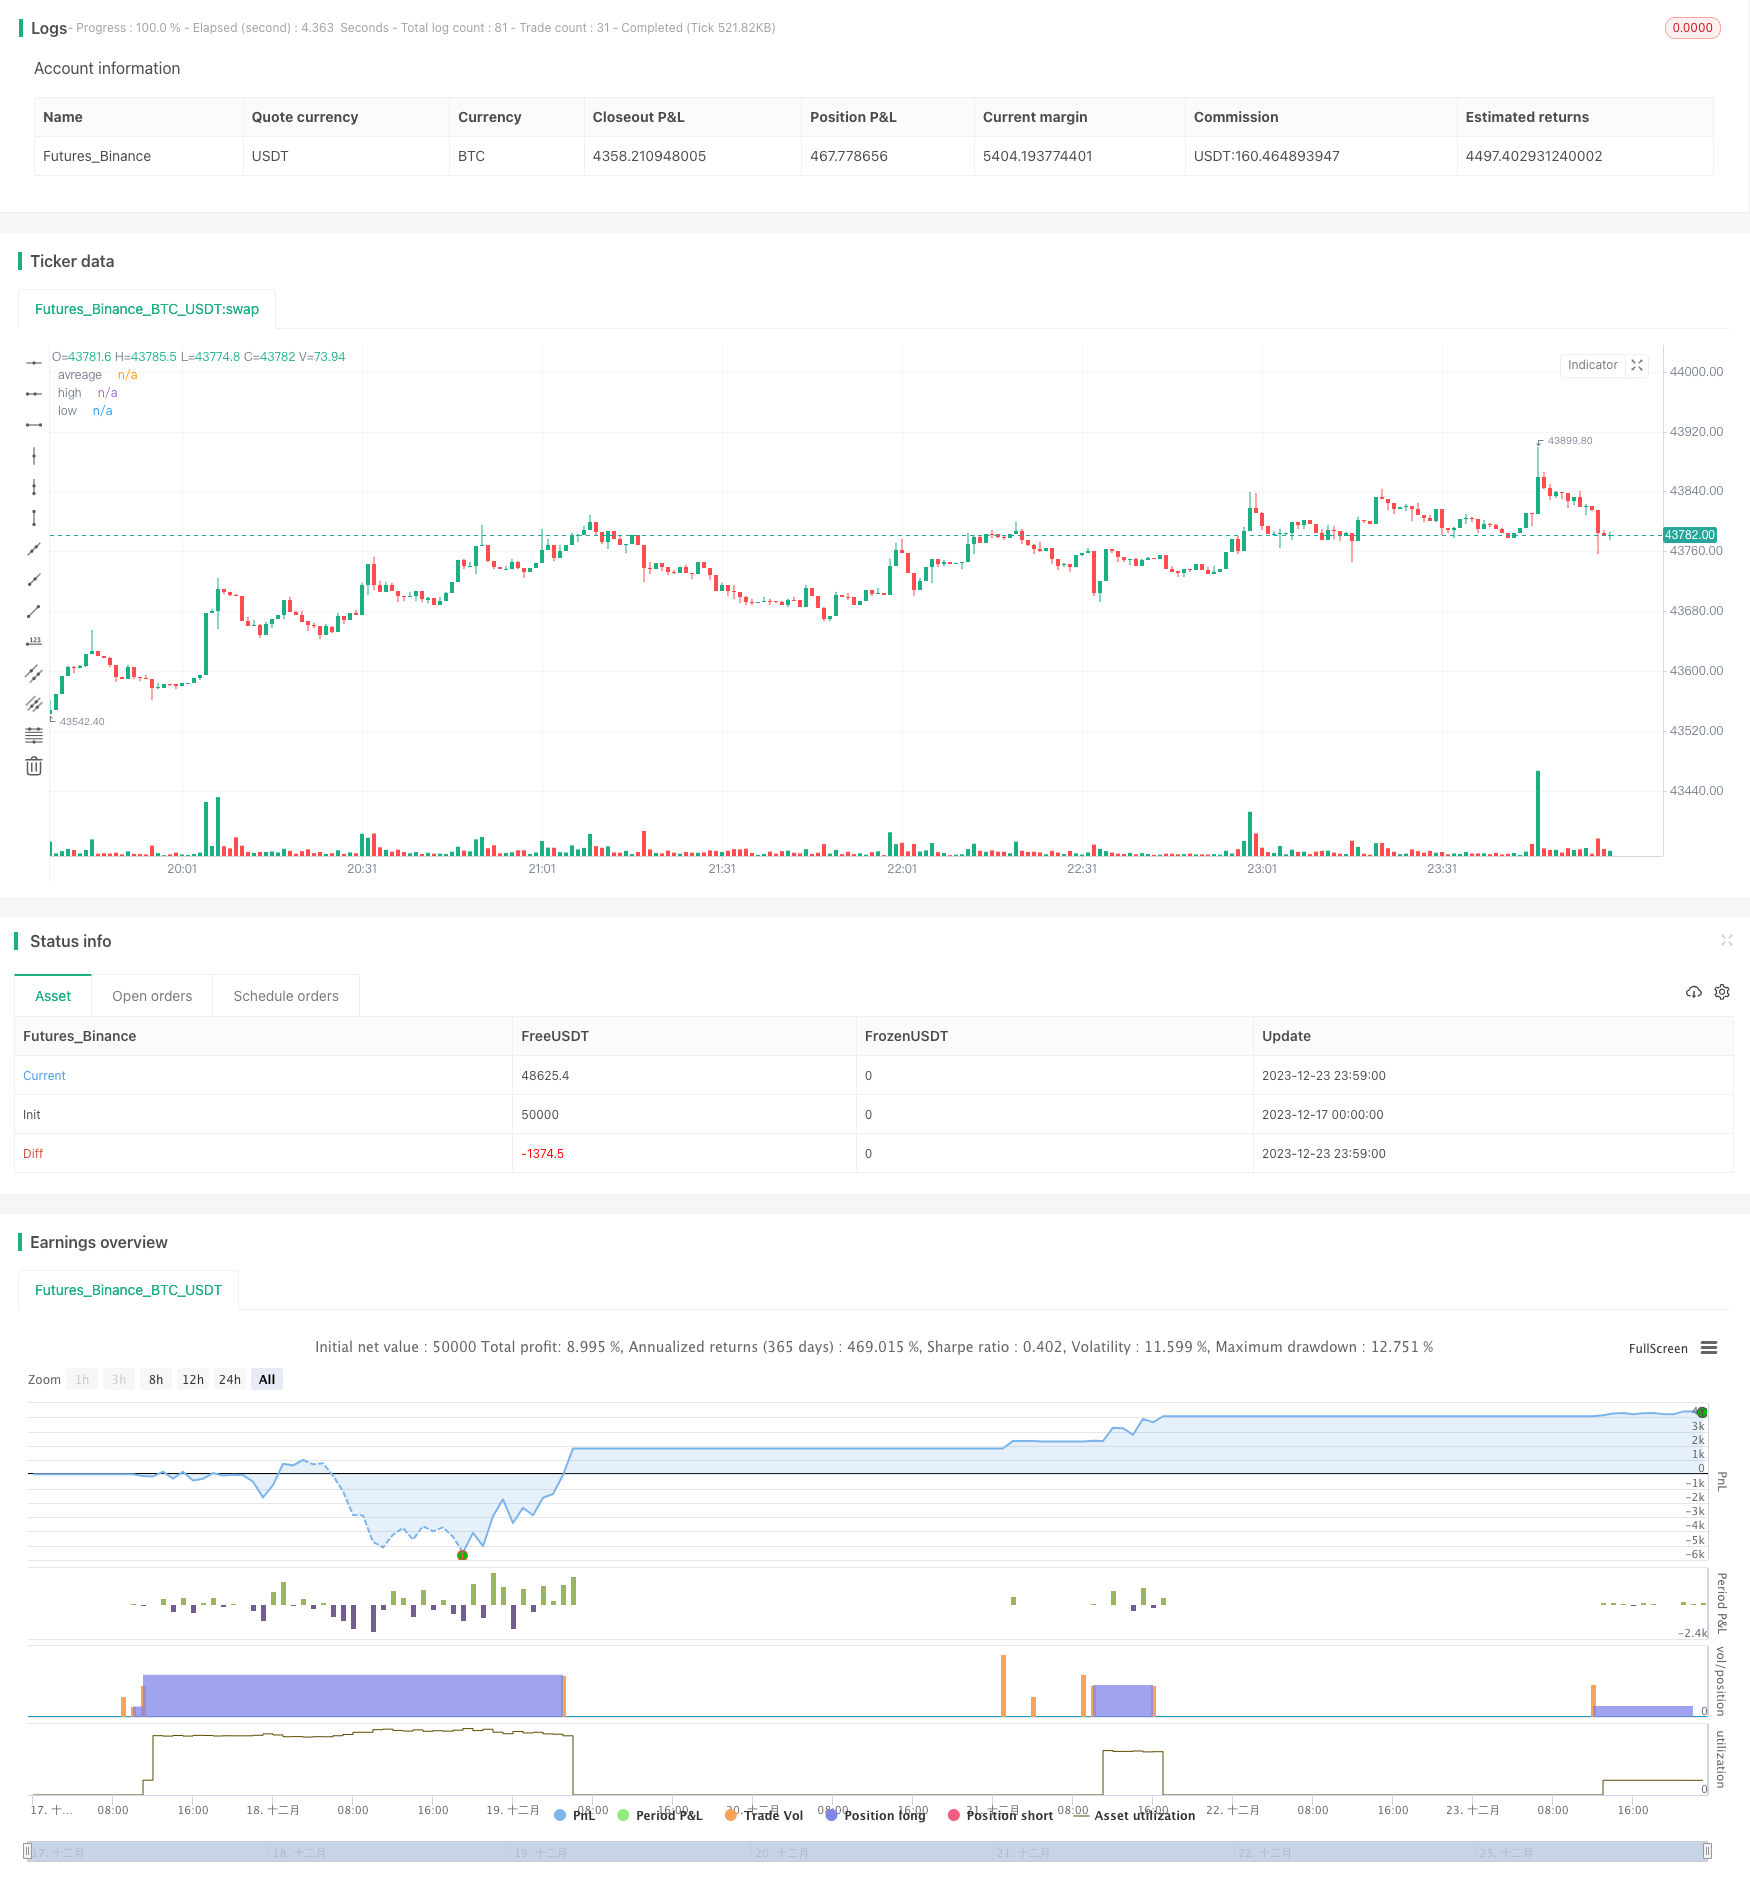
/*backtest
start: 2023-12-17 00:00:00
end: 2023-12-24 00:00:00
period: 1m
basePeriod: 1m
exchanges: [{"eid":"Futures_Binance","currency":"BTC_USDT"}]
*/

// This source code is subject to the terms of the Mozilla Public License 2.0 at https://mozilla.org/MPL/2.0/

//@version=5

strategy(title='RSI Long Strategy', overlay=true, pyramiding=5, initial_capital=10000, default_qty_type=strategy.percent_of_equity, default_qty_value=100, calc_on_order_fills=false, slippage=0, commission_type=strategy.commission.percent, commission_value=0.075)
strat_dir_input = input.string(title='Strategy Direction', defval='long', options=['long', 'short', 'all'])
strat_dir_value = strat_dir_input == 'long' ? strategy.direction.long : strat_dir_input == 'short' ? strategy.direction.short : strategy.direction.all
strategy.risk.allow_entry_in(strat_dir_value)
//INPUTS


length = input(21)
overSold = input(20)
overBought = input(80)
p = close

vrsi = ta.rsi(p, length)
price = close
var bool long = na
var bool short = na

long := ta.crossover(vrsi, overSold)
short := ta.crossunder(vrsi, overBought)

var float last_open_long = na
var float last_open_short = na

last_open_long := long ? close : nz(last_open_long[1])
last_open_short := short ? close : nz(last_open_short[1])
mpoint=(last_open_long+last_open_short)/2

entry_value = last_open_long
entry_value1 = last_open_short

// Rounding levels to min tick
nround(x) =>
    n = math.round(x / syminfo.mintick) * syminfo.mintick
    n
//
disp_panels = input(true, title='Display info panels?')
fibs_label_off = input(40, title='fibs label offset')
fibs_label_size = input.string(size.normal, options=[size.tiny, size.small, size.normal, size.large, size.huge], title='fibs label size')
r1_x = timenow + math.round(ta.change(time) * fibs_label_off)
r1_y = last_open_short
text1 = 'High : ' + str.tostring(nround(last_open_short))
s1_y = last_open_long
text3 = 'low : ' + str.tostring(nround(last_open_long))

R1_label = disp_panels ? label.new(x=r1_x, y=r1_y, text=text1, xloc=xloc.bar_time, yloc=yloc.price, color=color.orange, style=label.style_label_down, textcolor=color.black, size=fibs_label_size) : na
S1_label = disp_panels ? label.new(x=r1_x, y=s1_y, text=text3, xloc=xloc.bar_time, yloc=yloc.price, color=color.lime, style=label.style_label_up, textcolor=color.black, size=fibs_label_size) : na

label.delete(R1_label[1])
label.delete(S1_label[1])
//
plot(mpoint, title='avreage', color=color.new(color.red, 40), style=plot.style_linebr, linewidth=3, trackprice=true, offset=-9999)
plot(last_open_short, title='high', color=color.new(color.red, 40), style=plot.style_linebr, linewidth=3, trackprice=true, offset=-9999)
plot(last_open_long, title='low', color=color.new(color.blue, 40), style=plot.style_linebr, linewidth=3, trackprice=true, offset=-9999)
//
trend = input(false)
if barstate.islast and trend == true
    line z = line.new(bar_index[1], last_open_short[1], bar_index, last_open_short, extend=extend.both, color=color.red, style=line.style_dashed, width=1)
    line f = line.new(bar_index[1], mpoint[1], bar_index, mpoint, extend=extend.both, color=color.blue, style=line.style_dashed, width=1)
    line w = line.new(bar_index[1], last_open_long[1], bar_index, last_open_long, extend=extend.both, color=color.green, style=line.style_dashed, width=1)
    line.delete(z[1])
    line.delete(f[1])
    line.delete(w[1])

//bu = ta.crossover(close, mpoint)
//sz = ta.crossunder(close, mpoint)
//bu1 = ta.crossover(close, last_open_short)
sz1 = ta.crossunder(close, last_open_short)
bu2 = ta.crossover(close, last_open_long)
//sz2 = ta.crossunder(close, last_open_long)
//plotshape(sz, style=shape.triangledown, location=location.abovebar, color=color.new(color.orange, 0), size=size.tiny)
//plotshape(bu, style=shape.triangleup, location=location.belowbar, color=color.new(color.blue, 0), size=size.tiny)
//plotshape(sz1, style=shape.triangledown, location=location.abovebar, color=color.new(color.red, 0), size=size.tiny)
//plotshape(bu1, style=shape.triangleup, location=location.belowbar, color=color.new(color.green, 0), size=size.tiny)
//plotshape(sz2, style=shape.triangledown, location=location.abovebar, color=color.new(color.red, 0), size=size.tiny)
//plotshape(bu2, style=shape.triangleup, location=location.belowbar, color=color.new(color.green, 0), size=size.tiny)

l = bu2
s = sz1
if l
    strategy.entry('buy', strategy.long)
if s
    strategy.entry('sell', strategy.short)
per(pcnt) =>
    strategy.position_size != 0 ? math.round(pcnt / 100 * strategy.position_avg_price / syminfo.mintick) : float(na)
stoploss = input.float(title=' stop loss', defval=5, minval=0.01)
los = per(stoploss)
q1 = input.int(title=' qty_percent1', defval=50, minval=1)
q2 = input.int(title=' qty_percent2', defval=50, minval=1)
tp1 = input.float(title=' Take profit1', defval=3, minval=0.01)
tp2 = input.float(title=' Take profit2', defval=5, minval=0.01)
//tp4 = input.float(title=' Take profit4', defval=5, minval=0.01)
strategy.exit('x1', qty_percent=q1, profit=per(tp1), loss=los)
strategy.exit('x2', qty_percent=q2, profit=per(tp2), loss=los)