Chiến lược mua cao và bán thấp dựa trên đường trục vàng
Tổng quan
Chiến lược này sử dụng các điểm chính trong các chu kỳ thời gian khác nhau như là khu vực giá quan trọng, kết hợp với nguyên tắc đường phân chia vàng để đánh giá xu hướng, để thực hiện chiến lược giao dịch mua cao và bán thấp.
Nguyên tắc chiến lược
Tính toán giá đóng cửa, giá cao nhất, giá thấp nhất trong các chu kỳ thời gian khác nhau. Bao gồm giá cổ điển và giá vàng phân chia.
Phân tích vùng giá hiện tại của bạn dựa trên giá phá vỡ lên xuống đường ray. Nó được chia thành 5 khu mua và 5 khu bán.
Đưa ra tín hiệu mua trong khu vực mua, gửi tín hiệu bán trong khu vực bán, sử dụng chiến lược mua cao và bán thấp.
Phân tích lợi thế
Sử dụng nhiều chu kỳ để đánh giá xu hướng và tránh bị lừa bởi tiếng ồn thị trường.
Trong khi đó, kết hợp các điểm cổ điển và các điểm phân chia vàng, tăng độ tin cậy của các điểm.
Xác định thời gian ra thị trường bằng vùng giá, tránh rủi ro thua lỗ tối đa.
Sử dụng chiến lược mua và bán cao, tuân thủ các quy tắc giao dịch theo xu hướng và tránh giao dịch ngược.
Phân tích rủi ro
Có thể bị hỏng, cần chú ý đến việc phá vỡ các điểm hỗ trợ.
Cần ngăn chặn việc theo dõi tổn thất không tốt, làm tăng tổn thất.
Chi phí giao dịch cũng ảnh hưởng đến lợi nhuận cuối cùng.
Hướng tối ưu hóa
Các tham số khác nhau có thể được thử nghiệm, chẳng hạn như tham số chu kỳ thời gian, tham số hướng giao dịch, và các chiến lược tối ưu hóa.
Có thể kết hợp với các chỉ số khác để xác định xu hướng và tránh phá vỡ giả.
Có thể thêm các cơ chế dừng lỗ để kiểm soát tổn thất đơn lẻ.
Tóm tắt
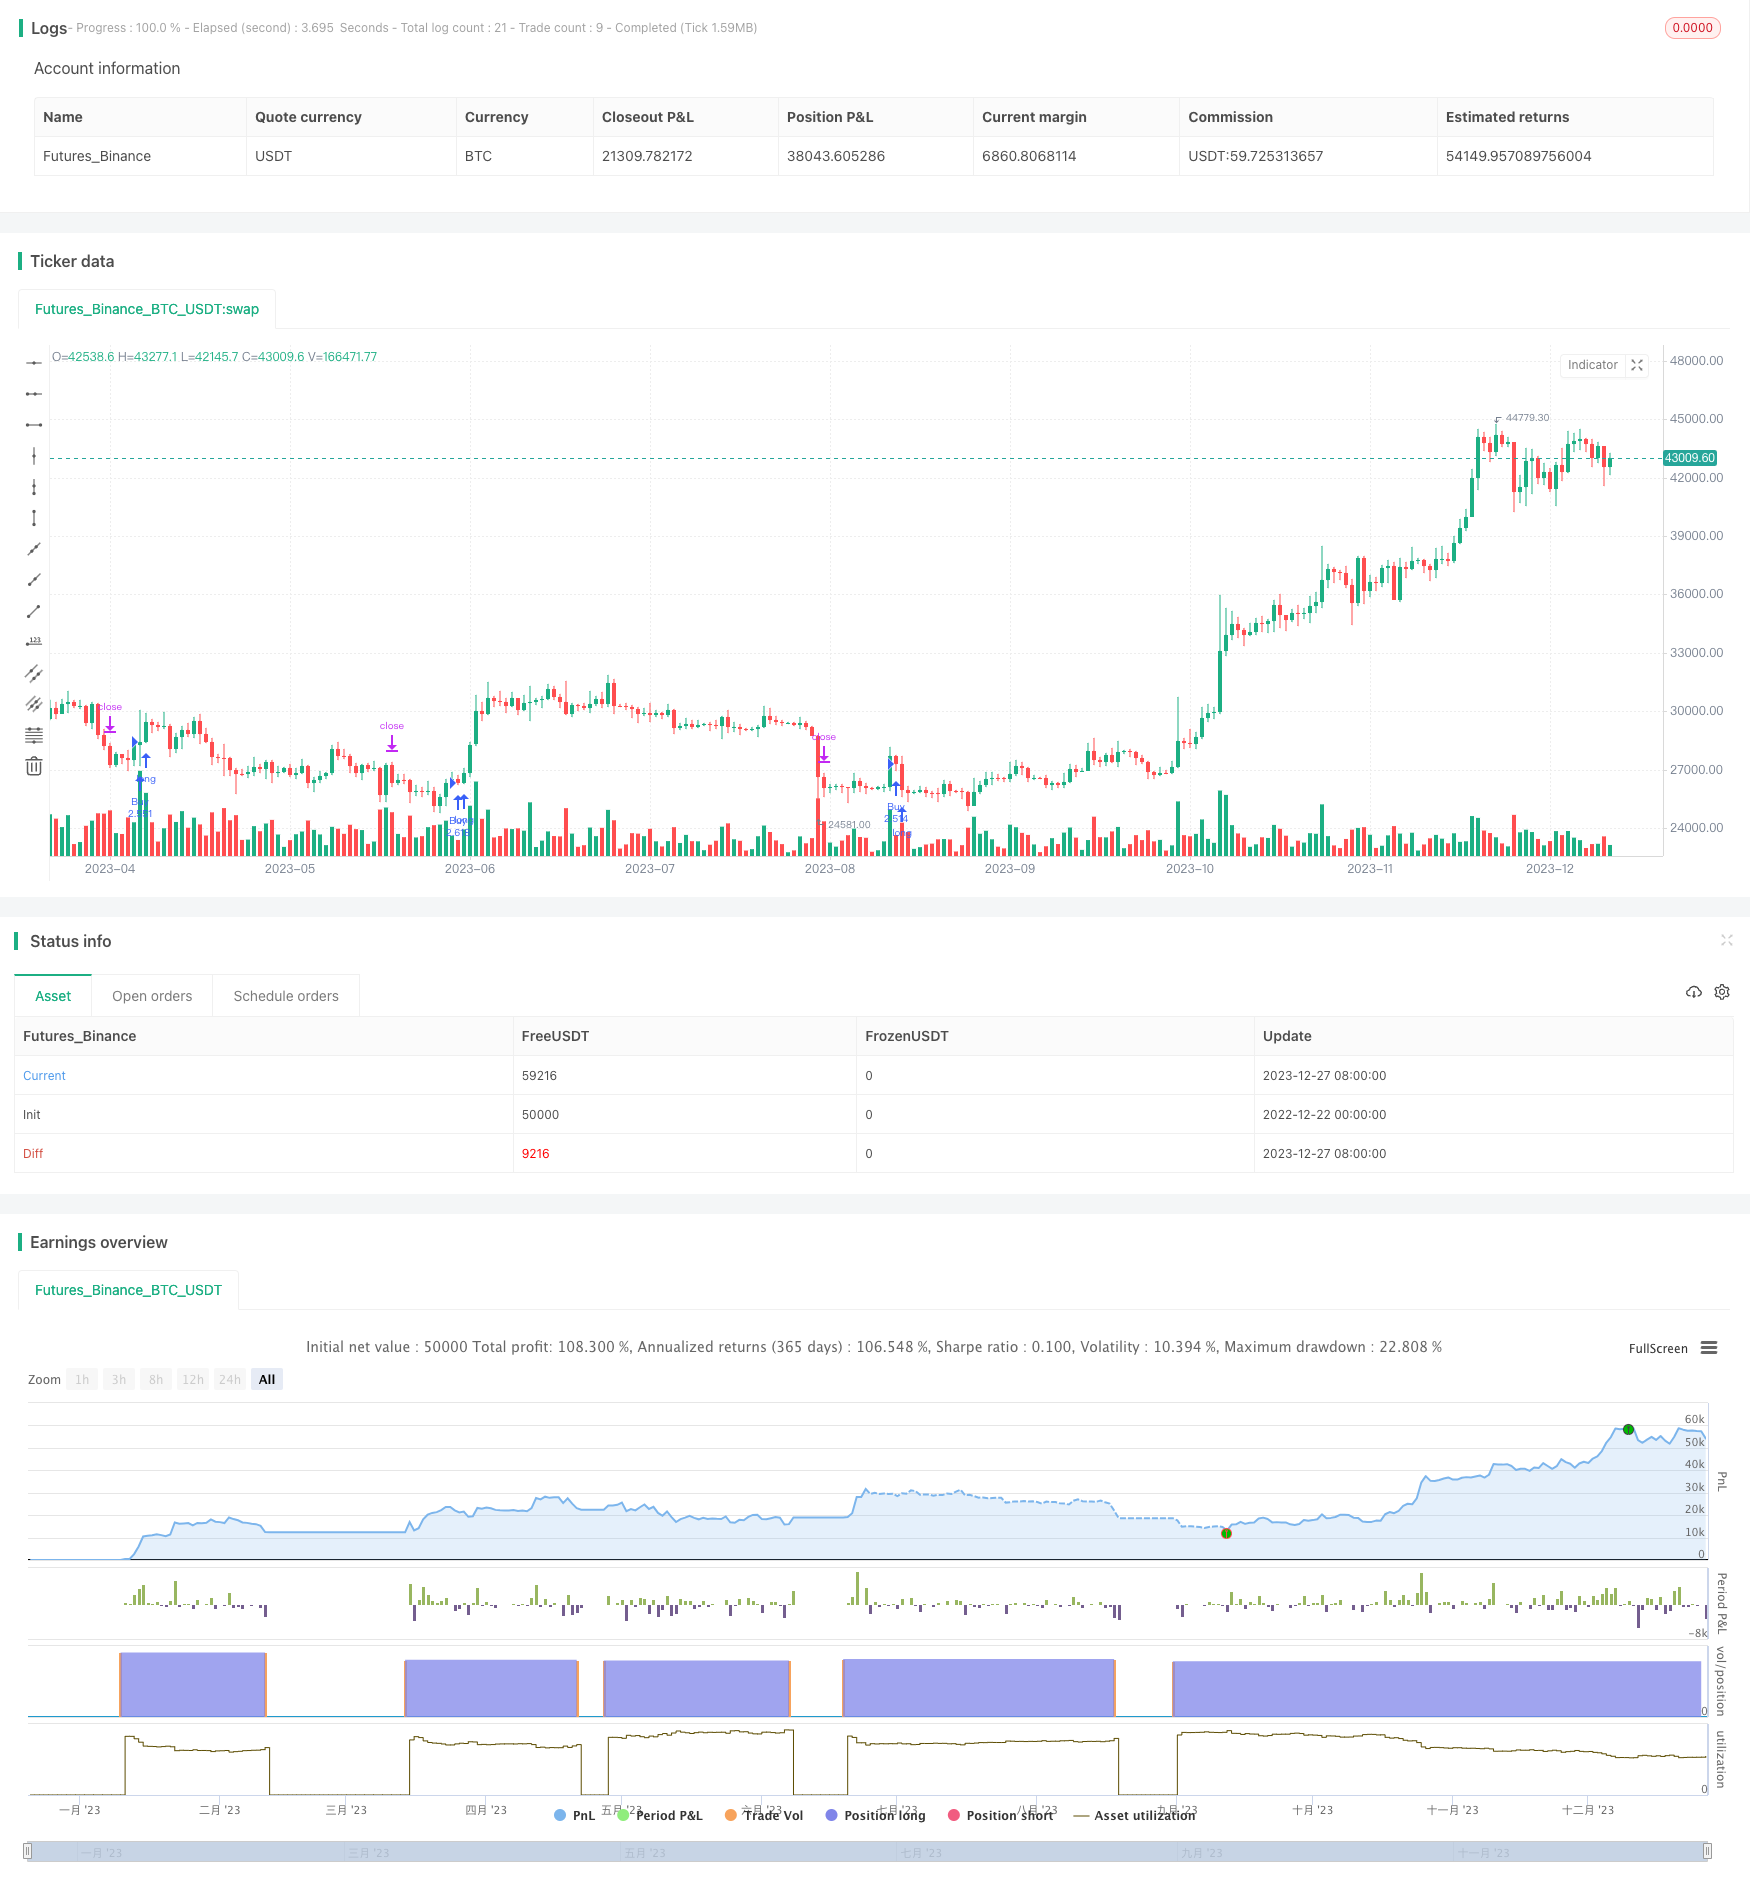
Chiến lược này kết hợp các phương pháp phân tích kỹ thuật cổ điển với chiến lược giao dịch xu hướng, sử dụng các vùng hỗ trợ để xác định thời gian vào thị trường và áp dụng nguyên tắc mua và bán cao, có thể kiểm soát rủi ro giao dịch hiệu quả, đáng để kiểm tra và tối ưu hóa trong thực tế.
/*backtest
start: 2022-12-22 00:00:00
end: 2023-12-28 00:00:00
period: 1d
basePeriod: 1h
exchanges: [{"eid":"Futures_Binance","currency":"BTC_USDT"}]
*/

// This source code is subject to the terms of the Mozilla Public License 2.0 at https://mozilla.org/MPL/2.0/
// © HeWhoMustNotBeNamed

//@version=4
strategy("BuyHighSellLow - Pivot points", overlay=true, initial_capital = 100000, default_qty_type = strategy.percent_of_equity, default_qty_value = 100, commission_type = strategy.commission.percent, pyramiding = 1, commission_value = 0.01, calc_on_order_fills = true)
Source = input(close)
resolution = input("4D", type=input.resolution)
HTFMultiplier = input(4, title="Higher Timeframe multiplier (Used when resolution is set to Same as Symbol)", minval=2, step=1)
//ppType = input(title="Pivot points type", defval="classic", options=["classic", "fib"])
ppType = "fib"
tradeDirection = input(title="Trade Direction", defval=strategy.direction.long, options=[strategy.direction.all, strategy.direction.long, strategy.direction.short])
backtestBars = input(title="Backtest from ", defval=10, minval=1, maxval=30)
backtestFrom = input(title="Timeframe", defval="years", options=["days", "months", "years"])
hideBands = input(true)
f_multiple_resolution(HTFMultiplier) =>
    target_Res_In_Min = timeframe.multiplier * HTFMultiplier * (
      timeframe.isseconds   ? 1. / 60. :
      timeframe.isminutes   ? 1. :
      timeframe.isdaily     ? 1440. :
      timeframe.isweekly    ? 7. * 24. * 60. :
      timeframe.ismonthly   ? 30.417 * 24. * 60. : na)

    target_Res_In_Min     <= 0.0417       ? "1S"  :
      target_Res_In_Min   <= 0.167        ? "5S"  :
      target_Res_In_Min   <= 0.376        ? "15S" :
      target_Res_In_Min   <= 0.751        ? "30S" :
      target_Res_In_Min   <= 1440         ? tostring(round(target_Res_In_Min)) :
      tostring(round(min(target_Res_In_Min / 1440, 365))) + "D"

f_getBackTestTimeFrom(backtestFrom, backtestBars)=>
    byDate = backtestFrom == "days"
    byMonth = backtestFrom == "months"
    byYear = backtestFrom == "years"

    date = dayofmonth(timenow)
    mth = month(timenow)
    yr = year(timenow)

    leapYearDaysInMonth = array.new_int(12,0)
    array.set(leapYearDaysInMonth,0,31)
    array.set(leapYearDaysInMonth,1,29)
    nonleapYearDaysInMonth = array.new_int(12,0)
    array.set(leapYearDaysInMonth,0,31)
    array.set(leapYearDaysInMonth,1,28)

    restMonths = array.new_int(10,0)
    array.set(leapYearDaysInMonth,0,31)
    array.set(leapYearDaysInMonth,1,30)
    array.set(leapYearDaysInMonth,2,31)
    array.set(leapYearDaysInMonth,3,30)
    array.set(leapYearDaysInMonth,4,31)
    array.set(leapYearDaysInMonth,5,31)
    array.set(leapYearDaysInMonth,6,30)
    array.set(leapYearDaysInMonth,7,31)
    array.set(leapYearDaysInMonth,8,30)
    array.set(leapYearDaysInMonth,9,31)

    array.concat(leapYearDaysInMonth,restMonths)
    array.concat(nonleapYearDaysInMonth,restMonths)
    isLeapYear = yr % 4 == 0 and (year%100 != 0 or year%400 == 0)
    numberOfDaysInCurrentMonth = isLeapYear ? array.get(leapYearDaysInMonth, mth-2) : array.get(nonleapYearDaysInMonth, mth-2)
    if(byDate)
        mth := (date - backtestBars) < 0 ? mth - 1 : mth
        yr := mth < 1 ? yr - 1 : yr
        mth := mth < 1 ? 1 : mth
        date := (date - backtestBars) < 0 ? numberOfDaysInCurrentMonth - backtestBars + date + 1 : date - backtestBars + 1
    if(byMonth)
        date := 1
        yr := (mth - (backtestBars%12)) < 0 ? yr - int(backtestBars/12) - 1 : yr - int(backtestBars/12)
        mth := mth - (backtestBars%12) + 1
    if(byYear)
        date := 1
        mth := 1
        yr := yr - backtestBars
    [date, mth, yr]

f_secureSecurity(_symbol, _res, _src) => security(_symbol, _res, _src[1], lookahead = barmerge.lookahead_on)

f_getClassicPivots(HIGHprev, LOWprev, CLOSEprev)=>
    PP = (HIGHprev + LOWprev + CLOSEprev) / 3
    R1 = PP * 2 - LOWprev
    S1 = PP * 2 - HIGHprev
    R2 = PP + (HIGHprev - LOWprev)
    S2 = PP - (HIGHprev - LOWprev)
    R3 = PP * 2 + (HIGHprev - 2 * LOWprev)
    S3 = PP * 2 - (2 * HIGHprev - LOWprev)
    R4 = PP * 3 + (HIGHprev - 3 * LOWprev)
    S4 = PP * 3 - (3 * HIGHprev - LOWprev)
    R5 = PP * 4 + (HIGHprev - 4 * LOWprev)
    S5 = PP * 4 - (4 * HIGHprev - LOWprev)
    [R5, R4, R3, R2, R1, PP, S1, S2, S3, S4, S5]

f_getFibPivots(HIGHprev, LOWprev, CLOSEprev)=>
    PP = (HIGHprev + LOWprev + CLOSEprev) / 3
    R1 = PP + 0.382 * (HIGHprev - LOWprev)
    S1 = PP - 0.382 * (HIGHprev - LOWprev)
    R2 = PP + 0.618 * (HIGHprev - LOWprev)
    S2 = PP - 0.618 * (HIGHprev - LOWprev)
    R3 = PP + (HIGHprev - LOWprev)
    S3 = PP - (HIGHprev - LOWprev)
    R4 = PP + 1.41 * (HIGHprev - LOWprev)
    S4 = PP - 1.41 * (HIGHprev - LOWprev)
    R5 = PP + 1.65 * (HIGHprev - LOWprev)
    S5 = PP - 1.65 * (HIGHprev - LOWprev)
    [R5, R4, R3, R2, R1, PP, S1, S2, S3, S4, S5]

f_getPivotPoints(HTFMultiplier, resolution, ppType)=>
    derivedResolution = resolution == ""? f_multiple_resolution(HTFMultiplier) : resolution
    HIGHprev = f_secureSecurity(syminfo.tickerid, derivedResolution, high)
    LOWprev = f_secureSecurity(syminfo.tickerid, derivedResolution, low)
    CLOSEprev = f_secureSecurity(syminfo.tickerid, derivedResolution, close)
    [R5, R4, R3, R2, R1, PP, S1, S2, S3, S4, S5] = f_getClassicPivots(HIGHprev, LOWprev, CLOSEprev)
    [Rf5, Rf4, Rf3, Rf2, Rf1, PPf, Sf1, Sf2, Sf3, Sf4, Sf5] = f_getFibPivots(HIGHprev, LOWprev, CLOSEprev)
    [R5, R4, R3, R2, R1, PP, S1, S2, S3, S4, S5]

f_getState(Source, R5, R4, R3, R2, R1, PP, S1, S2, S3, S4, S5)=>
    state =
     Source > R5 ? 5 :
     Source > R4 ? 4 :
     Source > R3 ? 3 :
     Source > R2 ? 2 :
     Source > R1 ? 1 :
     Source > PP ? 0 :
     Source > S1 ? -1 :
     Source > S2 ? -2 :
     Source > S3 ? -3 :
     Source > S4 ? -4 :
     Source > S5 ? -5 : -6
    state

[R5, R4, R3, R2, R1, PP, S1, S2, S3, S4, S5] = f_getPivotPoints(HTFMultiplier, resolution, ppType)

[date, mth, yr] = f_getBackTestTimeFrom(backtestFrom, backtestBars)
inDateRange = time >= timestamp(syminfo.timezone, yr, mth, date, 0, 0)

BBU5 = plot(not hideBands ? R5: na, title="R5", color=color.orange, linewidth=1, transp=50, style=plot.style_linebr)
BBU4 = plot(not hideBands ? R4: na, title="R4", color=color.yellow, linewidth=1, transp=50, style=plot.style_linebr)
BBU3 = plot(not hideBands ? R3: na, title="R3", color=color.navy, linewidth=1, transp=50, style=plot.style_linebr)
BBU2 = plot(not hideBands ? R2: na, title="R2", color=color.olive, linewidth=1, transp=50, style=plot.style_linebr)
BBU1 = plot(not hideBands ? R1: na, title="R1", color=color.lime, linewidth=1, transp=50, style=plot.style_linebr)
BBM4 = plot(not hideBands ? PP:na, title="PP", color=color.black, linewidth=2, style=plot.style_linebr)
BBL1 = plot(not hideBands ? S1: na, title="S1", color=color.lime, linewidth=1, transp=50, style=plot.style_linebr)
BBL2 = plot(not hideBands ? S2: na, title="S2", color=color.olive, linewidth=1, transp=50, style=plot.style_linebr)
BBL3 = plot(not hideBands ? S3: na, title="S3", color=color.navy, linewidth=1, transp=50, style=plot.style_linebr)
BBL4 = plot(not hideBands ? S4: na, title="S4", color=color.yellow, linewidth=1, transp=50, style=plot.style_linebr)
BBL5 = plot(not hideBands ? S5: na, title="S5", color=color.orange, linewidth=1, transp=50, style=plot.style_linebr)


fill(BBU5, BBU4, title="RZ5", color=color.green, transp=90)
fill(BBU4, BBU3, title="RZ4", color=color.lime, transp=90)
fill(BBU3, BBU2, title="RZ3", color=color.olive, transp=90)
fill(BBU2, BBU1, title="RZ2", color=color.navy, transp=90)
fill(BBU1, BBM4, title="RZ1", color=color.yellow, transp=90)
fill(BBM4, BBL1, title="SZ1", color=color.orange, transp=90)
fill(BBL1, BBL2, title="SZ2", color=color.red, transp=90)
fill(BBL2, BBL3, title="SZ3", color=color.maroon, transp=90)
fill(BBL3, BBL4, title="SZ4", color=color.maroon, transp=90)
fill(BBL4, BBL5, title="SZ5", color=color.maroon, transp=90)

strategy.risk.allow_entry_in(tradeDirection)
longCondition = crossover(Source[1],R1) and inDateRange
shortCondition = crossunder(Source[1], S2) and inDateRange

strategy.entry("Buy", strategy.long, when=longCondition, oca_name="oca")
strategy.entry("Sell", strategy.short, when=shortCondition, oca_name="oca")