Chiến lược đột phá động lượng đa khung thời gian
Tổng quan
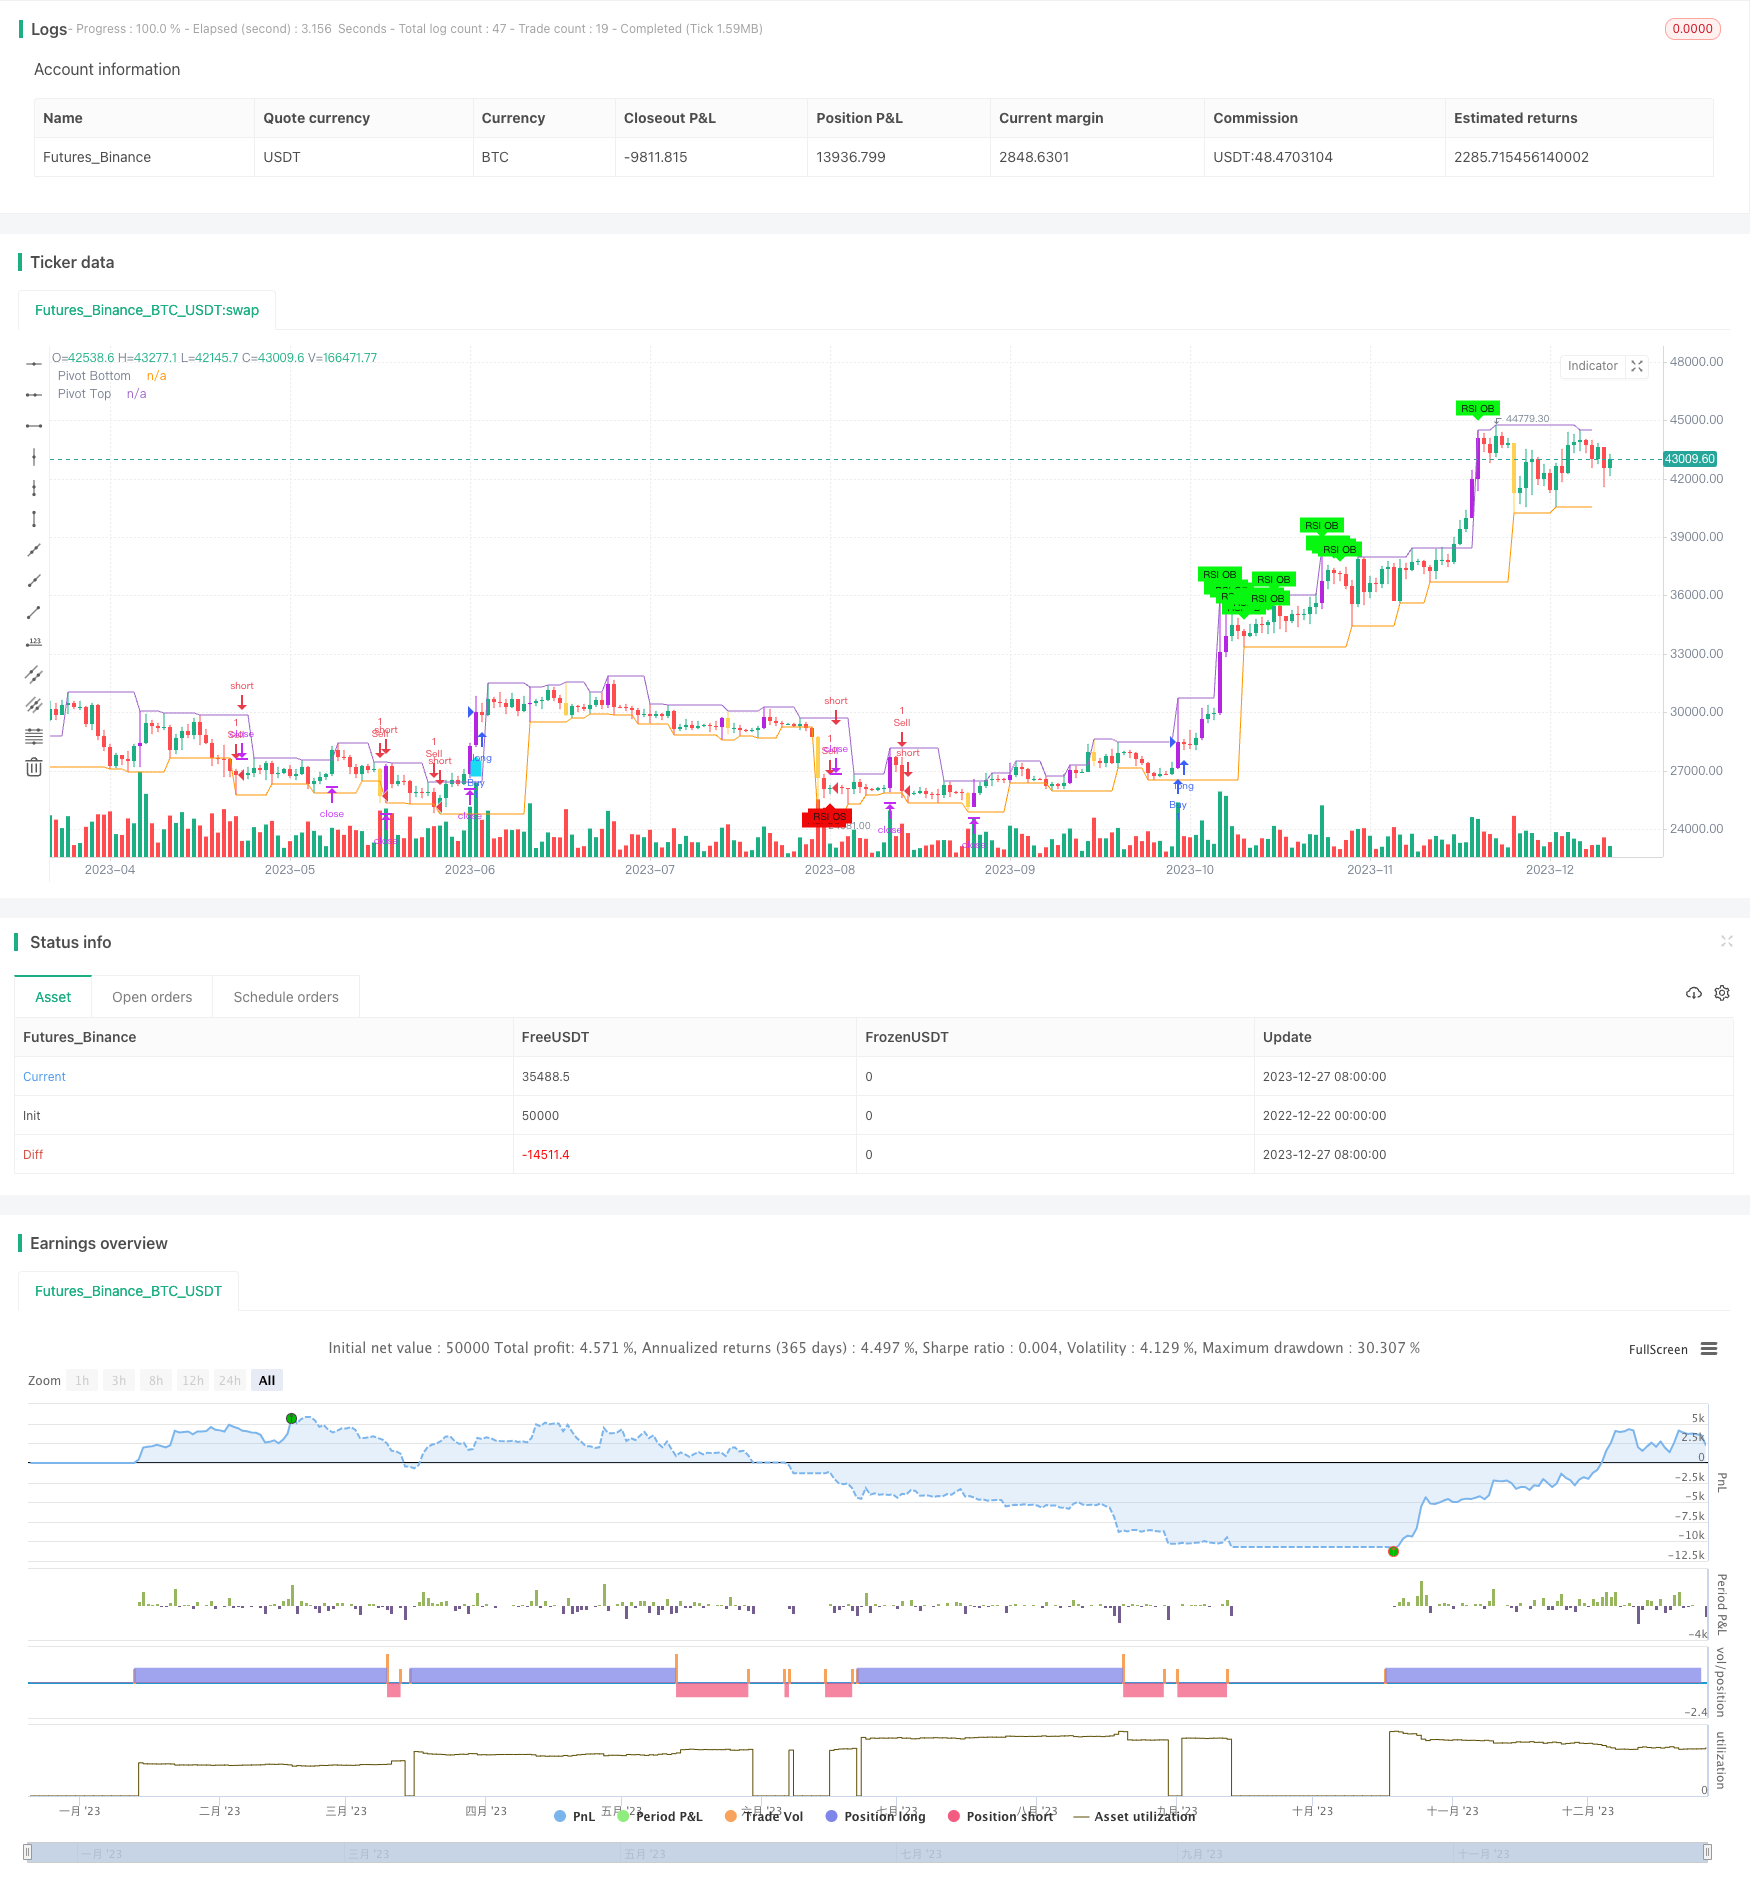
Chiến lược này kết hợp nhiều chỉ số kỹ thuật như RSI, ADX, ATR và chỉ số động lực để đánh giá xu hướng và bắt điểm phá vỡ. Chiến lược này cũng kết hợp đường lùi Fibonacci và đường trung bình để tăng thêm độ chính xác trong việc đánh giá các điểm quan trọng và xu hướng.
Nguyên tắc chiến lược
Các chỉ số RSI, ADX, DI +, DI- để xác định định hướng và cường độ của xu hướng. RSI có thể phản ánh tình trạng quá mua quá bán, ADX phản ánh cường độ của xu hướng, DI + / DI- để xác định xu hướng đa đầu và trống. Các giá trị chỉ số này được hiển thị trong bảng ở góc trên bên phải, để dễ dàng xác định.
Kết hợp đường trung bình để đánh giá xu hướng. Sử dụng EMA ngày 5 và 9 để đánh giá xu hướng ngắn hạn, WMA ngày 21 để đánh giá xu hướng trung hạn, WMA ngày 60 để đánh giá xu hướng dài hạn.
Sử dụng đường rút lui Fibonacci để tìm các điểm hỗ trợ quan trọng như 0.5, 0.618. Những điểm này thường là điểm đảo ngược tiềm năng.
Thiết lập giá dừng dựa trên ATR và tỷ lệ dừng để kiểm soát rủi ro. Thiết lập giá dừng dựa trên ATR và tỷ lệ dừng để khóa lợi nhuận.
Khi RSI vượt quá tín hiệu mua bán, hãy xem xét quay ngược vào. Khi đường trung bình ngắn hạn đi trên đường trung bình dài hạn và khối lượng giao dịch tăng lên, hãy xem xét theo dõi xu hướng vào. Sau khi vào tín hiệu, thiết lập dừng lỗ và dừng lại.
Phân tích lợi thế
Sử dụng tổng hợp nhiều chỉ số để đánh giá xu hướng và cường độ, cải thiện độ chính xác của quyết định.
Cơ chế dừng lỗ dựa trên ATR, kiểm soát rủi ro hiệu quả.
Kết hợp các điểm quan trọng Fibonacci, cải thiện độ chính xác của phán đoán điểm đảo ngược.
Lượng giao dịch tăng lên như một điều kiện phụ để theo dõi xu hướng và tránh phá vỡ giả.
Bảng hiển thị trực quan giá trị hiện tại của nhiều chỉ số, giúp đưa ra quyết định nhanh chóng.
Phân tích rủi ro
Tỷ lệ tín hiệu sai của chỉ số không thể tránh được hoàn toàn, dẫn đến nguy cơ hoạt động sai. Các tham số của chỉ số có thể được tối ưu hóa bằng cách điều chỉnh tham số.
Thiết lập ATR và tỷ lệ dừng sẽ ảnh hưởng đến điểm dừng thực tế. Thiết lập tỷ lệ quá lớn quá nhỏ sẽ mang lại một số rủi ro, cần thiết phải cân bằng.
Việc tăng khối lượng giao dịch như một điều kiện nhập cảnh cũng không thể hoàn toàn tránh được sự xuất hiện của đột phá giả, cần phải kết hợp với chi tiết về tình hình giá cả.
Điểm Fibonacci cũng không chắc chắn một phần trăm, giá có thể vượt qua nó.
Hướng tối ưu hóa
Kiểm tra và tối ưu hóa các tham số như RSI, ADX, ATR để tìm ra sự kết hợp tham số tốt nhất.
Kiểm tra các kết hợp đường trung bình khác nhau để xác định kết hợp đường trung bình nào là tốt nhất để xác định hiệu quả của xu hướng.
Kiểm tra các tham số tỷ lệ dừng lỗ khác nhau để tìm ra tham số tối ưu cho lợi nhuận rủi ro.
Có thể xem xét thêm chỉ số BollingerBands để xác định hiệu quả của khối lượng giao dịch lớn hơn.
Tóm tắt
Chiến lược này sử dụng nhiều phương tiện kỹ thuật như đánh giá xu hướng, đánh giá điểm quan trọng, phân tích khối lượng giao dịch. Bằng cách tối ưu hóa tham số, tiếp tục nâng cao độ chính xác và lợi nhuận của phán đoán. Thiết lập dừng lỗ kiểm soát rủi ro, tối đa hóa lợi nhuận. Chiến lược này tốt hơn trong việc đánh giá xu hướng đường dài trung bình và nắm bắt hiệu quả đảo ngược ngắn hạn. Bằng cách kiểm tra tối ưu hóa liên tục, chiến lược có thể trở nên ổn định và đáng tin cậy hơn.
/*backtest
start: 2022-12-22 00:00:00
end: 2023-12-28 00:00:00
period: 1d
basePeriod: 1h
exchanges: [{"eid":"Futures_Binance","currency":"BTC_USDT"}]
*/

// This source code is subject to the terms of the Mozilla Public License 2.0 at https://mozilla.org/MPL/2.0/
// © amit74sharma135

//@version=5

strategy(" KritikSharma Strategy for NIFTY,BNIFTY,NG,CRUDE,WTICrude,BTC,GOLD,SILVER,COPPER", overlay=true)
plotHVB = input.bool(defval=true, title='Plot HVB')
plotPVT = input.bool(defval=false, title='Plot Pivots')
hvbEMAPeriod = input.int(defval=12, minval=1, title='Volume EMA Period')
hvbMultiplier = input.float(defval=1.5, title='Volume Multiplier')
pivotLookup = input.int(defval=2, minval=1, maxval=15, title='Pivot Lookup')
ShowAvg1 = input(false, title="Show trend line", group="TREND LINE Moving Average", tooltip="Display a trend line based on EMA.")
showLines1 = input.bool(defval=false, title="Draw EMA,WMA Line")
ema200_length= input.int(defval=200, minval=1, maxval=500, title='ema1')
ema300_length= input.int(defval=300, minval=1, maxval=500, title='ema2')
wma60_length= input.int(defval=60, minval=1, maxval=100, title='wma60')
ema5 = ta.ema(close, 5)
ema9 = ta.ema(close, 9)
wma21=ta.wma(close,21)
wma60=ta.wma(close,wma60_length)
len1 = input.int(11, minval=1, maxval=500, title="Length", group="TREND LINE Moving Average", tooltip="Set EMA length.")
ema=ta.ema(close, len1)
rsiLength = input.int(14, title="RSI Length", minval=1, maxval=50, group="Table ADX, RSI, DI values with Red, Green, Yellow Signal")
adxLength = input.int(14, title="ADX Length", minval=1, maxval=50, group="Table ADX, RSI, DI values with Red, Green, Yellow Signal")
adxThreshold = input.int(20, title="ADX Threshold", group="Table ADX, RSI, DI values with Red, Green, Yellow Signal")
diThreshold = input.int(25, title="DI Threshold", group="Table ADX, RSI, DI values with Red, Green, Yellow Signal")
atr = input.int(14, title="ATR values", group="Table ADX, RSI, DI values with Red, Green, Yellow Signal")
////////////////////////////////////////////////

hvbBullColor = color.rgb(181, 37, 225)
hvbBearColor = #ffbb00ad

pvtTopColor = color.new(#154bef, 0)
pvtBottomColor = color.new(#b81657, 0)

//////////////////// Pivots ////////////////////
hih = ta.pivothigh(high, pivotLookup, pivotLookup)
lol = ta.pivotlow(low , pivotLookup, pivotLookup)
top1 = ta.valuewhen(hih, high[pivotLookup], 0)
bottom1 = ta.valuewhen(lol, low [pivotLookup], 0)
plot(top1, offset=-pivotLookup, linewidth=1, color=(top1 != top1[1] ? na : (plotPVT ? pvtTopColor : na)), title="Pivot Top")
plot(bottom1, offset=-pivotLookup, linewidth=1, color=(bottom1 != bottom1[1] ? na : (plotPVT ? pvtBottomColor : na)), title="Pivot Bottom")

//////////////////////////////////////Functions
isUp(index) =>
    close[index] > open[index]

isDown(index) =>
    close[index] < open[index]

isObUp(index) =>
    isDown(index + 1) and isUp(index) and close[index] > high[index + 1]

isObDown(index) =>
    isUp(index + 1) and isDown(index) and close[index] < low[index + 1]
////////////////// High Volume Bars //////////////////
volEma = ta.ema(volume, hvbEMAPeriod)
isHighVolume = volume > (hvbMultiplier * volEma)
barcolor(plotHVB and isUp(0) and isHighVolume ? hvbBullColor : na, title="Bullish HVB")
barcolor(plotHVB and isDown(0) and isHighVolume ? hvbBearColor : na, title="Bearish HVB")

// Calculate ADX, DI+,  DI-,RSI,ATR
[diplus, diminus, adx] = ta.dmi(adxLength, adxThreshold)
rsi=ta.rsi(close,rsiLength)
atrValue=ta.atr(atr)

// Check for oversold,Overbought condition
oversold_condition = rsi < 20
overbought_condition = rsi > 80

// Plot Trend Line
trendColor = ema5 > ema9 ? color.rgb(22, 203, 28) : ema5 < ema9 ? color.rgb(224, 15, 15) : na
plot(ShowAvg1? ema:na, color=trendColor, linewidth=6, title="Trend Line Upper Ribbon")

/////////////////////////plot ema,wma
plot(showLines1 ? ta.ema(close, ema200_length) : na, color=color.rgb(102, 110, 103), style=plot.style_line, title="ema1",linewidth = 4)
plot(showLines1 ? ta.ema(close, ema300_length) : na, color=color.rgb(18, 20, 18), style=plot.style_line, title="ema2",linewidth = 4)
plot(showLines1 ? ta.wma(close, wma60_length) : na, color=color.rgb(238, 75, 211), style=plot.style_line, title="wma60",linewidth = 3)

// Plot signals with smaller text
plotshape(oversold_condition ? 1 : na, title="RSI Oversold Signal", color=color.rgb(238, 8, 8), style=shape.labelup, location=location.belowbar, text="RSI OS", textcolor=color.rgb(17, 17, 17), size=size.tiny)
plotshape(overbought_condition ? 1 : na, title="RSI Overbought Signal", color=#08f710, style=shape.labeldown, location=location.abovebar, text="RSI OB", textcolor=color.rgb(8, 8, 8), size=size.tiny)
///////////////////////////////////////////////////////////////////////////////////////////////

// Define input options
showTable = input(false, title="Show Table ADX, RSI, DI values with RED, GREEN and YELLOW Signal")
tablePosition = input.string("Top Right", title="Table Position", options=["Top Right", "Top Left", "Top Center", "Bottom Right", "Bottom Left", "Bottom Center"])

// Define colors for the table cells
colorRsi = rsi > 55 ? color.green : rsi < 45 ? color.red : color.yellow
colorDiPlus = diplus > diThreshold ? color.green : color.red
colorDiMinus = diminus > diThreshold ? color.red : color.green
colorAdx = (rsi < 45 and diplus < diThreshold and diminus > diThreshold and adx > adxThreshold) ? color.red :
           (rsi > 55 and diplus > diThreshold and diminus < diThreshold and adx > adxThreshold) ? color.green :
           color.yellow

// Create the table
var table testTable = na
if showTable
    var position = tablePosition == "Top Right" ? position.top_right :
                   tablePosition == "Top Left" ? position.top_left :
                   tablePosition == "Top Center" ? position.top_center :
                   tablePosition == "Bottom Right" ? position.bottom_right :
                   tablePosition == "Bottom Left" ? position.bottom_left :
                   position.bottom_center

    testTable := table.new(position, columns = 4, rows = 2, border_width = 1, border_color = color.black, frame_width = 1, frame_color = color.black)

    // Column Headings
    table.cell(table_id = testTable, column = 0, row = 0, text = " DI+ ", bgcolor=color.aqua, text_color = color.white)
    table.cell(table_id = testTable, column = 1, row = 0, text = " DI- ", bgcolor=color.aqua, text_color = color.white)
    table.cell(table_id = testTable, column = 2, row = 0, text = " ADX ", bgcolor=color.aqua, text_color = color.white)
    table.cell(table_id = testTable, column = 3, row = 0, text = " RSI ", bgcolor=color.aqua, text_color = color.white)

    // Column values
    table.cell(table_id = testTable, column = 0, row = 1, text = str.tostring(math.round(diplus, 0)), bgcolor=colorDiPlus, text_color = color.black)
    table.cell(table_id = testTable, column = 1, row = 1, text = str.tostring(math.round(diminus, 0)), bgcolor=colorDiMinus, text_color = color.black)
    table.cell(table_id = testTable, column = 2, row = 1, text = str.tostring(math.round(adx, 0)), bgcolor=colorAdx, text_color = color.black)
    table.cell(table_id = testTable, column = 3, row = 1, text = str.tostring(math.round(rsi, 0)), bgcolor=colorRsi, text_color = color.black)


// Initialize variables to keep track of the previous condition
var bool prev_oversold = na
var bool prev_overbought = na

plotshape(ta.crossover(ema,wma60) and isHighVolume,  style=shape.labelup, location=location.belowbar, color=#1adaf3,size=size.small)
plotshape(ta.crossunder(ema,wma60) and isHighVolume,  style=shape.labeldown, location=location.abovebar, color=#f30aa9, size=size.small)
//////////////////////////////////////////////////
plotFibRetracement = input.bool(title="Plot Fibonacci Retracement", defval=false)
fibLevel1 = input.float(title="Fibonacci Level", defval=0.5, minval=0, maxval=1, step=0.01)
fibLevel2 = input.float(title="Fibonacci Level", defval=0.618, minval=0, maxval=1, step=0.01)
fibLevel3 = input.float(title="Fibonacci Level", defval=0.368, minval=0, maxval=1, step=0.01)
// Calculate Fibonacci Levels
highPrice = ta.highest(high, 100)
lowPrice = ta.lowest(low, 100)
priceRange = highPrice - lowPrice
fibonacciLevel1 = lowPrice + priceRange * fibLevel1
fibonacciLevel2 = lowPrice + priceRange * fibLevel2
fibonacciLevel3 = lowPrice + priceRange * fibLevel3

// Plot Fibonacci Levels
if plotFibRetracement
    line.new(x1=bar_index[1], y1=fibonacciLevel1, x2=bar_index, y2=fibonacciLevel1, color=color.blue, width=2)
    line.new(x1=bar_index[1], y1=fibonacciLevel2, x2=bar_index, y2=fibonacciLevel2, color=color.blue, width=2)
    line.new(x1=bar_index[1], y1=fibonacciLevel3, x2=bar_index, y2=fibonacciLevel3, color=color.blue, width=2)
// Draw Trendline
var float trendlineY1 = na
var float trendlineY2 = na

if bar_index % 50 == 0
    trendlineY1 := low
    trendlineY2 := high

// line.new(x1=bar_index, y1=trendlineY1, x2=bar_index - 100, y2=trendlineY2, color=#3708a5, width=2)

////////////////////////////////////////////////entry, exit, profit booking, stoploss///////////////////////
if (rsi > 63 and adx> adxThreshold and diplus>diThreshold)
    strategy.entry("Buy", strategy.long, qty = 1)

if (rsi < 40 and adx> adxThreshold and diminus>diThreshold)
    strategy.entry("Sell", strategy.short, qty = 1)

// Set stop loss and take profit levels
stop_loss = input(1.5, title = "Stop Loss (%)") * atrValue
take_profit = input(4.0, title = "Take Profit (%)") * atrValue
strategy.exit("Take Profit/Stop Loss", from_entry = "Buy", stop = close - stop_loss, limit = close + take_profit)
strategy.exit("Take Profit/Stop Loss", from_entry = "Sell", stop = close + stop_loss, limit = close - take_profit)
////////////////////////