Chiến lược chuyển kênh Mobile Vegas
Ngày tạo:
2024-01-02 10:53:06
sửa đổi lần cuối:
2024-01-02 10:53:06
sao chép:
7
Số nhấp chuột:
1491
1
tập trung vào
1750
Người theo dõi
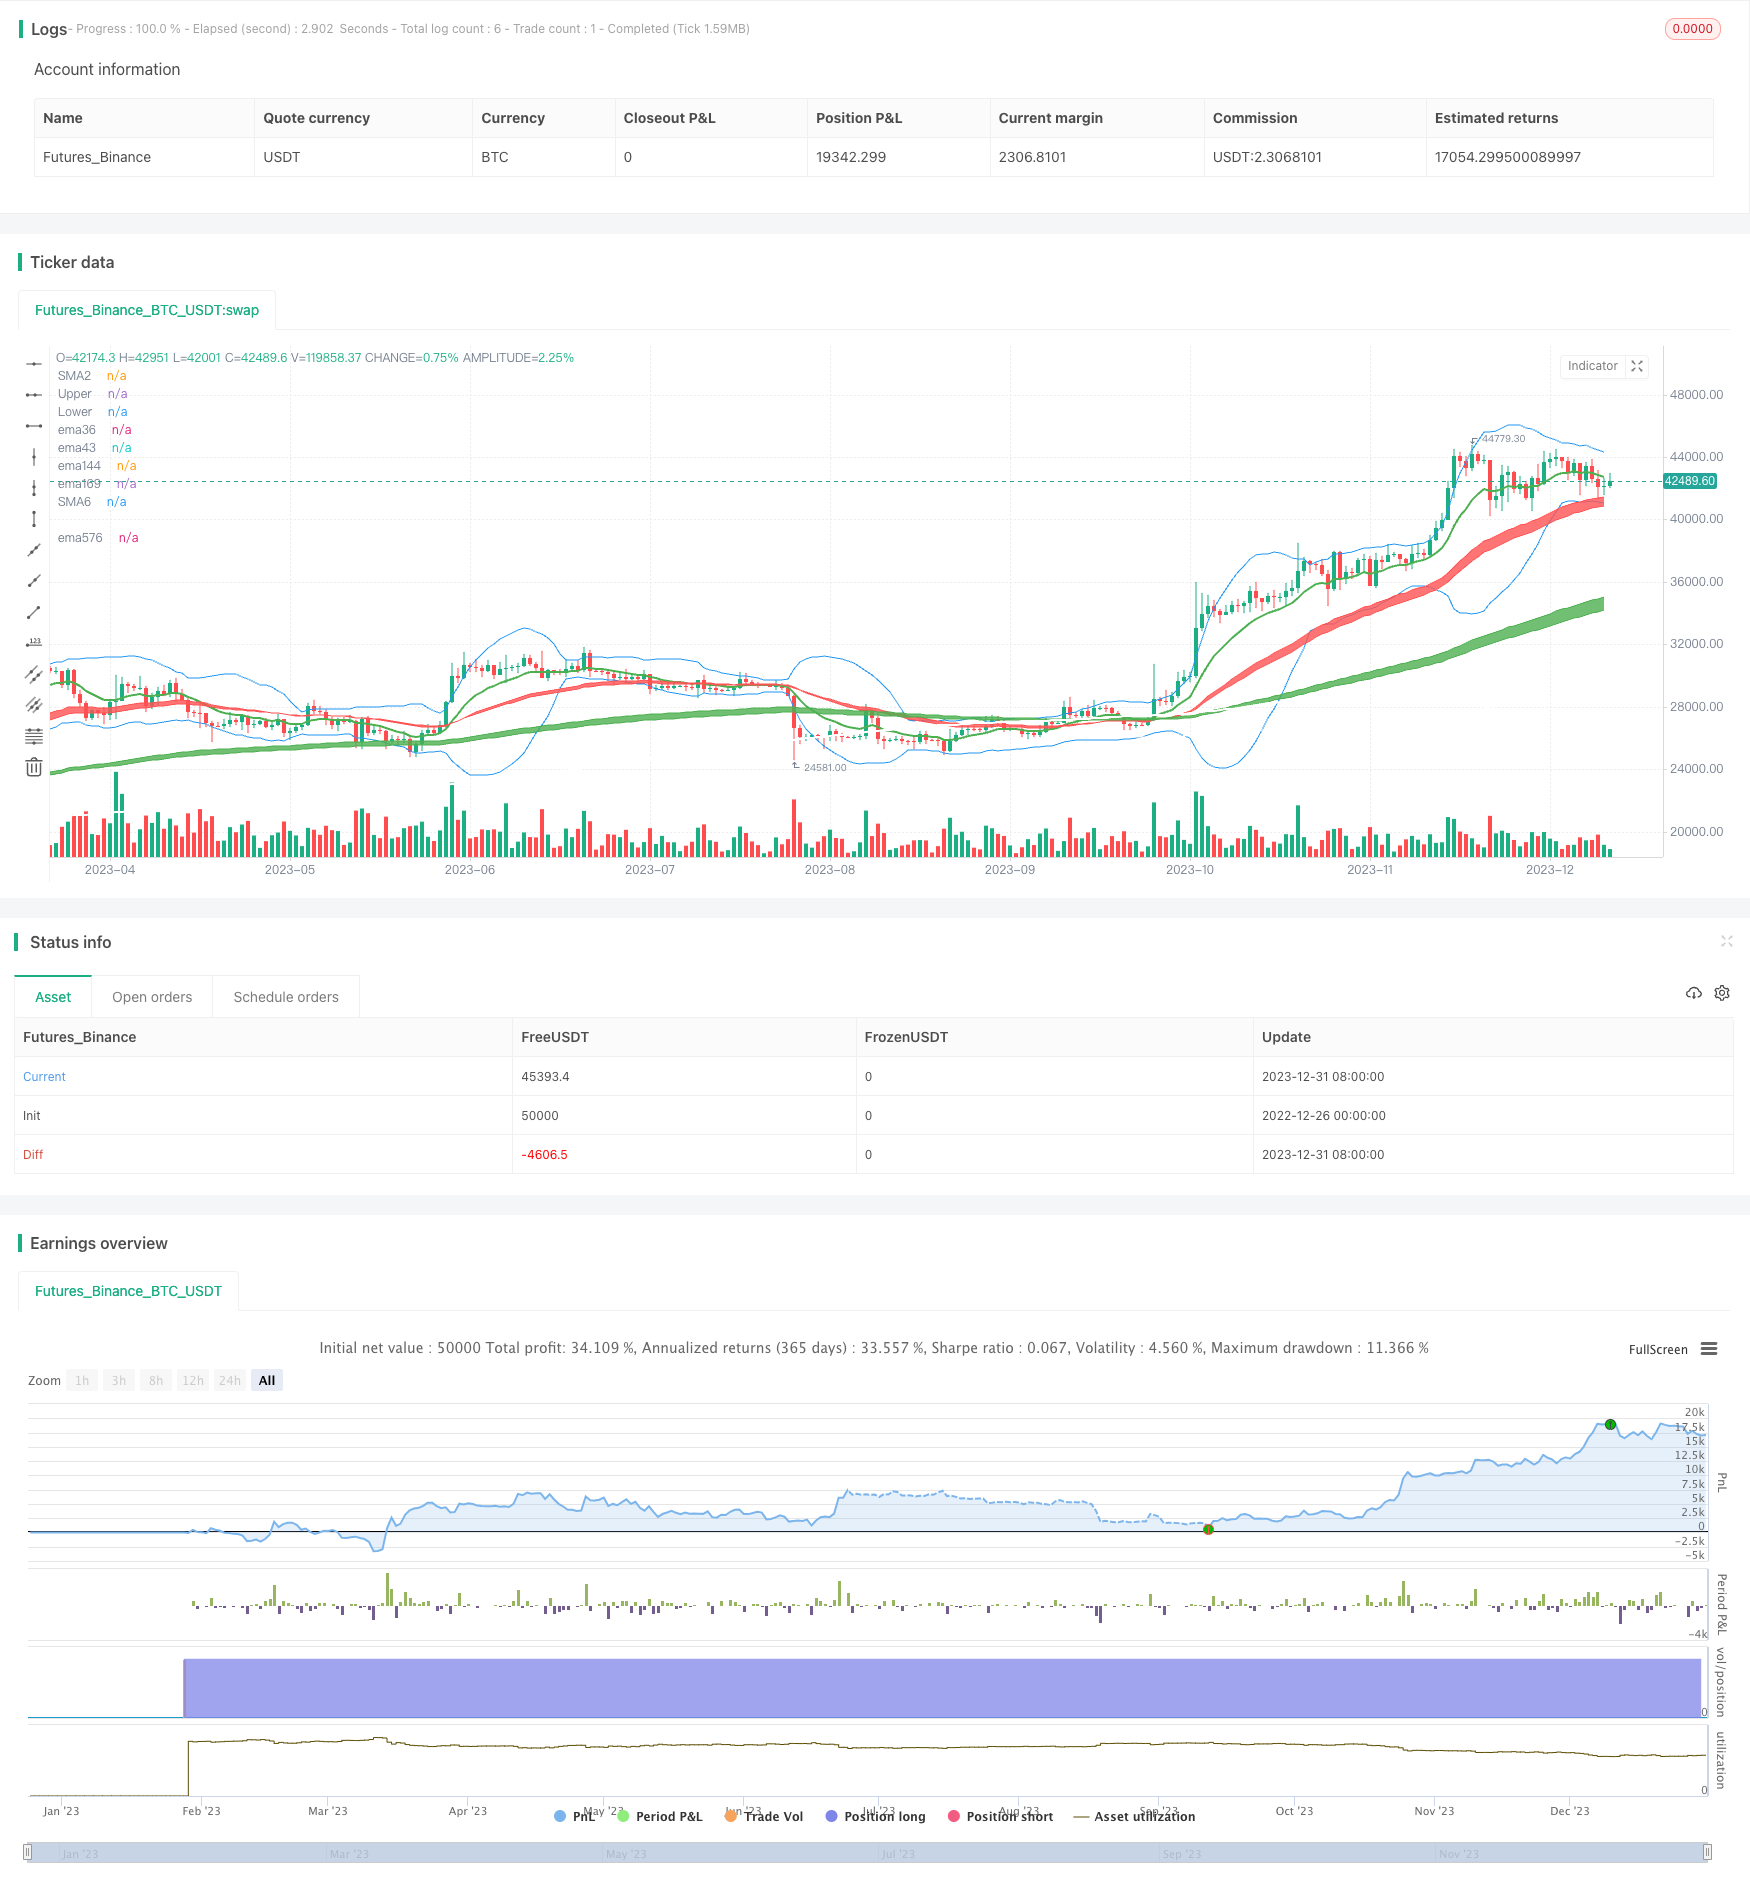
Ý tưởng cốt lõi của chiến lược này là đánh giá xu hướng ngắn hạn và dài hạn của cổ phiếu dựa trên đường trung bình của các chu kỳ khác nhau như EMA 36,143,169, kết hợp với chỉ số MACD để phát ra tín hiệu mua và bán. Cụ thể, đánh giá ngắn hạn bằng EMA 5-10 ngày, đánh giá trung hạn bằng EMA 20-60 ngày, đánh giá dài hạn bằng EMA 120-250 ngày, xem nhiều hơn khi EMA ngắn hạn vượt qua EMA trung hạn, xem ít hơn; kết hợp với chỉ số không có nhiều của MACD để đánh giá thời gian mua và bán.
Các nguyên tắc của chiến lược Vegas Tunnel:
- Sử dụng EMA36 và EMA43 để xây dựng phán đoán xu hướng ngắn hạn, chúng tạo thành kênh đỏ;
- Sử dụng EMA144 và EMA169 để xây dựng phán đoán xu hướng trung hạn, chúng tạo thành kênh xanh;
- Sử dụng EMA576 và EMA676 để xây dựng phán đoán xu hướng dài hạn, chúng tạo thành kênh xám;
- Khi giá dừng ở các đường EMA, nó có thể làm nhiều hơn, và kết hợp với MACD chỉ số để tạo ra tín hiệu mua khi nó vượt qua 0;
- Khi giá giảm xuống các đường trung bình của EMA, nó có thể bị hỏng, sau đó kết hợp với MACD để phá vỡ 0 xuống và phát ra tín hiệu bán.
- Ba chiến lược giao dịch được chia thành ngắn, trung và dài theo chu kỳ đường trung bình EMA, tương ứng với các chu kỳ nắm giữ khác nhau.
Những ưu điểm của chiến lược này bao gồm:
- Trong khi đó, kết hợp ba kênh ngắn, trung bình và dài để đánh giá xu hướng, nó khá ổn định.
- Các kênh Vegas rất rõ ràng, trực quan và dễ dàng đánh giá xu hướng.
- Kết hợp với chỉ số MACD sẽ giúp bạn nắm bắt được thời điểm tốt nhất để mua và bán.
- Các chiến lược ngắn và dài có thể được sử dụng một cách linh hoạt hơn.
Những rủi ro chính của chiến lược này:
- Khi giá cổ phiếu dao động mạnh, đường trung bình EMA tạo ra sự chậm trễ, có khả năng đánh giá sai.
- Khi 3 kênh không đồng nhất, có nguy cơ bị sai lệch.
- Điều khiển bản đồ thời gian đòi hỏi khả năng chịu đựng tinh thần mạnh mẽ hơn.
Phản ứng:
- Chu kỳ đường trung bình EMA có thể được điều chỉnh thích hợp để phù hợp hơn với đặc điểm thị trường hiện tại.
- Điều chỉnh tỷ lệ nắm giữ trước khi giao dịch, kiểm soát tổn thất đơn lẻ.
Không gian tối ưu hóa chiến lược:
- Không đủ để phân biệt xu hướng Vegas Channel, có thể đưa ra phán quyết phụ trợ của Brink Channel.
- Chỉ số MACD có thể thay thế bằng các chỉ số như KD, RSI.
- Thêm chiến lược dừng lỗ, chẳng hạn như dừng lỗ chủ động khi giá đóng cửa vượt qua EMA quan trọng.
- Cụ thể, A có thể bị ảnh hưởng bởi sự sụt giảm giá của cổ phiếu A, và có thể được coi là một loại ETF bị giảm giá.
Mã nguồn chiến lược
/*backtest
start: 2022-12-26 00:00:00
end: 2024-01-01 00:00:00
period: 1d
basePeriod: 1h
exchanges: [{"eid":"Futures_Binance","currency":"BTC_USDT"}]
*/

//@version=4

strategy("Vegas Tunnel strategy", overlay=true)
//-------------------------------------------
//-------------------------------------------
// Inputs
useCurrentRes = input(true, title="Use Current Chart Resolution?")
resCustom = input(title="Use Different Timeframe? Uncheck Box Above", type=input.resolution, defval="D")
//tfSet = input(title = "Time Frame", options=["Current","120", "240", "D", "W"], defval="D")
tfSet = useCurrentRes ? timeframe.period : resCustom
maPeriods2 = input(12, "12 EMA")
maPeriods6 = input(240, "240 SMA")
BBlength = input(20, title="BB Length", minval=1)
BBsrc = input(close, title="BB Source")
mult = input(2.0, minval=0.001, maxval=50, title="BB StdDev")
sm2 = security(syminfo.tickerid, tfSet, ema(close, maPeriods2))
sm6 = security(syminfo.tickerid, tfSet, sma(close, maPeriods6))
p2 = plot(sm2, color=color.green, transp=30,  linewidth=2, title="SMA2")
p6 = plot(sm6, color=color.white, transp=30,  linewidth=2, title="SMA6")
//BB
basis = sma(BBsrc, BBlength)
dev = mult * stdev(BBsrc, BBlength)
upper = basis + dev
lower = basis - dev
offset = input(0, "BB Offset", type = input.integer, minval = -500, maxval = 500)
//plot(basis, "Basis", color=color.blue,linewidth, offset = offset)
pBB1 = plot(upper, "Upper", color=color.blue, offset = offset)
pBB2= plot(lower, "Lower", color=color.blue, offset = offset)

//MACD
fast_ma = ema(close, 48)
slow_ma = ema(close, 56)
macd = fast_ma - slow_ma

//vagas隧道
f1=ema(close, 36)
f2=ema(close, 43)
f3=ema(close, 144)
f4=ema(close, 169)
f5=ema(close, 576)
f6=ema(close, 676)
f7=ema(close,2304)
z1=plot(f1,color=color.red, title="ema36",transp=100)
z2=plot(f2,color=color.red, title="ema43",transp=100)
z3=plot(f3,color=color.green, title="ema144",transp=100)
z4=plot(f4,color=color.green, title="ema169",transp=100)
z5=plot(f5,color=color.white, title="ema576",transp=100)
z6=plot(f6,color=color.white, title="ema676",transp=100)
fill(z1, z2, color=color.red,transp=60)
fill(z3, z4, color=color.green,transp=60)
fill(z5, z6, color=color.gray,transp=60)

// Make input options that configure backtest date range
startDate = input(title="Start Date", type=input.integer,
     defval=1, minval=1, maxval=31)
startMonth = input(title="Start Month", type=input.integer,
     defval=1, minval=1, maxval=12)
startYear = input(title="Start Year", type=input.integer,
     defval=2018, minval=1800, maxval=2100)
endDate = input(title="End Date", type=input.integer,
     defval=1, minval=1, maxval=31)
endMonth = input(title="End Month", type=input.integer,
     defval=11, minval=1, maxval=12)
endYear = input(title="End Year", type=input.integer,
     defval=2030, minval=1800, maxval=2100)
// Look if the close time of the current bar
// falls inside the date range
inDateRange =  true

//波段多
if (inDateRange and crossunder(f3,f1))//
    strategy.entry("buy", strategy.long,1, when=macd>0, comment = "買Long-term")
buyclose=crossunder(f3,f5)
strategy.close("buy", when = buyclose, comment = "關Long-term")
//多策略1
if (inDateRange and crossover(low , f3) and macd>0 and f3>f6)
    strategy.entry("buy1", strategy.long,100, comment = "買Mid-term")
buyclose1=crossunder(close,upper*0.999)
if (macd<0 or f3<f6)
    strategy.close("buy1", comment = "關Mid-term")
//strategy.close("buy1",when=cross(basis,close), comment = "關M",qty_percent=50)
strategy.close("buy1", when = buyclose1, comment = "關Mid-term",qty_percent=100)
//多策略3
if (inDateRange and  (macd>0) and crossunder(low,f1) and f1>f4) //
    strategy.entry("buy3", strategy.long,1, comment = "買Short-term")
buyclose3=crossunder(close,upper*0.999)
if (macd<0 or f1<f4)
    strategy.close("buy3", comment = "關Short-term")
strategy.close("buy3", when = buyclose3, comment = "關Short-term")
//多策略4
if (inDateRange and  (macd>0) and crossunder(low,f5) and f4>f5) //
    strategy.entry("buy4", strategy.long,1, comment = "買Long-term")
buyclose4=crossunder(close,upper*0.999)
if (macd<0 or f4<f6)
    strategy.close("buy4", comment = "關Long-term")
strategy.close("buy4", when = buyclose4, comment = "關Long-term")

//空策略1
if (inDateRange and  (macd<0) and crossunder(high,f1) and f1<f3 and f3<f6) //
    strategy.entry("sell1", strategy.short,1, comment = "空Short-term")
sellclose1=crossunder(lower*0.999,close)
if (macd>0 or f1>f4)
    strategy.close("sell1", comment = "關空Short-term")
strategy.close("sell1", when = sellclose1, comment = "關空Short-term")
//空策略2
if (inDateRange and  (macd<0) and crossunder(high,f4) and f4<f6) //
    strategy.entry("sell2", strategy.short,1, comment = "空Mid-term")
sellclose2=crossunder(lower,close)
if (macd>0 or f4>f6)
    strategy.close("sell2", comment = "關空Mid-term")
strategy.close("sell2", when = sellclose2, comment = "關Mid-term")
//空策略3
if (inDateRange and (macd<0) and crossunder(high,f6)) //
    strategy.entry("sell3", strategy.short,1, comment = "空Long-term")
sellclose3=crossunder(lower,close)
if (macd>0 or f6>f7)
    strategy.close("sell3", comment = "關空Long-term")
strategy.close("sell3", when = sellclose3, comment = "關空Long-term")