Chiến lược theo xu hướng dựa trên phạm vi trung bình thực
Tổng quan
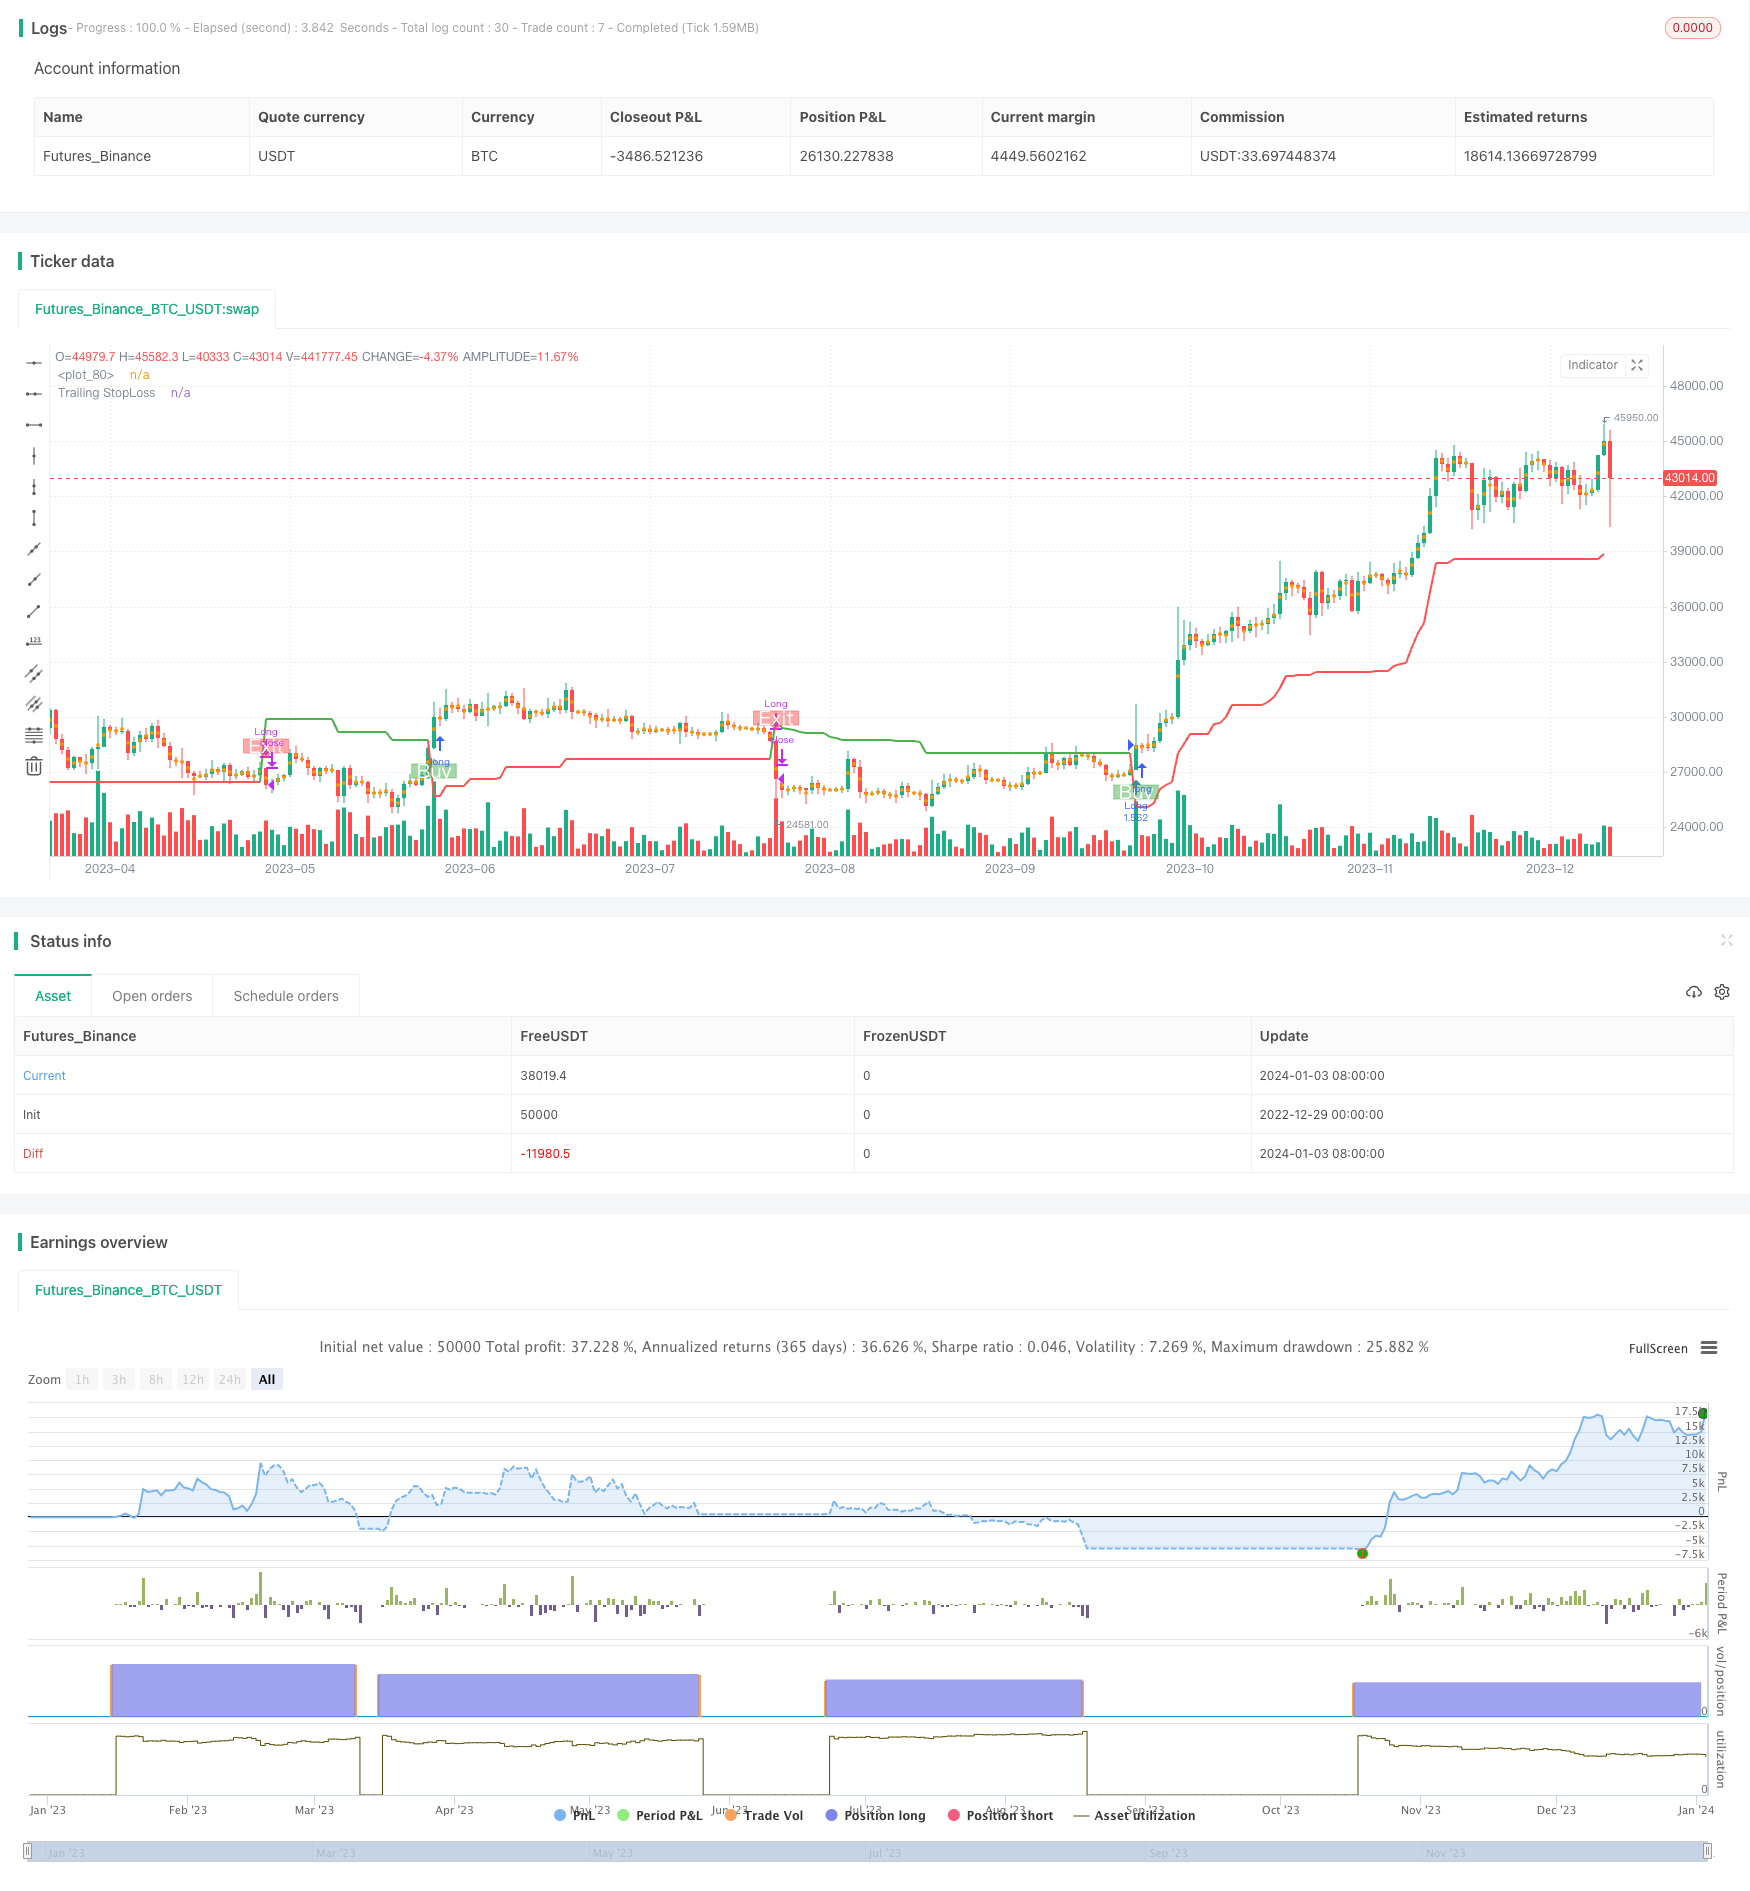
Chiến lược này là một chiến lược theo dõi xu hướng dựa trên mức sóng trung bình thực (ATR). Nó sử dụng ATR để tính toán giá trị chỉ số, do đó đánh giá hướng xu hướng giá. Chiến lược này đồng thời cung cấp cơ chế dừng lỗ để kiểm soát rủi ro.
Nguyên tắc chiến lược
Chiến lược này sử dụng ba tham số chính: Thời gian chu kỳ, nhân số nhân số và Điểm nhập cảnh / Điểm ra. Các tham số mặc định là ATR 14 chu kỳ và nhân số gấp 4 lần.
Chiến lược này đầu tiên tính toán giá trung bình đa đầu (buyavg) và giá trung bình đầu trống (sellavg), sau đó so sánh giá với mối quan hệ của hai giá trung bình này để xác định hướng xu hướng hiện tại. Nếu giá cao hơn giá trung bình đầu trống, thì được đánh giá là đa đầu; Nếu giá thấp hơn giá trung bình đầu trống, thì được đánh giá là trống.
Ngoài ra, chiến lược này kết hợp với ATR để thiết lập Trailing Stop Loss. Phương pháp cụ thể là: Nhân trung bình chuyển động có trọng lượng 14 chu kỳ của ATR với một nhân của (bằng mặc định 4) như khoảng cách dừng. Như vậy, khoảng cách dừng có thể được điều chỉnh theo mức độ biến động của thị trường.
Khi lệnh dừng lỗ được kích hoạt, chiến lược này sẽ thanh toán lợi nhuận.
Lợi thế chiến lược
- Dựa trên xu hướng, có thể làm theo xu hướng, có lợi nhuận bền vững
- Sử dụng ATR để điều chỉnh động khoảng cách dừng để kiểm soát rủi ro hiệu quả
- Tính toán điểm mua bán đơn giản, trực tiếp và dễ hiểu
Rủi ro và giải pháp
- Nếu xu hướng thay đổi, có thể có những tổn thất lớn hơn.
- Điều chỉnh đúng chu kỳ ATR và nhân số, tối ưu hóa khoảng cách dừng
- WILL chịu nhiều tổn thất nhỏ trong trận động đất
- Tăng điều kiện lọc để tránh thị trường bị chấn động
- Thiết lập tham số không đúng có thể gây ra hiệu quả chính sách kém
- Thử nghiệm tối ưu hóa tham số đa kết hợp để tìm tham số tối ưu
Hướng tối ưu hóa chiến lược
- Thêm các chỉ số khác để đánh giá tín hiệu lọc, tránh ra sân trong tình huống chấn động Tối ưu hóa chu kỳ ATR và tham số nhân để làm cho khoảng cách dừng lỗ hợp lý hơn
- Thêm kiểm soát vị trí mở kho, điều chỉnh kích thước vị trí tùy theo tình hình thị trường
Tóm tắt
Chiến lược này nói chung là một chiến lược theo dõi xu hướng đơn giản và thực tế. Nó chỉ cần một số tham số nhỏ để thực hiện và có thể điều chỉnh động theo ATR để kiểm soát rủi ro hiệu quả. Nếu kết hợp với các chỉ số phán đoán phụ trợ khác, nó có thể được tối ưu hóa hơn nữa, lọc ra một số tín hiệu nhiễu.
/*backtest
start: 2022-12-29 00:00:00
end: 2024-01-04 00:00:00
period: 1d
basePeriod: 1h
exchanges: [{"eid":"Futures_Binance","currency":"BTC_USDT"}]
*/

//@version=5
strategy('Trend Strategy by zdmre', shorttitle='Trend Strategy', overlay=true, pyramiding=0, currency=currency.USD, default_qty_type=strategy.percent_of_equity, initial_capital=10000, default_qty_value=100, commission_type=strategy.commission.percent, commission_value=0.005)
show_STOPLOSSprice = input(true, title='Show TrailingSTOP Prices')
src = input(close, title='Source')
out2 = ta.ema(src, 20)

buyavg = (close + high) / 2.02 - high * (1 - open / close) * (1 - low * open / (high * close))
sellavg = ((low + close) / 1.99 + low * (1 - low / open) * (1 - low * open / (close * high)) / 1.1 + out2 )/ 2

// === INPUT BACKTEST RANGE ===
fromMonth = input.int(defval=1, title='From Month', minval=1, maxval=12)
fromDay = input.int(defval=1, title='From Day', minval=1, maxval=31)
fromYear = input.int(defval=2021, title='From Year', minval=1970)
thruMonth = input.int(defval=1, title='Thru Month', minval=1, maxval=12)
thruDay = input.int(defval=1, title='Thru Day', minval=1, maxval=31)
thruYear = input.int(defval=2100, title='Thru Year', minval=1970)

// === INPUT SHOW PLOT ===
showDate = input(defval=true, title='Show Date Range')

// === FUNCTION EXAMPLE ===
start = timestamp(fromYear, fromMonth, fromDay, 00, 00)  // backtest start window
finish = timestamp(thruYear, thruMonth, thruDay, 23, 59)  // backtest finish window
window() => true


// === TRAILING STOP LOSS === //

ATR_Period = input(14)
ATR_Mult = input(4.0)
var float ATR_TrailSL = na
var int pos = na
atr = ta.rma (ta.tr(true), 14)
xATR = ta.atr(ATR_Period)
nLoss = ATR_Mult * xATR

iff_1 = close > nz(ATR_TrailSL[1], 0) ? close - nLoss : close + nLoss
iff_2 = close < nz(ATR_TrailSL[1], 0) and close[1] < nz(ATR_TrailSL[1], 0) ? math.min(nz(ATR_TrailSL[1]), close + nLoss) : iff_1
ATR_TrailSL := close > nz(ATR_TrailSL[1], 0) and close[1] > nz(ATR_TrailSL[1], 0) ? math.max(nz(ATR_TrailSL[1]), close - nLoss) : iff_2

iff_3 = close[1] > nz(ATR_TrailSL[1], 0) and close < nz(ATR_TrailSL[1], 0) ? -1 : nz(pos[1], 0)
pos := close[1] < nz(ATR_TrailSL[1], 0) and close > nz(ATR_TrailSL[1], 0) ? 1 : iff_3

atr_color = pos == -1 ? color.green : pos == 1 ? color.red : color.aqua
atrtrend = plot(ATR_TrailSL, 'Trailing StopLoss', atr_color, linewidth=2)

// ===  Stop Loss === //
slGroup = 'Stop Loss'
useSL = input.bool(false, title='╔══════   Enable   ══════╗', group=slGroup, tooltip='If you are using this strategy for Scalping or Futures market, we do not recommend using Stop Loss.')
SLbased = input.string(title='Based on', defval='Percent', options=['ATR', 'Percent'], group=slGroup, tooltip='ATR: Average True Range\nPercent: eg. 5%.')
multiATR = input.float(10.0, title='ATR   Mult', group=slGroup, inline='atr')
lengthATR = input.int(14, title='Length', group=slGroup, inline='atr')
SLPercent = input.float(5, title='Percent', group=slGroup) * 0.01
Shortposenter = input.bool(false, title='ShortPosition')

longStop = 0.0
shortStop = 0.0

if SLbased == 'ATR'
    longStop := ta.valuewhen(pos == 1, low, 0) - ta.valuewhen(pos == 1, ta.rma(ta.tr(true), lengthATR), 0) * multiATR
    longStopPrev = nz(longStop[1], longStop)
    longStop := close[1] > longStopPrev ? math.max(longStop, longStopPrev) : longStop

    shortStop := ta.valuewhen(pos == -1, ta.rma(ta.tr(true), lengthATR), 0) * multiATR + ta.valuewhen(pos == -1, high, 0)
    shortStopPrev = nz(shortStop[1], shortStop)
    shortStop := close[1] > shortStopPrev ? math.max(shortStop, shortStopPrev) : shortStop
    shortStop
if SLbased == 'Percent'
    longStop := strategy.position_avg_price * (1 - SLPercent)
    shortStop := strategy.position_avg_price * (1 + SLPercent)
    shortStop
exitLong  = pos == -1

// === PlotColor === //
buySignal = pos == 1 and pos[1] == -1
plotshape(buySignal, title="Long", location=location.belowbar, style=shape.labelup, size=size.normal, color=color.new(color.green,50), text='Buy', textcolor=color.white)
exitSignal = pos == -1 and pos[1] == 1
plotshape(exitSignal, title="Exit", location=location.abovebar, style=shape.labeldown, size=size.normal, color=color.new(color.red,50), text='Exit', textcolor=color.white)

hPlot = plot(ohlc4, title="", style=plot.style_circles, linewidth=0, editable = false)
longFill = (pos == 1 ? color.new(color.green,80) : na)
shortFill = (pos == -1 ? color.new(color.red,80) : na)
fill(hPlot, atrtrend,color=longFill)
fill(hPlot,atrtrend, color=shortFill)

// === Strategy === //
strategy.entry('Long', strategy.long,limit = buyavg, when=window() and pos == 1,comment="Entry: "+str.tostring(buyavg))
strategy.close('Long', when=window() and exitLong , comment='Exit: '+str.tostring(sellavg) )

if Shortposenter
    strategy.entry('Short', strategy.short, when=window() and pos== -1,comment="Entry: "+str.tostring(close))
    strategy.close('Short', when=window() and pos == 1 , comment='Exit: ')

if useSL
    strategy.exit('Stop Loss', 'Long', stop=longStop)

// === Show StopLoss Price === //
if show_STOPLOSSprice
    if pos == -1
        label ShortStop = label.new(bar_index, na, 'SL: ' + str.tostring(ATR_TrailSL), color=color.green, textcolor=color.white, style=label.style_none, yloc=yloc.abovebar, size=size.small)
        label.delete(ShortStop[1])

    if pos == 1
        label LongStop = label.new(bar_index, na, 'SL: ' + str.tostring(ATR_TrailSL), color=color.red, textcolor=color.white, style=label.style_none, yloc=yloc.belowbar, size=size.small)
        label.delete(LongStop[1])