Chiến lược xu hướng đột phá theo đà tăng trưởng được cải thiện
Tổng quan
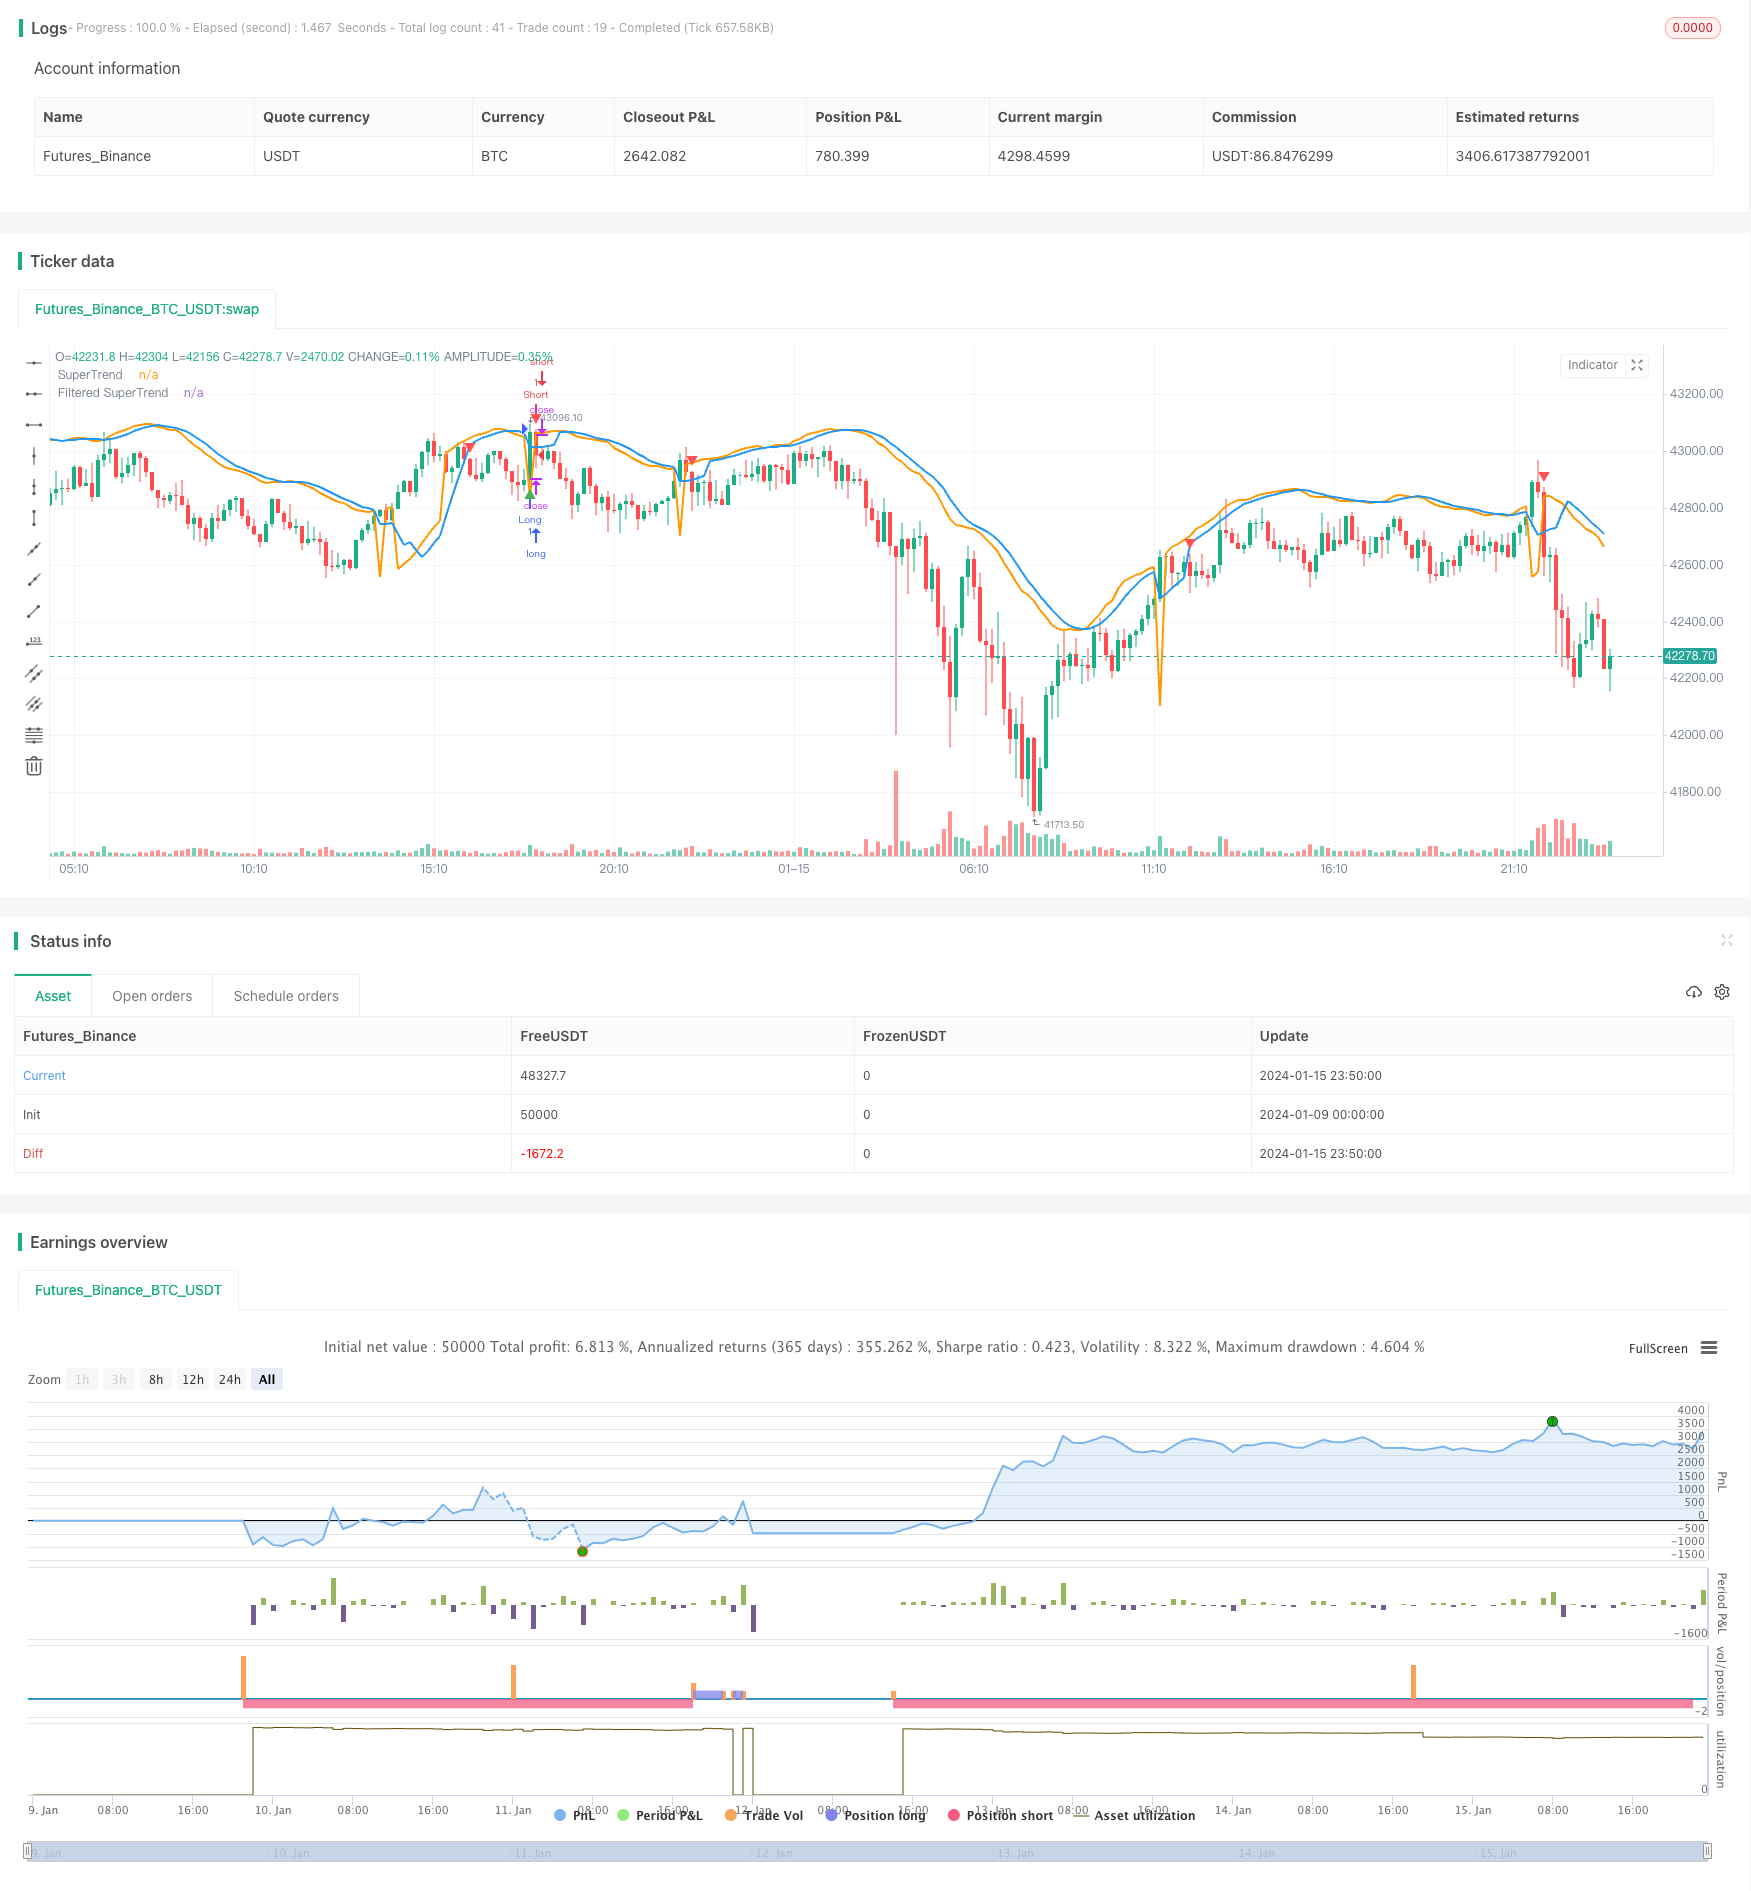
Bài viết này phân tích chi tiết một chiến lược theo dõi xu hướng được cải thiện kết hợp với chỉ số SuperTrend và bộ lọc Stochastic RSI. Chiến lược này nhằm tạo ra tín hiệu mua và bán, đồng thời tính đến xu hướng thị trường và giảm tín hiệu giả. Stochastic RSI được sử dụng để tránh tín hiệu giả trong trường hợp quá mua quá bán.
Nguyên tắc chiến lược
Tính toán SuperTrend
Đầu tiên, tính toán phạm vi biến động thực (TR) và phạm vi biến động thực trung bình (ATR). Sau đó sử dụng ATR để tính toán đường ray trên và dưới đường ray:
Đường đua trên = SMA ((giá đóng cửa, chu kỳ ATR) + ATR nhân × ATR Hạ đường = SMA ((giá đóng cửa, chu kỳ ATR) - ATR nhân số × ATR
Nếu giá đóng cửa cao hơn đường đi xuống, đó là xu hướng tăng; nếu giá đóng cửa thấp hơn đường đi lên, đó là xu hướng giảm. Trong xu hướng tăng, SuperTrend là đường đi xuống; trong xu hướng giảm, SuperTrend là đường đi lên.
Cơ chế lọc
Để giảm tín hiệu giả, SuperTrend được làm trung bình di chuyển để có được SuperTrend được lọc.
Stochastic RSI
Tính giá trị của RSI, sau đó áp dụng chỉ số Stochastic để tạo ra Stochastic RSI. Nó phản ánh xem RSI có nằm trong khu vực quá mua hay quá bán hay không.
Điều kiện nhập cảnh và rút lui
Điều kiện mua: Giá đóng cửa vượt qua SuperTrend và đang trong xu hướng tăng, và Stochastic RSI < 80 Điều kiện bán: Giá đóng cửa vượt qua SuperTrend sau đợt tăng và đang đi xuống, và Stochastic RSI > 20
Xuất nhập mua: Giá đóng cửa dưới mức SuperTrend vượt qua đợt giảm giá và đang trong xu hướng tăng Quay ra và bán ra: Giá đóng cửa vượt qua SuperTrend và đang đi xuống
Lợi thế chiến lược
Đây là một chiến lược theo dõi xu hướng được cải tiến, so với các chỉ số như trung bình di chuyển đơn giản có những lợi thế sau:
- SuperTrend tự nó có khả năng nhận dạng xu hướng mạnh mẽ và khả năng lọc các tín hiệu giả.
- Việc áp dụng các cơ chế lọc làm giảm thêm các tín hiệu giả và làm cho tín hiệu đáng tin cậy hơn.
- Stochastic RSI tránh các tín hiệu giả tạo trong trường hợp quá mua quá bán, cho phép chiến lược phát tín hiệu gần vùng kháng cự hỗ trợ quan trọng.
- Chiến lược này cũng tính đến hướng xu hướng và tình trạng quá mua quá bán của Stochastic RSI, để cân bằng tốt hơn mối quan hệ giữa việc theo dõi xu hướng và tránh tín hiệu sai.
- Các tham số chiến lược có thể được điều chỉnh linh hoạt để phù hợp với các môi trường thị trường khác nhau.
Chiến lược rủi ro và tối ưu hóa
Những rủi ro có thể xảy ra
- Trong một thị trường biến động mạnh, lệnh dừng có thể bị phá vỡ.
- SuperTrend và bộ lọc có thể bị chậm trễ và bỏ lỡ sự thay đổi giá gần đây.
- Stochastic RSI tham số được thiết lập không đúng cách cũng có thể ảnh hưởng đến hiệu suất chiến lược.
Kiểm soát rủi ro
- Điều chỉnh lỗ hổng thích hợp, hoặc sử dụng lỗ hổng vi phạm.
- Điều chỉnh tham số chu kỳ ATR, chu kỳ lọc để cân bằng sự chậm trễ.
- Kiểm tra và tối ưu hóa các tham số của Stochastic RSI.
Hướng tối ưu hóa
- Kiểm tra các tổ hợp tham số khác nhau để tìm ra tham số tốt nhất.
- Thử các cơ chế lọc khác nhau, chẳng hạn như làm mịn EMA.
- Ứng dụng thuật toán học máy để tự động tối ưu hóa tham số.
- Kết hợp với các chỉ số khác để bổ sung vào trường.
Tóm tắt
Chiến lược này kết hợp các lợi thế của hai chỉ số SuperTrend và Stochastic RSI, có thể xác định xu hướng hiệu quả, phát ra tín hiệu giao dịch chất lượng cao. Trong khi đó, cơ chế lọc cũng làm cho nó trở nên mạnh mẽ hơn đối với tiếng ồn thị trường. Chiến lược này có thể đạt được hiệu quả chiến lược tốt hơn thông qua tối ưu hóa tham số, cũng có thể được xem xét kết hợp với các chỉ số hoặc mô hình khác.
/*backtest
start: 2024-01-09 00:00:00
end: 2024-01-16 00:00:00
period: 10m
basePeriod: 1m
exchanges: [{"eid":"Futures_Binance","currency":"BTC_USDT"}]
*/

//@version=5
strategy("Improved SuperTrend Strategy with Stochastic RSI", shorttitle="IST+StochRSI", overlay=true)

// Input parameters
atr_length = input(14, title="ATR Length")
atr_multiplier = input(1.5, title="ATR Multiplier")
filter_length = input(5, title="Filter Length")
stoch_length = input(14, title="Stochastic RSI Length")
smooth_k = input(3, title="Stochastic RSI %K Smoothing")

// Calculate True Range (TR) and Average True Range (ATR)
tr = ta.rma(ta.tr, atr_length)
atr = ta.rma(tr, atr_length)

// Calculate SuperTrend
upper_band = ta.sma(close, atr_length) + atr_multiplier * atr
lower_band = ta.sma(close, atr_length) - atr_multiplier * atr

is_uptrend = close > lower_band
is_downtrend = close < upper_band

super_trend = is_uptrend ? lower_band : na
super_trend := is_downtrend ? upper_band : super_trend

// Filter for reducing false signals
filtered_super_trend = ta.sma(super_trend, filter_length)

// Calculate Stochastic RSI
rsi_value = ta.rsi(close, stoch_length)
stoch_rsi = ta.sma(ta.stoch(rsi_value, rsi_value, rsi_value, stoch_length), smooth_k)

// Entry conditions
long_condition = ta.crossover(close, filtered_super_trend) and is_uptrend and stoch_rsi < 80
short_condition = ta.crossunder(close, filtered_super_trend) and is_downtrend and stoch_rsi > 20

// Exit conditions
exit_long_condition = ta.crossunder(close, filtered_super_trend) and is_uptrend
exit_short_condition = ta.crossover(close, filtered_super_trend) and is_downtrend

// Plot SuperTrend and filtered SuperTrend
plot(super_trend, color=color.orange, title="SuperTrend", linewidth=2)
plot(filtered_super_trend, color=color.blue, title="Filtered SuperTrend", linewidth=2)

// Plot Buy and Sell signals
plotshape(series=long_condition, title="Buy Signal", color=color.green, style=shape.triangleup, location=location.belowbar)
plotshape(series=short_condition, title="Sell Signal", color=color.red, style=shape.triangledown, location=location.abovebar)

// Output signals to the console for analysis
plotchar(long_condition, "Long Signal", "▲", location.belowbar, color=color.green, size=size.small)
plotchar(short_condition, "Short Signal", "▼", location.abovebar, color=color.red, size=size.small)

// Strategy entry and exit
strategy.entry("Long", strategy.long, when=long_condition)
strategy.entry("Short", strategy.short, when=short_condition)
strategy.close("Long", when=exit_long_condition)
strategy.close("Short", when=exit_short_condition)