Chiến lược giao dịch phân kỳ RSI
Tổng quan
Chiến lược giao dịch RSI divergence bằng cách phân tích RSI divergence với giá, phát hiện cơ hội divergence giá trị, làm cho nhiều shorting khi divergence xuất hiện.
Nguyên tắc chiến lược
Chiến lược này dựa trên sự chênh lệch giá trị giữa chỉ số RSI và giá khi có sự lệch. Chỉ số RSI phản ánh điểm yếu mạnh và giá phản ánh mối quan hệ cung cầu. Khi hai sự khác biệt xảy ra, nó cho thấy thị trường có giá sai, có thể mua ngắn hoặc bán nhiều hơn để kiếm lợi nhuận.
Cụ thể, sự phân biệt đa đầu thông thường là RSI tạo ra điểm thấp cao hơn và giá tạo ra điểm thấp thấp hơn. Điều này cho thấy thị trường, mặc dù có vẻ như giảm, nhưng thực tế đã có dấu hiệu phục hồi tích lũy.
Ngược lại, RSI tạo ra điểm cao thấp hơn và giá tạo ra điểm cao cao hơn. Điều này cho thấy thị trường có vẻ lạc quan, nhưng thực tế đã có dấu hiệu yếu ớt. Khi RSI rời khỏi giá và phá vỡ đường phân giới 50 xuống, bạn có thể kiếm được lợi nhuận.
Ngoài ra, còn có trường hợp phân biệt nhiều đầu và phân biệt đầu trống. Khi đó, mối quan hệ giữa RSI và giá là ngược lại với phân biệt thông thường, nhưng nguyên tắc giống nhau, cũng có thể kiếm được lợi nhuận.
Lợi thế chiến lược
- Ghi lại sự khác biệt về giá trị và phát hiện sai lầm định giá của thị trường
- Kết hợp các chỉ số với giá lệch, tăng tỷ lệ thắng
- Xác định sự khác biệt và mở rộng cơ hội
Phân tích rủi ro
- Các trường hợp thị trường đặc biệt cũng có thể tạo ra sự khác biệt giả tạo, cần phải nhận diện
- Tỷ lệ thắng vượt 50 điểm là không cao, có thể được tối ưu hóa thích hợp
- Lỗi chọn hướng đa không có thể gây ra tổn thất lớn
Hướng tối ưu hóa
- Tối ưu hóa các tham số RSI để tăng độ chính xác dự báo của chỉ số
- Kết hợp các chỉ số khác để đánh giá sự bất đồng
- Đánh giá tỷ lệ rủi ro / lợi nhuận của việc làm quá nhiều ngoại hối, kiểm soát lỗ hổng đơn lẻ
Tóm tắt
Chiến lược chênh lệch của chỉ số RSI là một chiến lược đánh giá thống kê điển hình bằng cách phân tích sự khác biệt giữa giá trị và giá, tìm ra giá trị sai lệch của thị trường. Ưu điểm của chiến lược này là phát hiện kịp thời cơ hội đảo ngược xu hướng, rủi ro là độ chính xác của việc xác định chênh lệch. Bằng cách tối ưu hóa liên tục, có thể thu được lợi nhuận ổn định trong cuộc chiến thực.
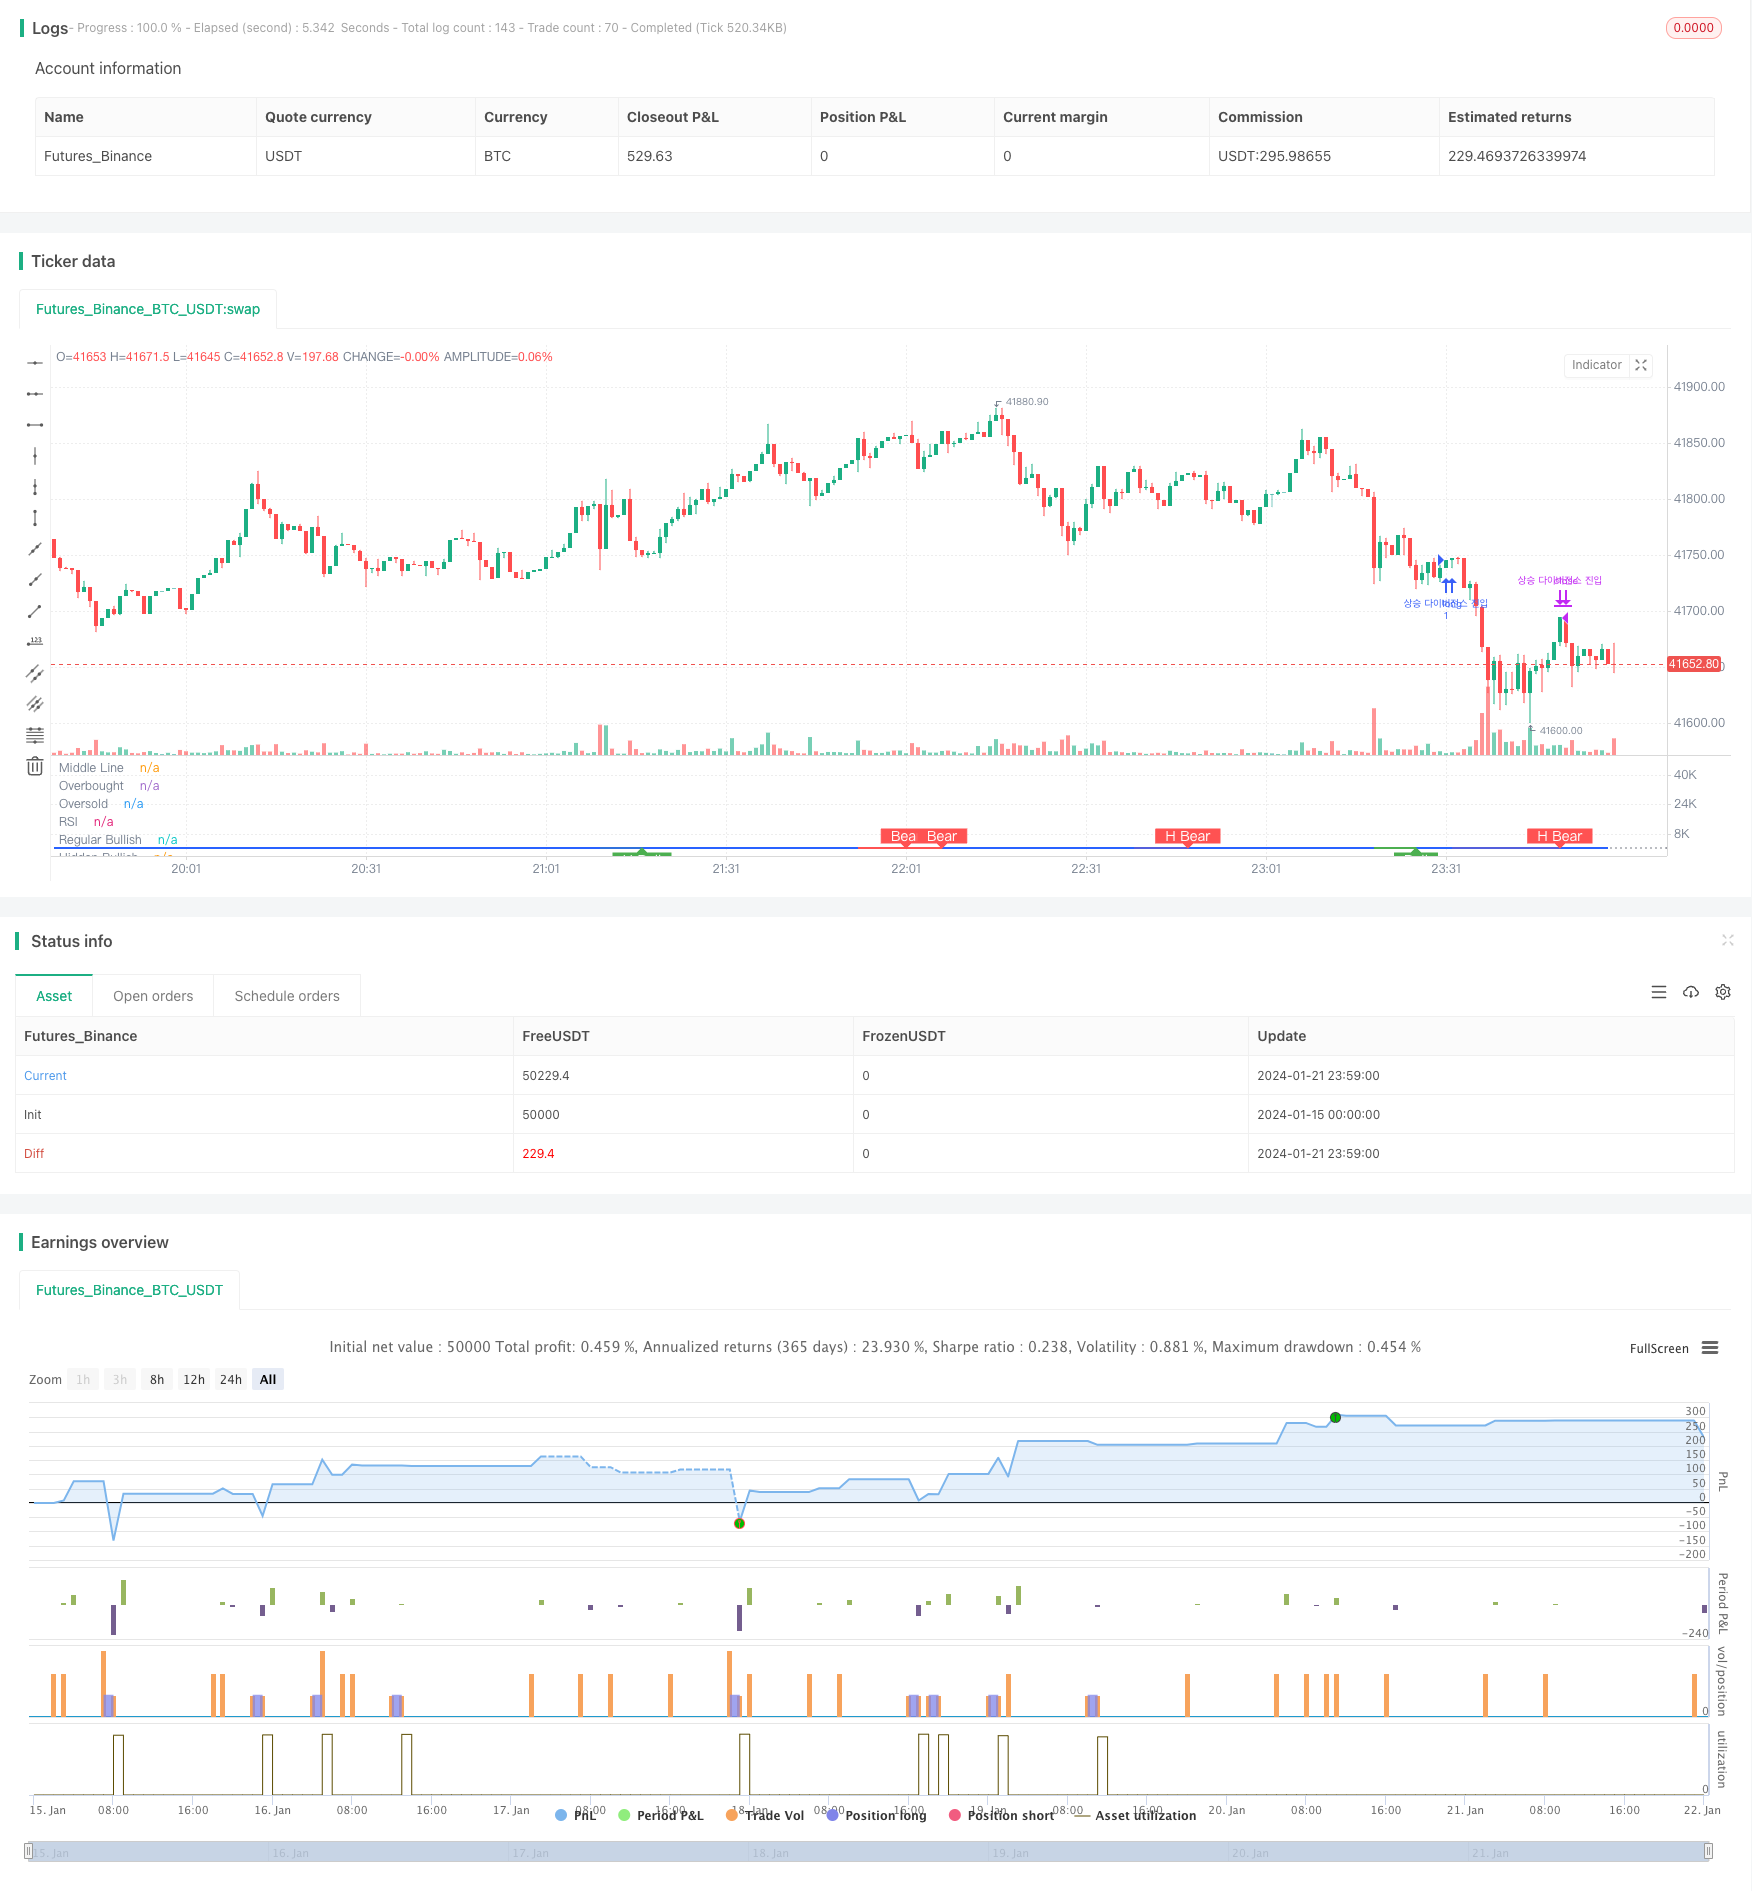
/*backtest
start: 2024-01-15 00:00:00
end: 2024-01-22 00:00:00
period: 1m
basePeriod: 1m
exchanges: [{"eid":"Futures_Binance","currency":"BTC_USDT"}]
*/

//@version=5
strategy(title="Divergence Indicator")
len = input.int(title="RSI Period", minval=1, defval=14)
src = input(title="RSI Source", defval=close)
lbR = input(title="Pivot Lookback Right", defval=5)
lbL = input(title="Pivot Lookback Left", defval=5)
rangeUpper = input(title="Max of Lookback Range", defval=60)
rangeLower = input(title="Min of Lookback Range", defval=5)
plotBull = input(title="Plot Bullish", defval=true)
plotHiddenBull = input(title="Plot Hidden Bullish", defval=true)
plotBear = input(title="Plot Bearish", defval=true)
plotHiddenBear = input(title="Plot Hidden Bearish", defval=true)
bearColor = color.red
bullColor = color.green
hiddenBullColor = color.new(color.green, 80)
hiddenBearColor = color.new(color.red, 80)
textColor = color.white
noneColor = color.new(color.white, 100)
osc = ta.rsi(src, len)

plot(osc, title="RSI", linewidth=2, color=#2962FF)
hline(50, title="Middle Line", color=#787B86, linestyle=hline.style_dotted)
obLevel = hline(70, title="Overbought", color=#787B86, linestyle=hline.style_dotted)
osLevel = hline(30, title="Oversold", color=#787B86, linestyle=hline.style_dotted)
fill(obLevel, osLevel, title="Background", color=color.rgb(33, 150, 243, 90))

plFound = na(ta.pivotlow(osc, lbL, lbR)) ? false : true
phFound = na(ta.pivothigh(osc, lbL, lbR)) ? false : true
_inRange(cond) =>
	bars = ta.barssince(cond == true)
	rangeLower <= bars and bars <= rangeUpper

//------------------------------------------------------------------------------
// Regular Bullish
// Osc: Higher Low

oscHL = osc[lbR] > ta.valuewhen(plFound, osc[lbR], 1) and _inRange(plFound[1])

// Price: Lower Low

priceLL = low[lbR] < ta.valuewhen(plFound, low[lbR], 1)
// bull : 상승 Condition : 조건
bullCond = plotBull and priceLL and oscHL and plFound // 상승다이버전스?
strategy.entry("상승 다이버전스 진입", strategy.long, when = bullCond)
strategy.close("상승 다이버전스 진입", when = ta.crossover(osc, 50))
plot(
     plFound ? osc[lbR] : na,
     offset=-lbR,
     title="Regular Bullish",
     linewidth=2,
     color=(bullCond ? bullColor : noneColor)
     )

plotshape(
	 bullCond ? osc[lbR] : na,
	 offset=-lbR,
	 title="Regular Bullish Label",
	 text=" Bull ",
	 style=shape.labelup,
	 location=location.absolute,
	 color=bullColor,
	 textcolor=textColor
	 )

//------------------------------------------------------------------------------
// Hidden Bullish
// Osc: Lower Low

oscLL = osc[lbR] < ta.valuewhen(plFound, osc[lbR], 1) and _inRange(plFound[1])

// Price: Higher Low

priceHL = low[lbR] > ta.valuewhen(plFound, low[lbR], 1)
hiddenBullCond = plotHiddenBull and priceHL and oscLL and plFound
// strategy.entry("히든 상승 다이버전스 진입", strategy.long, when = hiddenBullCond)
// strategy.close("히든 상승 다이버전스 진입", when = ta.crossover(osc, 50))
plot(
	 plFound ? osc[lbR] : na,
	 offset=-lbR,
	 title="Hidden Bullish",
	 linewidth=2,
	 color=(hiddenBullCond ? hiddenBullColor : noneColor)
	 )

plotshape(
	 hiddenBullCond ? osc[lbR] : na,
	 offset=-lbR,
	 title="Hidden Bullish Label",
	 text=" H Bull ",
	 style=shape.labelup,
	 location=location.absolute,
	 color=bullColor,
	 textcolor=textColor
	 )

//------------------------------------------------------------------------------
// Regular Bearish
// Osc: Lower High

oscLH = osc[lbR] < ta.valuewhen(phFound, osc[lbR], 1) and _inRange(phFound[1])

// Price: Higher High

priceHH = high[lbR] > ta.valuewhen(phFound, high[lbR], 1)
// bear : 하락
bearCond = plotBear and priceHH and oscLH and phFound
// strategy.entry("하락 다이버전스 진입", strategy.short, when = bearCond)
// strategy.close("하락 다이버전스 진입", when = ta.crossunder(osc, 50))
plot(
	 phFound ? osc[lbR] : na,
	 offset=-lbR,
	 title="Regular Bearish",
	 linewidth=2,
	 color=(bearCond ? bearColor : noneColor)
	 )

plotshape(
	 bearCond ? osc[lbR] : na,
	 offset=-lbR,
	 title="Regular Bearish Label",
	 text=" Bear ",
	 style=shape.labeldown,
	 location=location.absolute,
	 color=bearColor,
	 textcolor=textColor
	 )

//------------------------------------------------------------------------------
// Hidden Bearish
// Osc: Higher High

oscHH = osc[lbR] > ta.valuewhen(phFound, osc[lbR], 1) and _inRange(phFound[1])

// Price: Lower High

priceLH = high[lbR] < ta.valuewhen(phFound, high[lbR], 1)

hiddenBearCond = plotHiddenBear and priceLH and oscHH and phFound
// strategy.entry("히든 하락 다이버전스 진입", strategy.short, when = hiddenBearCond)
// strategy.close("히든 하락 다이버전스 진입", when = ta.crossunder(osc, 50))
plot(
	 phFound ? osc[lbR] : na,
	 offset=-lbR,
	 title="Hidden Bearish",
	 linewidth=2,
	 color=(hiddenBearCond ? hiddenBearColor : noneColor)
	 )

plotshape(
	 hiddenBearCond ? osc[lbR] : na,
	 offset=-lbR,
	 title="Hidden Bearish Label",
	 text=" H Bear ",
	 style=shape.labeldown,
	 location=location.absolute,
	 color=bearColor,
	 textcolor=textColor
	 )