Chiến lược chênh lệch giá song phương dựa trên các chỉ số TSI và HMACCI
Tổng quan
Chiến lược này kết hợp các tín hiệu giao dịch song phương của chỉ số TSI và CCI cải tiến, thường xuyên mở vị trí bằng cách mạo hiểm, với mục đích theo đuổi lợi nhuận bền vững hơn. Lý thuyết quan trọng là các ngón tay vàng và ngón tay chết của chỉ số TSI, kết hợp với các đường tín hiệu đa không gian của chỉ số HMACCI để xác định hướng mua và bán của thị trường. Kiểm soát rủi ro bằng cách hạn chế các điều kiện mở vị trí, đồng thời thiết lập logic dừng lỗ và dừng.
Nguyên tắc chiến lược
Chiến lược này chủ yếu dựa trên sự kết hợp của hai chỉ số TSI và HMACCI.
Chỉ số TSI bao gồm một đường trung bình nhanh và một đường trung bình chậm để đánh giá tín hiệu mua và bán. Khi đường nhanh từ dưới lên phá vỡ đường chậm, nó là tín hiệu mua, ngược lại là tín hiệu bán. Như vậy, nó có thể nắm bắt xu hướng thay đổi thị trường một cách nhạy cảm hơn.
Chỉ số HMACCI dựa trên chỉ số CCI truyền thống sử dụng trung bình di chuyển của Hull thay vì chính giá, có thể làm giảm một phần tiếng ồn và xác định khoảng mua quá mức. Khoảng mua quá mức có thể xác nhận lại tín hiệu của chỉ số TSI.
Logic quan trọng của chiến lược là kết hợp kết quả của hai chỉ số này và đặt một số điều kiện bổ sung để lọc các tín hiệu sai, chẳng hạn như giá đóng cửa của một đường K trước khi xem xét và giá cao nhất và giá thấp nhất trước nhiều chu kỳ, để kiểm soát chất lượng tín hiệu đảo ngược.
Về việc mở vị trí, nếu điều kiện được đáp ứng, mỗi khi K-line đóng cửa, vị trí được mở tại giá thị trường, đồng thời làm nhiều lỗ trống. Như vậy, bạn có thể nhận được lợi nhuận ổn định hơn, nhưng cần phải chịu rủi ro của đòn bẩy.
Trong phần Stop Loss, đặt hết lỗ hổng và lợi nhuận nổi. Điều này có thể kiểm soát tốt rủi ro của giao dịch đơn phương.
Lợi thế chiến lược
Đây là một chiến lược định giá tần số cao ổn định và đáng tin cậy. Các lợi thế chính là:
- Sự kết hợp của hai chỉ số có thể ngăn chặn hiệu quả tín hiệu sai
- Mỗi dòng K mở vị trí, hoạt động môi giới thường xuyên, biến động lợi nhuận và lỗ đều hơn
- Logic và điều kiện dừng lỗ nghiêm ngặt để kiểm soát rủi ro
- Kết hợp xu hướng và sự phán đoán ngược lại, tỷ lệ mắc lỗi cao hơn
- Ưu tiên không định hướng, áp dụng cho tất cả các tình huống thị trường
- Các tham số có thể được điều chỉnh theo kích thước không gian và có thể được tối ưu hóa cho các giống khác nhau
Phân tích rủi ro
Những rủi ro chính cần lưu ý là:
- Lợi nhuận của các giao dịch cao cấp
- Không thể hoàn toàn tránh được khả năng bị mắc kẹt trong mạo hiểm
- Thiết lập tham số không đúng có thể dẫn đến quá mạnh vào trường
- Có khả năng mất mát lớn một bên trong thời gian ngắn
Bạn có thể làm giảm nguy cơ bằng cách:
- Điều chỉnh tần suất mở kho để giảm tác động của phí xử lý
- Tối ưu hóa các tham số chỉ số để đảm bảo chất lượng tín hiệu
- Tăng mức dừng lỗ, nhưng sẽ chịu nhiều tổn thất lợi nhuận hơn
- Kiểm tra các thiết lập tham số khác nhau
Hướng tối ưu hóa
Chiến lược này có thể được tối ưu hóa rất nhiều, trong đó có những điểm chính như:
- Tối ưu hóa và thử nghiệm các tham số như chu kỳ, độ dài
- Thử các kết hợp khác nhau như MACD, BOLL
- Thay đổi logic mở kho để đặt các điều kiện lọc nghiêm ngặt hơn
- Tối ưu hóa chiến lược dừng lỗ, thực hiện dừng lỗ động và đột phá
- Thử các phương pháp học máy để tìm các tham số ổn định hơn
- Thử nghiệm các loại và thời gian giao dịch
- Kết hợp các chỉ số đánh giá xu hướng để tránh biến động quá mạnh
Tóm tắt
Chiến lược này nói chung là một chiến lược mạo hiểm song phương ổn định, đáng tin cậy và có tỷ lệ lỗi cao. Nó kết hợp xu hướng và chỉ số đảo ngược, thu được lợi nhuận ổn định thông qua việc mở vị trí song phương thường xuyên. Đồng thời, chiến lược này có không gian và tiềm năng tối ưu hóa mạnh mẽ, là một tư tưởng giao dịch tần số cao đáng để nghiên cứu sâu hơn.
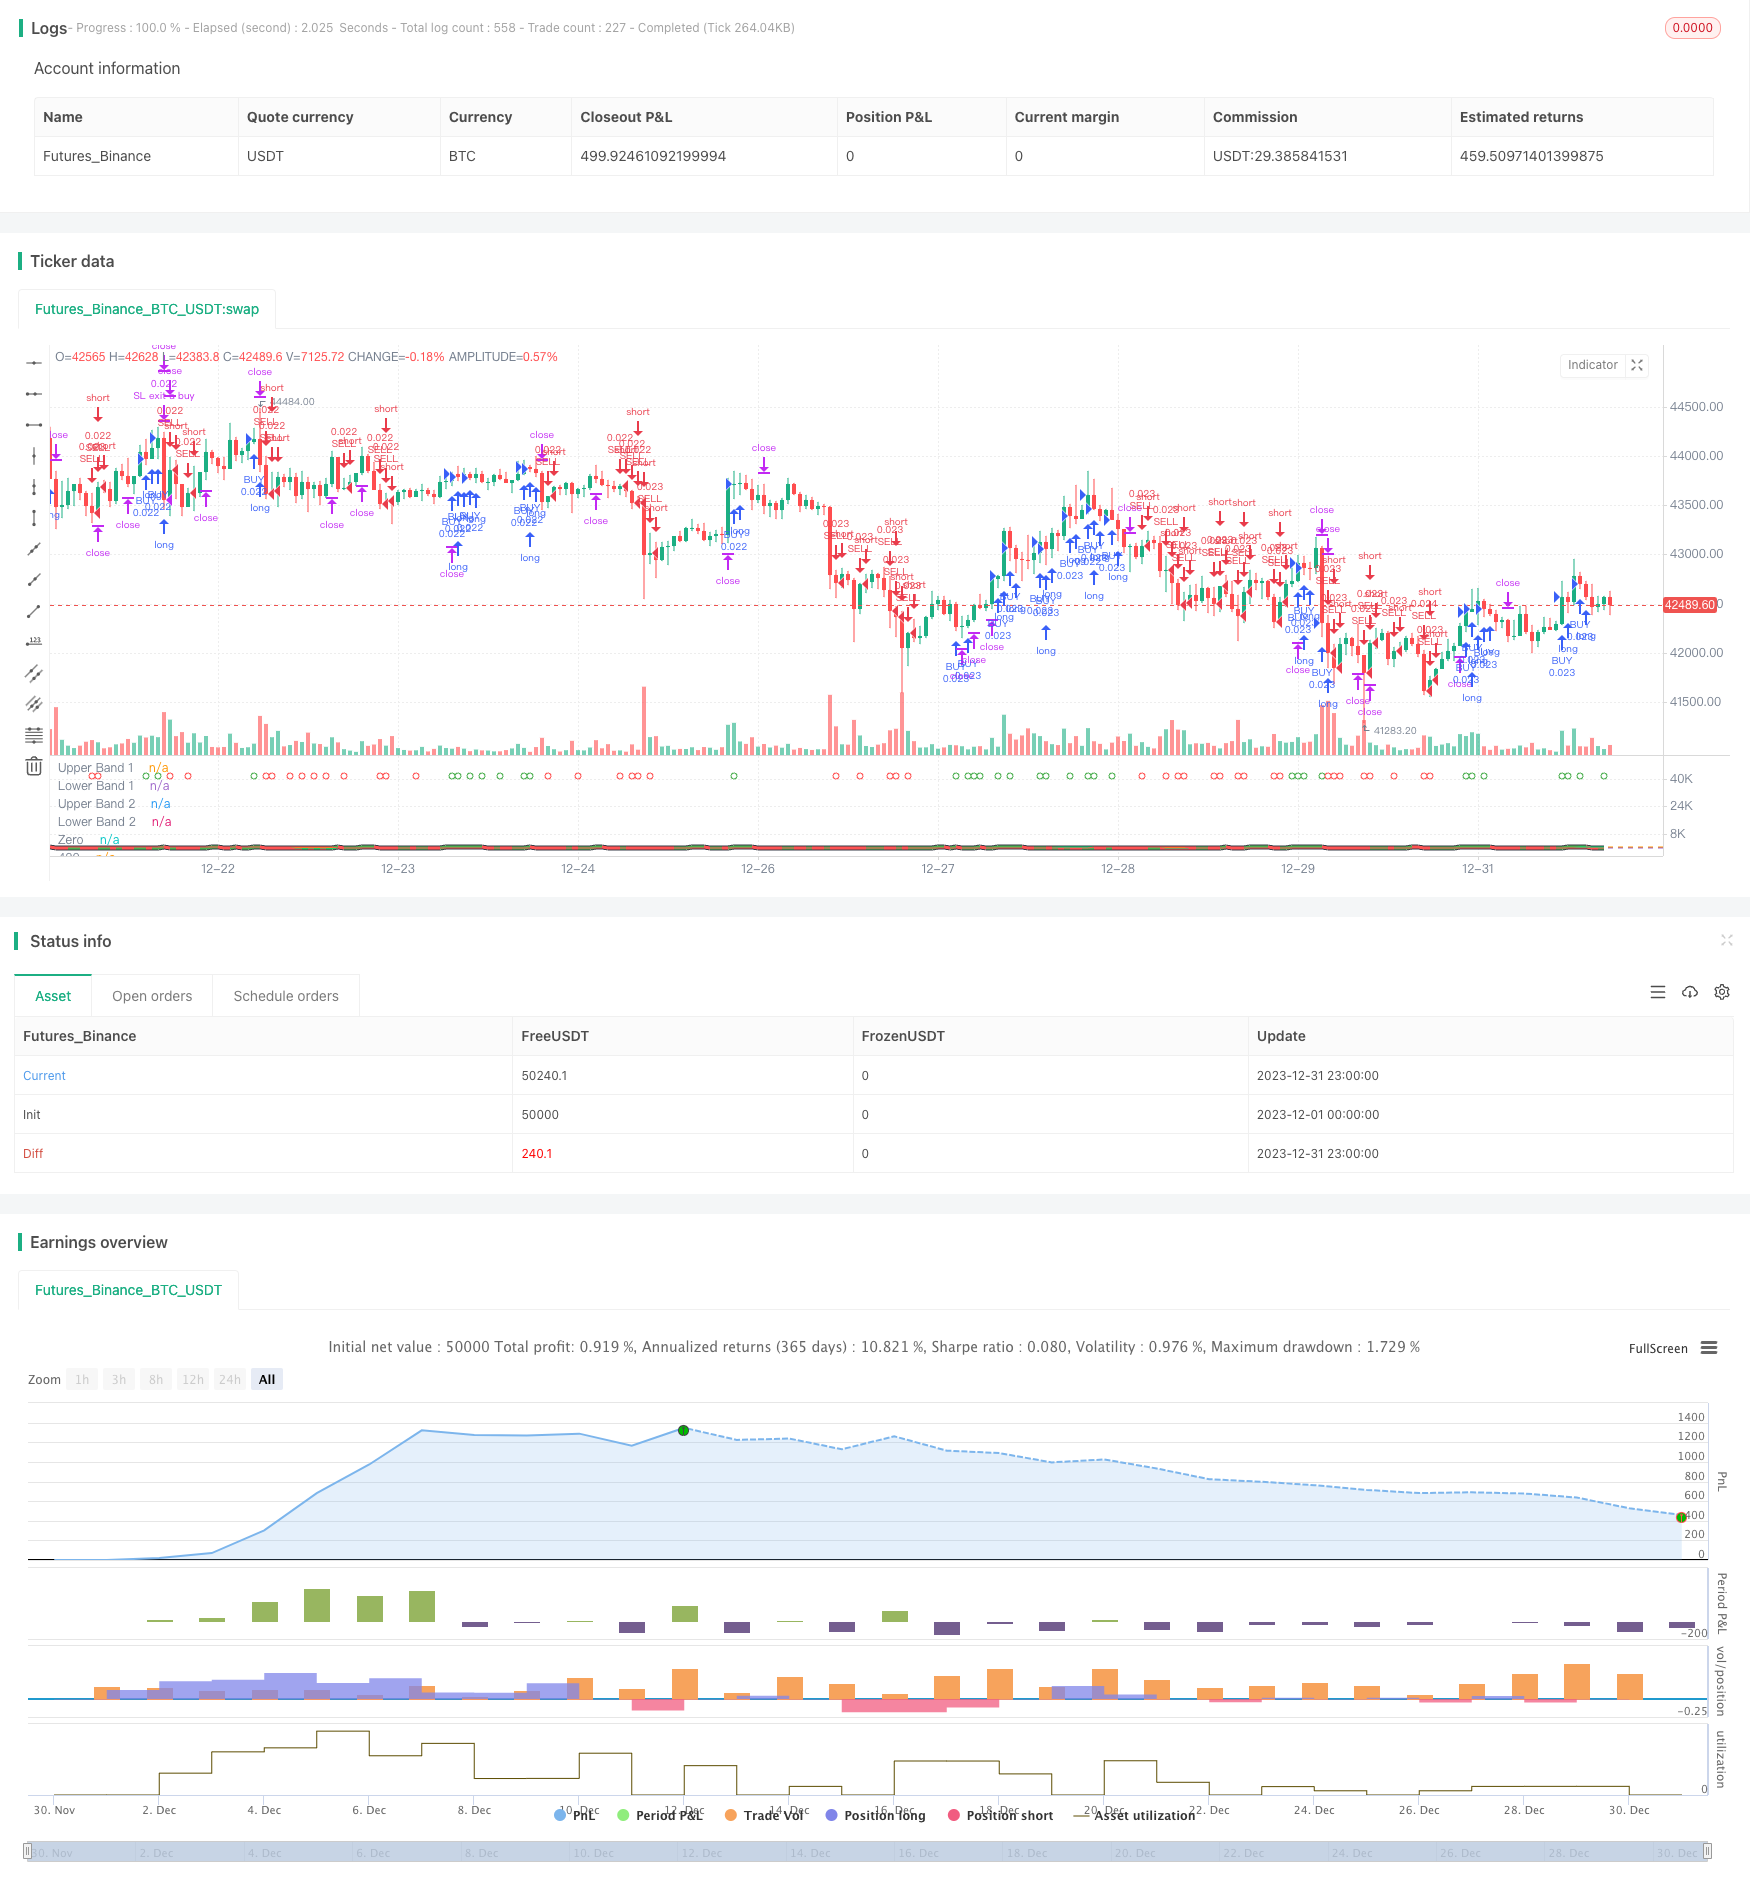
/*backtest
start: 2023-12-01 00:00:00
end: 2023-12-31 23:59:59
period: 1h
basePeriod: 15m
exchanges: [{"eid":"Futures_Binance","currency":"BTC_USDT"}]
*/

// This source code is subject to the terms of the suns bipolarity
//©SeaSide420
//@version=4
strategy(title="TSI HMA CCI", default_qty_type=strategy.cash,default_qty_value=1000,commission_type=strategy.commission.percent,commission_value=0.001)
long = input(title="TSI Long Length", type=input.integer, defval=25)
short = input(title="TSI Short Length", type=input.integer, defval=25)
signal = input(title="TSI Signal Length", type=input.integer, defval=13)
length = input(33, minval=1, title="HMACCI Length")
src = input(open, title="Price Source")
ld = input(50, minval=1, title="Line Distance")
CandlesBack = input(8,minval=1,title="Candles Look Back")
StopLoss= input(3000,minval=1, title="Stop Loss")
TargetProfitAll= input(3000,minval=1, title="Target Profit Close All")
FromMonth=input(defval=1,title="FromMonth",minval=1,maxval=12)
FromDay=input(defval=1,title="FromDay",minval=1,maxval=31)
FromYear=input(defval=2020,title="FromYear",minval=2020)
ToMonth=input(defval=1,title="ToMonth",minval=1,maxval=12)
ToDay=input(defval=1,title="ToDay",minval=1,maxval=31)
ToYear=input(defval=9999,title="ToYear",minval=2017)
start=timestamp(FromYear,FromMonth,FromDay,00,00)
finish=timestamp(ToYear,ToMonth,ToDay,23,59)
window()=>true
ul = (ld)
ll = (ld-ld*2)
ma = hma(src, length)
cci = (src - ma) / (0.015 * dev(src, length))
price = close
double_smooth(src, long, short) =>
	fist_smooth = ema(src, long)
	ema(fist_smooth, short)
pc = change(price)
double_smoothed_pc = double_smooth(pc, long, short)
double_smoothed_abs_pc = double_smooth(abs(pc), long, short)
tsi_value = 100 * (double_smoothed_pc / double_smoothed_abs_pc)*10
tsi_value2=ema(tsi_value/10, signal)*10
cc = color.white
ct = color.new(color.gray, 90)
if cci<ll or cci[1]<ll
    cc:=color.red
if cci>ul or cci[1]>ul
    cc:=color.green
if cci<ul and cci>ll
    cc:=color.new(color.yellow, 90)
ccc = color.white
if cci>ul
    ccc:=color.green
if cci<cci[1] and cci<ul and cci>ll
    ccc:=color.red
if cci<ll
    ccc:=color.red
if cci>cci[1] and cci>ll and cci<ul
    ccc:=color.green
tsiplot= plot(tsi_value, color=color.lime)
tsiplot2=plot(tsi_value2, color=color.red)
colorchange2 =tsi_value>tsi_value2?color.lime:color.orange
fill(tsiplot, tsiplot2, color=colorchange2, title="TSIBackground", transp=50)
band1 = hline(ul, "Upper Band 1", color=ct, linestyle=hline.style_dashed)
band0 = hline(ll, "Lower Band 1", color=ct, linestyle=hline.style_dashed)
fill(band1, band0, color=cc, title="MidBandBackground", transp=0)
band2 = hline(ul, "Upper Band 2", color=ct, linestyle=hline.style_dashed)
band3 = hline(ll, "Lower Band 2", color=ct, linestyle=hline.style_dashed)
cciplot2 = plot(cci, "CCIvHMA 2", color=color.black, transp=0, linewidth=5)
cciplot = plot(cci, "CCIvHMA", color=ccc, transp=0, linewidth=3)
hline(0, title="Zero")
hline(420, title="420")
hline(-420, title="-420")
fill(cciplot, cciplot2, color=ccc, title="CCIBackground", transp=0)
LongCondition=cci>cci[1] and cci>ll and src>src[CandlesBack] and tsi_value>tsi_value2
ShortCondition=cci<cci[1] and cci<ul and src<src[CandlesBack] and tsi_value<tsi_value2
plotshape(LongCondition, title="BUY", style=shape.circle, location=location.top, color=color.green)
plotshape(ShortCondition, title="SELL", style=shape.circle, location=location.top, color=color.red)
if  strategy.openprofit>TargetProfitAll
    strategy.close_all(when=window(),comment="close all profit target")
if LongCondition and strategy.openprofit>-1
    strategy.order("BUY", strategy.long,when=window())
if ShortCondition and strategy.openprofit>-1
    strategy.order("SELL", strategy.short,when=window())
strategy.exit("SL exit a sell", "SELL", loss = StopLoss,when=window())
strategy.exit("SL exit a buy", "BUY", loss = StopLoss,when=window())