Chiến lược theo dõi xu hướng dừng lỗ thích ứng dựa trên ATR và RSI
Tổng quan
Chiến lược này kết hợp sử dụng phạm vi biến động thực trung bình (ATR), chỉ số tương đối mạnh (RSI) và dừng di động để thực hiện theo dõi xu hướng thích nghi. Sử dụng ATR để tính toán điểm dừng động, sử dụng RSI để đánh giá xu hướng của thị trường, theo dõi biến động giá để tối đa hóa lợi nhuận. Đây là một chiến lược theo dõi xu hướng rất điển hình.
Nguyên tắc chiến lược
Tính toán ATR. ATR phản ánh sự biến động và mức độ rủi ro của thị trường. Chiến lược này tính toán mức dừng động bằng ATR để thực hiện dừng tự điều chỉnh.
RSI được tính toán. RSI có thể xác định sự quá mua và quá bán của thị trường. RSI lớn hơn 50 là đà tăng và nhỏ hơn 50 là đà giảm. Chiến lược này sử dụng RSI để xác định xu hướng giá.
Theo dõi dừng chân di động. Chiến lược này theo dõi các biến động của giá, theo dõi các điểm dừng chân di động, theo dõi các điểm dừng chân theo ATR và theo định hướng của RSI để tối đa hóa lợi nhuận.
Cụ thể, khi RSI lớn hơn 50 thì mở nhiều vị trí và nhỏ hơn 50 khi mở trống. Sau đó, sử dụng giá dừng lỗ được tính toán bởi ATR để di chuyển dừng lỗ, theo dõi biến động giá.
Phân tích lợi thế
Sử dụng ATR để thực hiện dừng tự động, bạn có thể điều chỉnh mức dừng theo động thái biến động của thị trường, tránh các lỗ hổng dừng quá lớn quá nhỏ.
RSI đánh giá xu hướng chính xác và đáng tin cậy, tránh bị mắc kẹt trong thị trường bất ổn.
Đường dừng di động theo dõi biến động giá, có thể mở rộng vị trí dừng, theo dõi xu hướng để kiếm lợi nhuận.
Phân tích rủi ro
Cài đặt tham số ATR và RSI cần được kiểm tra lại và tối ưu hóa, nếu không sẽ ảnh hưởng đến hiệu quả của chiến lược.
Mặc dù có bảo vệ dừng lỗ, nhưng không thể tránh được nguy cơ bị phá vỡ dừng lỗ. Bạn có thể thu hẹp vị trí phù hợp để kiểm soát rủi ro.
Chiến lược này phụ thuộc nhiều vào các tham số tối ưu hóa cho các loại giao dịch, cần điều chỉnh các tham số cho các loại khác nhau.
Hướng tối ưu hóa
Có thể xem xét thêm thuật toán học máy để thực hiện tối ưu hóa tự thích ứng của tham số.
Thêm mô-đun kiểm soát vị trí, có thể điều chỉnh kích thước vị trí theo động lực của thị trường, giảm xác suất phá vỡ lỗ.
Tăng các chỉ số đánh giá xu hướng, tránh mất mát khi bỏ lỡ điểm đảo ngược đỉnh đáy.
Tóm tắt
Chiến lược này tích hợp các mô-đun như ATR, RSI và dừng di động để tạo thành một chiến lược theo dõi xu hướng tự thích ứng điển hình. Có thể thích ứng rất linh hoạt với các loại giao dịch khác nhau thông qua tối ưu hóa tham số, đây là một chiến lược theo dõi xu hướng chung đáng khuyên.
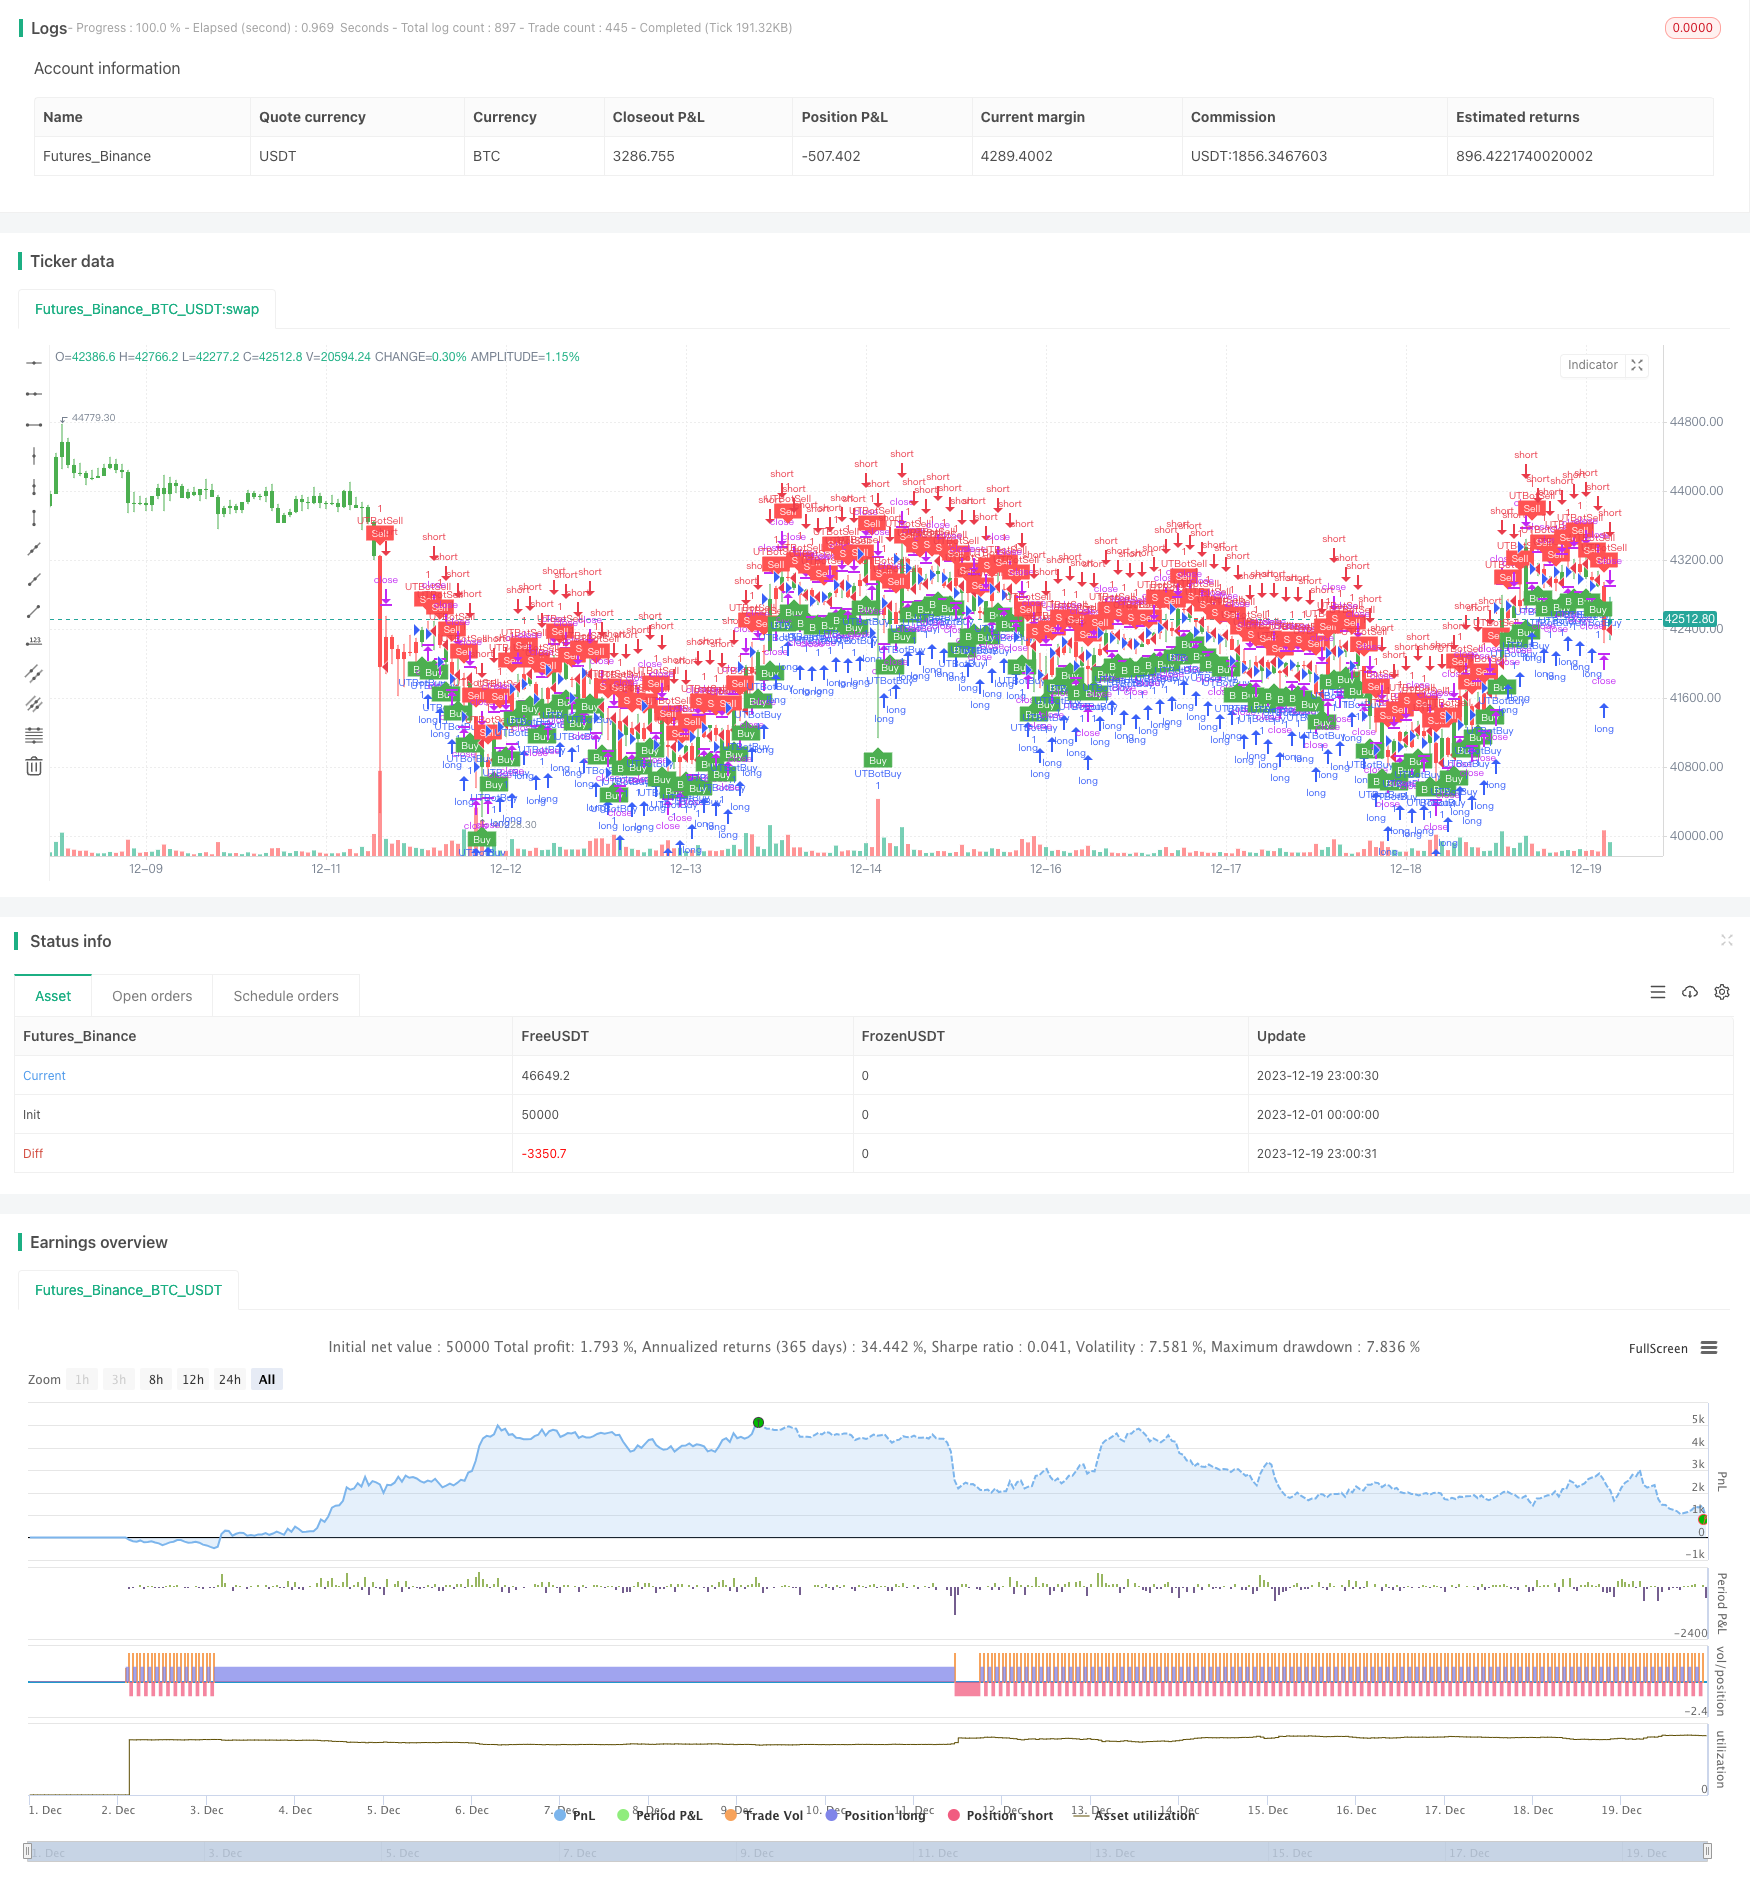
/*backtest
start: 2023-12-01 00:00:00
end: 2023-12-19 23:59:59
period: 1h
basePeriod: 15m
exchanges: [{"eid":"Futures_Binance","currency":"BTC_USDT"}]
*/

//@version=2
strategy(title="UTBot Strategy", overlay = true )

// CREDITS to @HPotter for the orginal code.
// CREDITS to @Yo_adriiiiaan for recently publishing the UT Bot study based on the original code -
// CREDITS to @TradersAITradingPlans for making this Strategy.
// Strategy fixed with Time period by Kirk65.
// I am using this UT bot with 2 hours time frame with god resultss. Alert with "Once per bar" and stoploss 1.5%. If Alerts triggered and price goes against Alert. Stoploss will catch it. Wait until next Alert.
// While @Yo_adriiiiaan mentions it works best on a 4-hour timeframe or above, witch is a lot less risky, but less profitable.

testStartYear = input(2019, "BACKTEST START YEAR", minval = 1980, maxval = 2222)
testStartMonth = input(01, "BACKTEST START MONTH", minval = 1, maxval = 12)
testStartDay = input(01, "BACKTEST START DAY", minval = 1, maxval = 31)
testPeriodStart = timestamp(testStartYear,testStartMonth,testStartDay,0,0)
testStopYear = input(2222, "BACKTEST STOP YEAR", minval=1980, maxval = 2222)
testStopMonth = input(12, "BACKTEST STOP MONTH", minval=1, maxval=12)
testStopDay = input(31, "BACKTEST STOP DAY", minval=1, maxval=31)
testPeriodStop = timestamp(testStopYear, testStopMonth, testStopDay, 0, 0)

testPeriod = true

SOURCE = input(hlc3)
RSILENGTH = input(14, title = "RSI LENGTH")
RSICENTERLINE = input(52, title = "RSI CENTER LINE")
MACDFASTLENGTH = input(7, title = "MACD FAST LENGTH")
MACDSLOWLENGTH = input(12, title = "MACD SLOW LENGTH")
MACDSIGNALSMOOTHING = input(12, title = "MACD SIGNAL SMOOTHING")
a = input(10, title = "Key Vaule. 'This changes the sensitivity'")
SmoothK = input(3)
SmoothD = input(3)
LengthRSI = input(14)
LengthStoch = input(14)
RSISource = input(close)
c = input(10, title="ATR Period")
xATR = atr(c)
nLoss = a * xATR
xATRTrailingStop = iff(close > nz(xATRTrailingStop[1], 0) and close[1] > nz(xATRTrailingStop[1], 0), max(nz(xATRTrailingStop[1]), close - nLoss),
     iff(close < nz(xATRTrailingStop[1], 0) and close[1] < nz(xATRTrailingStop[1], 0), min(nz(xATRTrailingStop[1]), close + nLoss),
     iff(close > nz(xATRTrailingStop[1], 0), close - nLoss, close + nLoss)))
pos =	iff(close[1] < nz(xATRTrailingStop[1], 0) and close > nz(xATRTrailingStop[1], 0), 1,
     iff(close[1] > nz(xATRTrailingStop[1], 0) and close < nz(xATRTrailingStop[1], 0), -1, nz(pos[1], 0)))
color = pos == -1 ? red: pos == 1 ? green : blue
ema= ema(close,1)
above = crossover(ema,xATRTrailingStop )
below = crossover(xATRTrailingStop,ema)
buy = close > xATRTrailingStop and above
sell = close < xATRTrailingStop and below
barbuy = close > xATRTrailingStop
barsell = close < xATRTrailingStop
plotshape(buy, title = "Buy", text = 'Buy', style = shape.labelup, location = location.belowbar, color= green,textcolor = white, transp = 0, size = size.tiny)
plotshape(sell, title = "Sell", text = 'Sell', style = shape.labeldown, location = location.abovebar, color= red,textcolor = white, transp = 0, size = size.tiny)
barcolor(barbuy? green:na)
barcolor(barsell? red:na)
//alertcondition(buy, title='Buy', message='Buy')
//alertcondition(sell, title='Sell', message='Sell')

if (buy)
    strategy.entry("UTBotBuy",strategy.long, when=testPeriod)
if (sell)
    strategy.entry("UTBotSell",strategy.short, when=testPeriod)