Chiến lược theo dõi xu hướng kênh giá trung bình động kép
Tổng quan
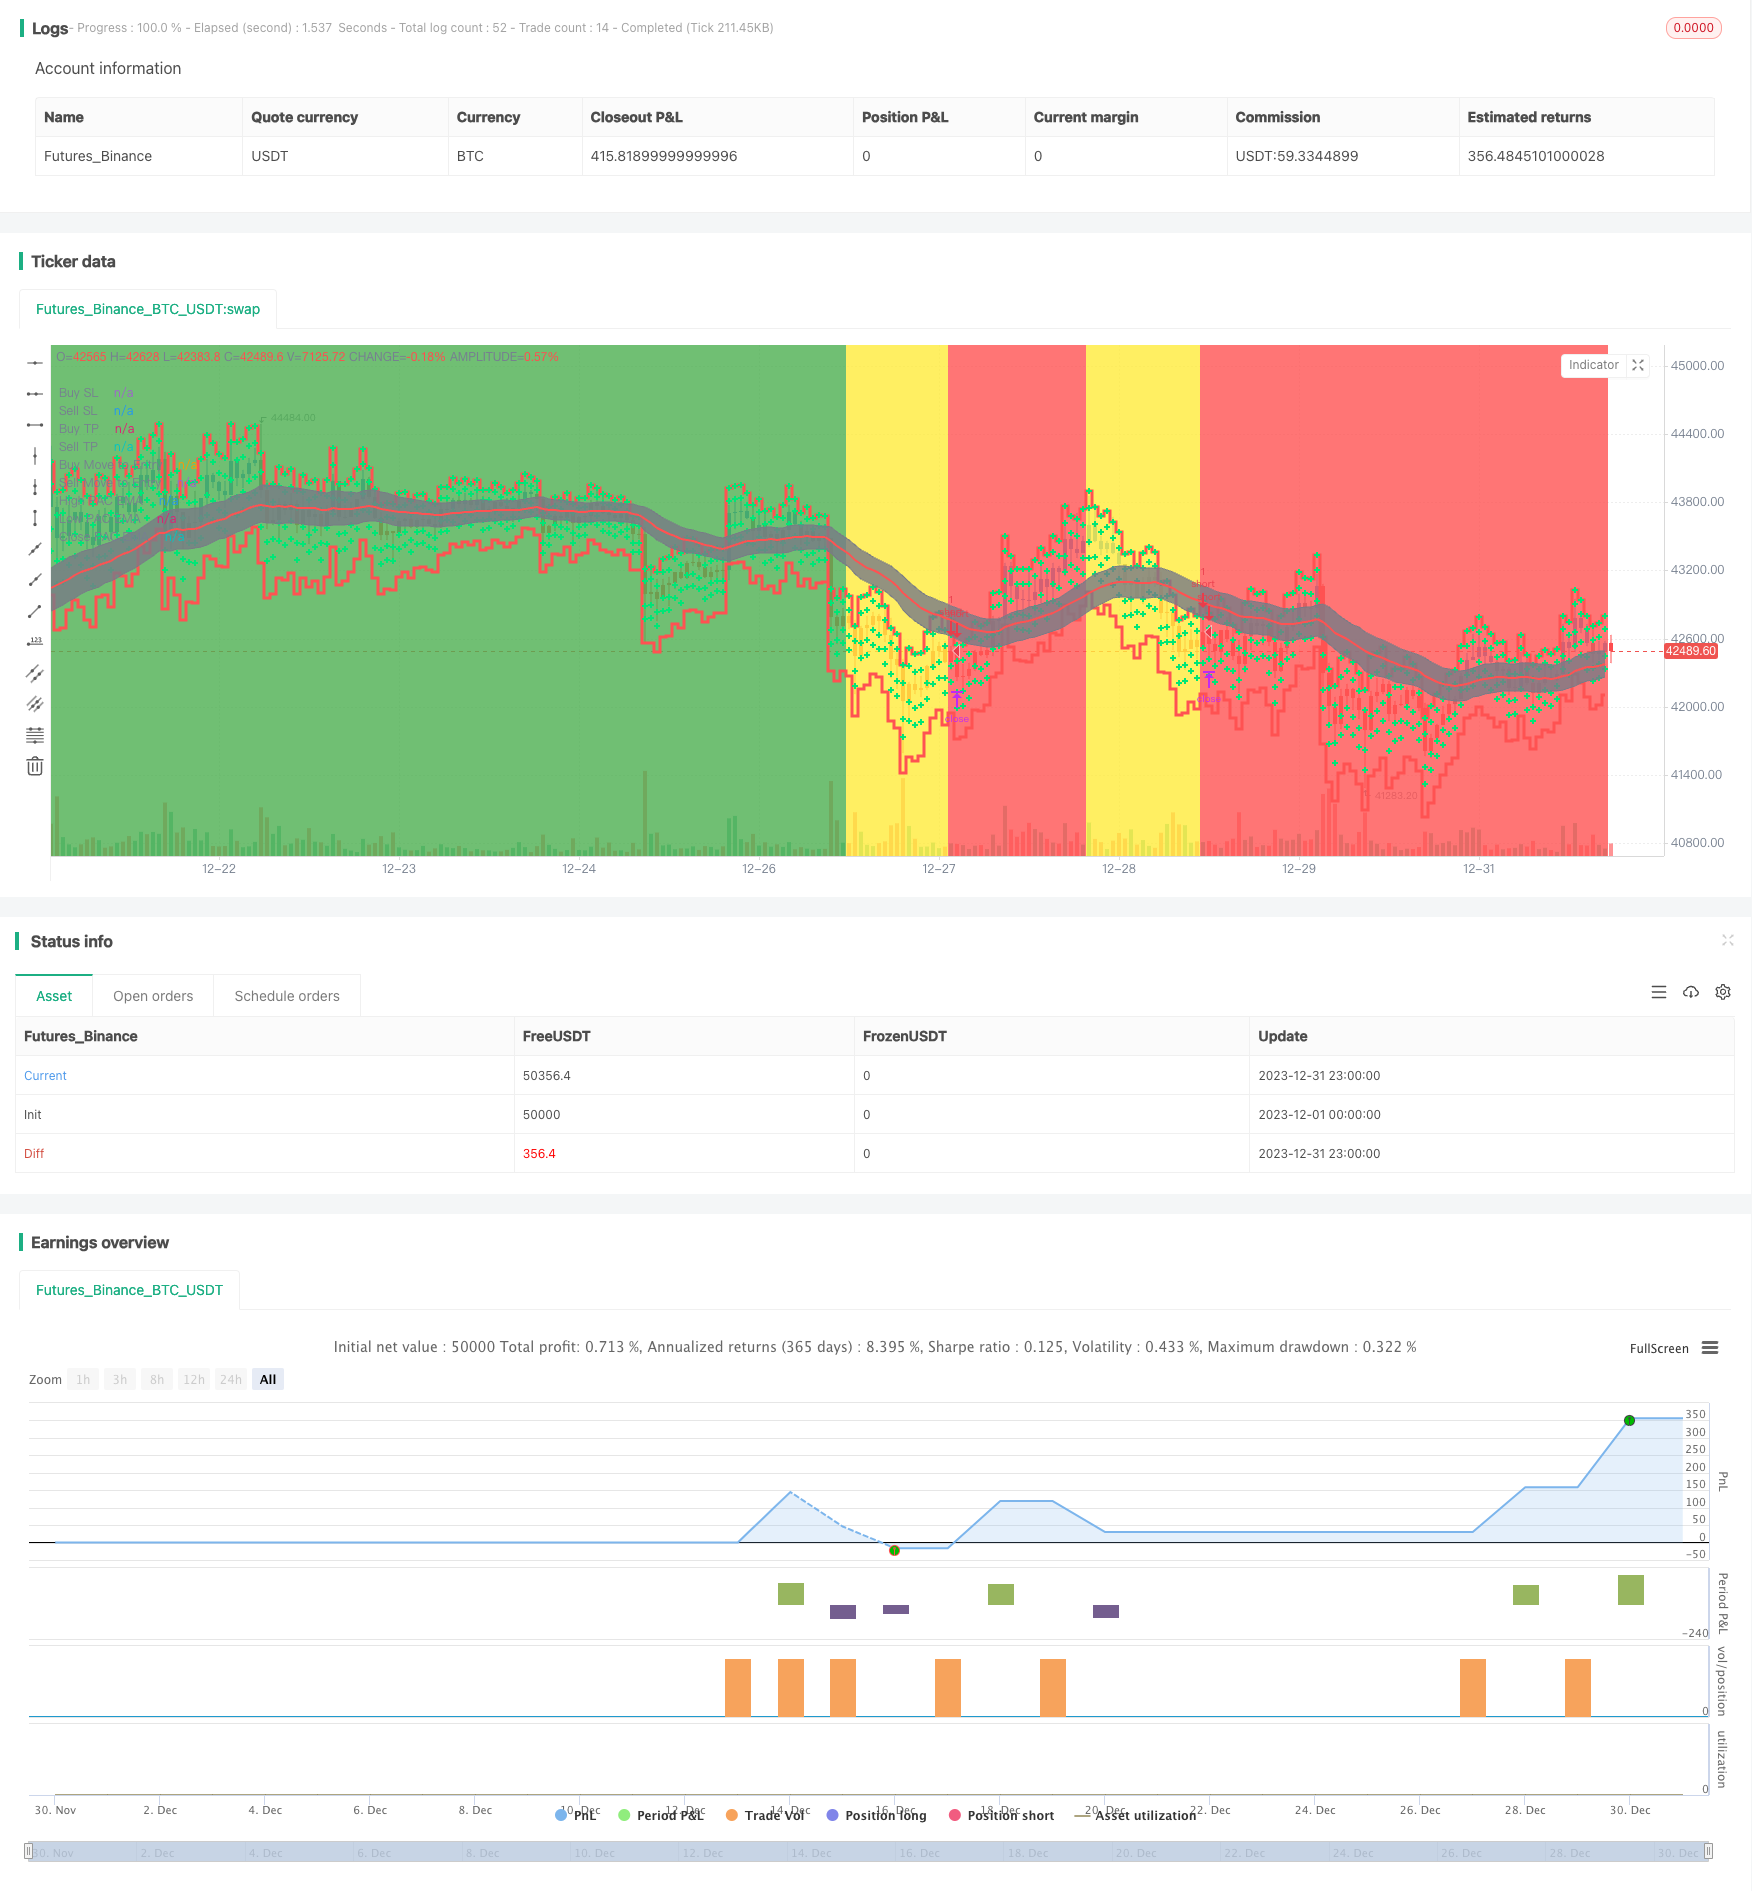
Chiến lược này dựa trên việc xây dựng một kênh giá trên đường hai chiều bằng nhau, sử dụng phạm vi kênh để đánh giá xu hướng của xu hướng giá và thiết lập một chiến lược theo dõi xu hướng theo dõi dừng để khóa lợi nhuận.
Nguyên tắc chiến lược
Chiến lược kênh giá hai đường trung bình sử dụng EMA nhanh và EMA chậm để xây dựng kênh giá. Các tham số EMA nhanh là 89 chu kỳ và tham số EMA chậm là 200 chu kỳ. Đồng thời sử dụng ba đường trung bình để xây dựng phạm vi kênh giá dựa trên giá cao, giá thấp và giá đóng cửa.
Khi EMA nhanh ở trên EMA chậm và giá thấp hơn đường ray, nó được coi là xu hướng tăng; khi EMA nhanh ở dưới EMA chậm và giá cao hơn đường ray, nó được coi là xu hướng giảm.
Trong một xu hướng tăng, chiến lược sẽ làm giảm khi xác định xu hướng đảo ngược; trong một xu hướng giảm, chiến lược sẽ làm nhiều khi xác định xu hướng đảo ngược.
Ngoài ra, chiến lược có chức năng theo dõi dừng lỗ. Sau khi giữ vị trí, nó sẽ cập nhật theo dõi giá dừng lỗ trong thời gian thực, để thực hiện khóa lợi nhuận.
Phân tích lợi thế
Lợi thế lớn nhất của chiến lược này là sử dụng đường hai chiều để xây dựng đường dẫn giá để xác định xu hướng giá, sau đó kết hợp với lệnh đảo ngược, tránh theo đuổi cao và giảm. Ngoài ra, có chức năng theo dõi lỗ hổng di động, có thể khóa lợi nhuận và giảm rủi ro mất mát.
Các ưu điểm khác là: không gian tối ưu hóa tham số lớn, có thể điều chỉnh tham số cho các giống và chu kỳ khác nhau; cập nhật giá dừng lỗ trong thời gian thực, rủi ro hoạt động thấp.
Phân tích rủi ro
Rủi ro chính của chiến lược này là hiệu quả của tín hiệu đảo ngược không tốt, có thể xảy ra sai lầm. Tại thời điểm này, cần tối ưu hóa các tham số để đảm bảo xác định hiệu quả của sự đảo ngược xu hướng.
Ngoài ra, thiết lập điểm dừng cũng rất quan trọng. Điểm dừng quá lớn có thể dẫn đến việc dừng lại không đủ quyết định; Điểm dừng quá nhỏ có thể dẫn đến việc dừng lại quá mức. Điều này cần được điều chỉnh tùy theo giống cụ thể.
Cuối cùng, các vấn đề về dữ liệu cũng có thể dẫn đến thất bại của chiến lược. Hãy đảm bảo sử dụng các chiến lược kiểm tra và xác minh thực tế bằng dữ liệu lịch sử đáng tin cậy, liên tục và đầy đủ.
Hướng tối ưu hóa
Chiến lược này đã được tối ưu hóa trong một số lĩnh vực:
Chu kỳ của EMA nhanh và EMA chậm có thể được tối ưu hóa, đặt các kết hợp tham số khác nhau để đánh giá hiệu quả
Các tham số đường lên xuống của kênh giá cũng có thể được điều chỉnh để tìm các tham số chu kỳ phù hợp hơn
Thiết lập điểm dừng là rất quan trọng, có thể thử nghiệm các tham số khác nhau để tối ưu hóa chiến lược dừng lỗ
Có thể kiểm tra xem các chỉ số khác đã được đưa ra để xác định xu hướng đảo ngược, tăng hiệu quả đơn lẻ
Tóm tắt
Chiến lược này hoạt động một cách hợp lý và trơn tru, sử dụng kênh hai đường bằng nhau để xác định hướng xu hướng và khóa lợi nhuận với dừng di chuyển, là một chiến lược theo dõi xu hướng ổn định hơn. Bằng cách tối ưu hóa các tham số và tối ưu hóa cài đặt kiểm soát gió, chiến lược này có thể trở thành một trong những chiến lược giao dịch định lượng hiệu quả.
/*backtest
start: 2023-12-01 00:00:00
end: 2023-12-31 23:59:59
period: 1h
basePeriod: 15m
exchanges: [{"eid":"Futures_Binance","currency":"BTC_USDT"}]
*/

//@version=4
strategy("Trend trader Strategy", overlay=true)

//f you want to trade shallower Pullbacks for quicker scalps, try reducing the
//    PAC and EMA combination lengths for example:
//      * 21 PAC and 55, 144, 377 for fast, medium, slow EMAs
//      * 13 PAC and 34, 89, 233 for fast, medium, slow EMAs
//  - Each alert should be evaluated on it's own merits, the alerts are designed to highlight possible
//    scalping trades from Pullback recoveries around the PAC.

fromDay = input(defval = 1, title = "From Day", minval = 1, maxval = 31)
fromMonth = input(defval = 6, title = "From Month", minval = 1, maxval = 12)
fromYear = input(defval = 2020, title = "From Year", minval = 1970)

// To Date Inputs
toDay = input(defval = 1, title = "To Day", minval = 1, maxval = 31)
toMonth = input(defval = 12, title = "To Month", minval = 1, maxval = 12)
toYear = input(defval = 2020, title = "To Year", minval = 1970)

isMon() => dayofweek(time('D')) == dayofweek.monday
isTue() => dayofweek(time('D')) == dayofweek.tuesday
isWed() => dayofweek(time('D')) == dayofweek.wednesday
isThu() => dayofweek(time('D')) == dayofweek.thursday
isFri() => dayofweek(time('D')) == dayofweek.friday

// Calculate start/end date and time condition
DST = 1 //day light saving for usa
//--- Europe
London = iff(DST==0,"0000-0900","0100-1000")
//--- America
NewYork = iff(DST==0,"0400-1400","0500-1500")
//--- Pacific
Sydney = iff(DST==0,"1300-2200","1400-2300")
//--- Asia
Tokyo = iff(DST==0,"1500-2400","1600-0100")

customTime =iff(DST==0,"2300-1500","2400-1600")
customTime2 =iff(DST==0,"0800-1500","0900-1600")

//-- Time In Range
timeinrange(res, sess) => time(res, sess) != 0

london = timeinrange(timeframe.period, London)
newyork = timeinrange(timeframe.period, NewYork)
c_time = timeinrange(timeframe.period,customTime)
c_time2 = timeinrange(timeframe.period,customTime2)

startDate = timestamp(fromYear, fromMonth, fromDay, 00, 00)
finishDate = timestamp(toYear, toMonth, toDay, 00, 00)
time_cond = time >= startDate and time <= finishDate and (london or newyork)


    // === INPUTS ===
HiLoLen         = input(34, minval=2, title="High Low PAC channel Length")
fastEMAlength   = input(89, minval=2)
mediumEMAlength = input(200, minval=2)
slowEMAlength   = input(600, minval=2)
ShowFastEMA     = input(false)
ShowMediumEMA   = input(false)
ShowSlowEMA     = input(false)
ShowHHLL        = input(false)
ShowFractals    = input(false)
filterBW        = input(false, title="Show Ideal Fractals Only")
ShowBarColor    = input(true, title="Show coloured Bars around PAC")
ShowBuySell     = input(false, title="Show Buy/Sell Alert Arrows")
Lookback        = input(3, minval=1, title="Pullback Lookback for PAC Cross Check")
DelayArrow      = input(false, title="Show Alert Arrows Only on Closed Candles")
Delay           = DelayArrow ? 1 : 0
ShowTrendBGcolor= input(true)
UseHAcandles    = input(false, title="Use Heikin Ashi Candles in Algo Calculations")
//
// === /INPUTS ===

// === BASE FUNCTIONS ===

haClose = UseHAcandles ? security(heikinashi(syminfo.tickerid), timeframe.period, close) : close
haOpen  = UseHAcandles ? security(heikinashi(syminfo.tickerid), timeframe.period, open) : open
haHigh  = UseHAcandles ? security(heikinashi(syminfo.tickerid), timeframe.period, high) : high
haLow   = UseHAcandles ? security(heikinashi(syminfo.tickerid), timeframe.period, low) : low


//  ||---   Fractal Recognition Functions:  ---------------------------------------------------------------||
isRegularFractal(mode) =>
    ret = mode == 1 ? high[4] < high[3] and high[3] < high[2] and high[2] > high[1] and
       high[1] > high[0] : mode == -1 ?
       low[4] > low[3] and low[3] > low[2] and low[2] < low[1] and low[1] < low[0] :
       false
    ret

isBWFractal(mode) =>
    ret = mode == 1 ? high[4] < high[2] and high[3] <= high[2] and high[2] >= high[1] and
       high[2] > high[0] : mode == -1 ?
       low[4] > low[2] and low[3] >= low[2] and low[2] <= low[1] and low[2] < low[0] :
       false
    ret
//  ||-----------------------------------------------------------------------------------------------------||

//
// === /BASE FUNCTIONS ===

// === SERIES SETUP ===
//

//  ||---   Setup Moving Averages and PAC channel:
//  ||-----------------------------------------------------------------------------------------------------||
fastEMA     = ema(haClose, fastEMAlength)
mediumEMA   = ema(haClose, mediumEMAlength)
slowEMA     = ema(haClose, slowEMAlength)
pacC        = ema(haClose, HiLoLen)
pacL        = ema(haLow, HiLoLen)
pacU        = ema(haHigh, HiLoLen)
TrendDirection = fastEMA > mediumEMA and pacL > mediumEMA ? 1 :
   fastEMA < mediumEMA and pacU < mediumEMA ? -1 : 0

//  ||---   Fractal Recognition:
//  ||-----------------------------------------------------------------------------------------------------||
filteredtopf = filterBW ? isRegularFractal(1) : isBWFractal(1)
filteredbotf = filterBW ? isRegularFractal(-1) : isBWFractal(-1)
//  ||-----------------------------------------------------------------------------------------------------||
//  ||---   Higher Highs, Lower Highs, Higher Lows, Lower Lows  -------------------------------------------||
valuewhen_H0 = valuewhen(filteredtopf == true, high[2], 0)
valuewhen_H1 = valuewhen(filteredtopf == true, high[2], 1)
valuewhen_H2 = valuewhen(filteredtopf == true, high[2], 2)
//
higherhigh = filteredtopf == false ? false :
   valuewhen_H1 < valuewhen_H0 and valuewhen_H2 < valuewhen_H0
lowerhigh = filteredtopf == false ? false :
   valuewhen_H1 > valuewhen_H0 and valuewhen_H2 > valuewhen_H0
valuewhen_L0 = valuewhen(filteredbotf == true, low[2], 0)
valuewhen_L1 = valuewhen(filteredbotf == true, low[2], 1)
valuewhen_L2 = valuewhen(filteredbotf == true, low[2], 2)
//
higherlow = filteredbotf == false ? false :
   valuewhen_L1 < valuewhen_L0 and valuewhen_L2 < valuewhen_L0
lowerlow = filteredbotf == false ? false :
   valuewhen_L1 > valuewhen_L0 and valuewhen_L2 > valuewhen_L0

//
// === /SERIES ===

//
// === PLOTTING ===
//
// Plot the Price Action Channel (PAC) base on EMA high,low and close
L = plot(pacL, color=color.gray, linewidth=1, title="High PAC EMA", transp=50)
U = plot(pacU, color=color.gray, linewidth=1, title="Low PAC EMA", transp=50)
C = plot(pacC, color=color.red, linewidth=2, title="Close PAC EMA", transp=0)
fill(L, U, color=color.gray, transp=90, title="Fill HiLo PAC")

// Colour bars according to the close position relative to the PAC selected.
BARcolor = haClose > pacU ? color.blue : haClose < pacL ? color.red : color.gray
barcolor(ShowBarColor ? BARcolor : na, title="Bar Colours")
//
BGcolor = TrendDirection == 1 ? color.green :
   TrendDirection == -1 ? color.red : color.yellow
bgcolor(ShowTrendBGcolor ? BGcolor : na, transp=90, title="Trend BG Color")


// STEP 1:
// Configure trail stop level with input options (optional)
longTrailPerc = input(title="Trail Long Loss (%)",
     type=input.float, minval=0.0, step=0.05, defval=0.1) * 0.01

shortTrailPerc = input(title="Trail Short Loss (%)",
     type=input.float, minval=0.0, step=0.05, defval=0.1) * 0.01


atrRange = input(14, title="ATR Range", type=input.integer)
buyStop = input(2, title="* ATR Buy SL", type=input.float)
sellStop = input(1, title="* ATR Sell SL", type=input.float)
targetATR = input(1, title="* ATR TP1", type=input.float)
moveToEntryFigure = input(0.5, title=" move to entry in % towards target", type=input.float)

showMove = input(true, title="Show Move to Entry points")

showMoveBuycol = showMove ? color.lime : na
showMoveSellcol = showMove ? color.lime : na

// Plots

buyStopp = plot(close - atr(atrRange) * buyStop, title="Buy SL", style=plot.style_stepline, color=color.red, transp=75, linewidth=3)
sellStopp = plot(close + atr(atrRange) * sellStop, title="Sell SL", style=plot.style_stepline, color=color.red, transp=75, linewidth=3)

buyTP1 = plot(close + atr(atrRange) * targetATR, title="Buy TP", style=plot.style_cross, color=color.lime, transp=75, linewidth=3)
sellTP1 = plot(close - atr(atrRange) * targetATR, title="Sell TP", style=plot.style_cross, color=color.lime, transp=75, linewidth=3)

buyMove = plot(close + atr(atrRange) * targetATR * moveToEntryFigure, title="Buy Move to Entry", style=plot.style_cross, color=showMoveBuycol, transp=75, linewidth=3)
sellMove = plot(close - atr(atrRange) * targetATR * moveToEntryFigure, title="Sell Move to Entry", style=plot.style_cross, color=showMoveSellcol, transp=75, linewidth=3)


if barstate.isconfirmed
    if(BGcolor==color.red and BGcolor[1]==color.yellow and c_time )
        strategy.entry("short", strategy.short, comment="short", alert_message='short')
        strategy.cancel("long")
    if(BGcolor==color.green and BGcolor[1]==color.yellow and c_time )
        strategy.entry("long", strategy.long, comment="long", alert_message = 'long')
        strategy.cancel("short")


// STEP 2:
// Determine trail stop loss prices
longStopPrice = 0.0, shortStopPrice = 0.0

longStopPrice := if (strategy.position_size > 0)
    stopValue = close * (1 - longTrailPerc)
    max(stopValue, longStopPrice[1])
else
    0

shortStopPrice := if (strategy.position_size < 0)
    stopValue = close * (1 + shortTrailPerc)
    min(stopValue, shortStopPrice[1])
else
    999999

// Plot stop loss values for confirmation
plot(series=(strategy.position_size > 0) ? longStopPrice : na,
     color=color.fuchsia, style=plot.style_cross,
     linewidth=2, title="Long Trail Stop")
plot(series=(strategy.position_size < 0) ? shortStopPrice : na,
     color=color.fuchsia, style=plot.style_cross,
     linewidth=2, title="Short Trail Stop")


// STEP 3:
// Submit exit orders for trail stop loss price
//if (strategy.position_size > 0)
//    strategy.exit("XL TRL STP","long", stop=longStopPrice)

//if (strategy.position_size < 0)
//    strategy.exit("XS TRL STP","short", stop=shortStopPrice)


tp=input(0.0032,type=input.float, title="tp")
sl=input(0.001,type=input.float, title="sl")

//strategy.close("long", when= tp/2,qty_percent = 50)

//strategy.exit("longtp/sl","long",profit=tp, loss=sl, stop=longStopPrice, alert_message='closelong')
//strategy.exit("shorttp/sl","short",profit=tp, loss=sl, stop=shortStopPrice, alert_message='closeshort')

//tpatrlong= close + atr(atrRange) * targetATR
//slatrlong= close - atr(atrRange) * buyStop

//strategy.exit("longtp/sl","long",profit=tp, loss=sl, alert_message='closelong')
//strategy.exit("shorttp/sl","short",profit=tp, loss=sl, alert_message='closeshort')

strategy.exit("closelong", "long" , profit = close * tp / syminfo.mintick, loss = close * sl / syminfo.mintick, alert_message = "closelong")
strategy.exit("closeshort", "short" , profit = close * tp / syminfo.mintick, loss = close * sl / syminfo.mintick, alert_message = "closeshort")

if(BGcolor==color.yellow or not c_time)
    strategy.close("short", comment="time or yellow", alert_message='closeshort')
    strategy.close("long", comment="time or yellow", alert_message='closelong')