স্টোকাস্টিক RSI এবং EMA এর উপর ভিত্তি করে স্বায়ত্তশাসিত বাই-সুইং স্ক্যাল্পার কৌশল

ওভারভিউ
এই কৌশলটি একটি স্কাল্পার ট্রেডিং কৌশল যা স্বতঃস্ফূর্তভাবে মুদ্রা ক্রয় এবং ধারণ করে, যা র্যান্ডম সূচক সমতল চলমান গড় (RSI) এবং সূচকীয় চলমান গড় (EMA) উপর ভিত্তি করে। এটি 5 মিনিটের K লাইনের জন্য প্রযোজ্য এবং বিটিসির জন্য অপ্টিমাইজ করা হয়েছে। কৌশলটির লক্ষ্য হ'ল যতটা সম্ভব মুদ্রা ধরে রাখা যখন এটি ক্রসওভার হয় বা খুব বেশি পড়ে না।
কৌশল নীতি
এই কৌশলটি RSI সূচককে ব্যবহার করে ওভার-বই ওভার-সোল্ড অঞ্চলে রয়েছে কিনা তা নির্ধারণ করে এবং একটি কে এবং ডি মানের সাথে র্যান্ডম RSI সূচকের সম্পর্ককে কেনার এবং বিক্রি করার জন্য সংকেত দেয়।
যখন র্যান্ডম আরএসআই এর কে লাইন ২০ এর নিচে থাকে তখন ওভারসোল্ড বলে গণ্য করা হয় এবং কে লাইনটি ডি লাইনের চেয়ে বড় হলে কেনার সংকেত দেওয়া হয়। এর পরে, তিনটি শর্তের ভিত্তিতে বিক্রি করা হবে কিনা তা বিচার করা হবেঃ 1) দাম 1% এর বেশি বেড়ে গেলে ইএমএ উল্টে যায়; 2) যখন র্যান্ডম আরএসআই এর কে লাইনটি ডি লাইনের নিচে থাকে; 3) যখন স্টপডাউন মূল্য প্রবেশের দামের 98.5% পৌঁছে যায়।
উপরন্তু, স্বল্পমেয়াদী ইএমএ-র পতন যখন একটি উত্থানের পরে ঘটে তখন এটি একটি বিক্রয় সংকেত হিসাবে বিবেচিত হয়।
কৌশলগত সুবিধা
- এলোমেলো RSI সূচক ব্যবহার করে কেনার সময় নির্ধারণ করা আরও নির্ভরযোগ্য, যা কার্যকরভাবে জাল ব্রেকআপগুলি ফিল্টার করতে পারে।
- ইএমএ সূচকগুলির সাথে মিলিত হয়ে ট্রেন্ড পরিবর্তনের সময়কে আরও ভালভাবে বিচার করা যায়।
- স্টপ লস কার্যকরভাবে ক্ষতি নিয়ন্ত্রণ করতে পারে।
- যতটা সম্ভব মুদ্রা ধরে রাখা লেনদেনের ঘনত্ব এবং কমিশন হ্রাস করতে পারে।
কৌশলগত ঝুঁকি
- আরএসআই সূচকটি মিথ্যা সংকেত দেওয়ার সম্ভাবনা রয়েছে। আরএসআই প্যারামিটারগুলি যথাযথভাবে সামঞ্জস্য করার জন্য অনুকূলিতকরণ করা যেতে পারে
- স্টপ প্রাইস সেট করা খুব ছোট হলে ক্ষতির পরিমাণ বাড়তে পারে। স্টপ প্রাইসের পরিমাণ যথাযথভাবে সামঞ্জস্য করা যেতে পারে।
- ইএমএ সূচক প্যারামিটারগুলি ভুলভাবে সেট করা ট্রেন্ড পরিবর্তনের সময়টি মিস করতে পারে। বিভিন্ন ইএমএ চক্রের প্যারামিটারগুলি পরীক্ষা করা যেতে পারে।
অপ্টিমাইজেশান দিক
- বিভিন্ন RSI এবং র্যান্ডম RSI প্যারামিটার সেটিং পরীক্ষা করে সর্বোত্তম প্যারামিটার সমন্বয় খুঁজুন
- বিভিন্ন স্টপ লস ম্যাট্রিক্স চেষ্টা করুন যাতে ক্ষতি এবং মুনাফা প্রত্যাহারের মধ্যে ভারসাম্য থাকে
- ট্রেন্ড পরিবর্তনের সর্বোত্তম নির্ধারক প্যারামিটার নির্ধারণের জন্য EMA-এর দীর্ঘ- এবং স্বল্প-চক্রের সমন্বয় পরীক্ষা করা
- ক্রয়-বিক্রয় সময় নির্ধারণের সঠিকতা বাড়াতে অন্যান্য সূচক যুক্ত করার কথা বিবেচনা করা যেতে পারে
সারসংক্ষেপ
এই কৌশলটি র্যান্ডম আরএসআই এবং ইএমএর মতো একাধিক সূচকের সুবিধাগুলিকে একত্রিত করে এবং ক্রয় এবং বিক্রয়ের সময় নির্ধারণের জন্য একটি আরও শক্তিশালী পদ্ধতি ব্যবহার করে। প্যারামিটার অপ্টিমাইজেশন এবং ঝুঁকি পরিচালনার মাধ্যমে কৌশলটির আয় এবং স্থিতিশীলতা আরও বাড়ানো যেতে পারে। সামগ্রিকভাবে, কৌশলটি যুক্তিসঙ্গতভাবে যুক্তিসঙ্গত এবং রিয়েল-টাইমে যাচাই এবং অপ্টিমাইজেশনের জন্য উপযুক্ত।
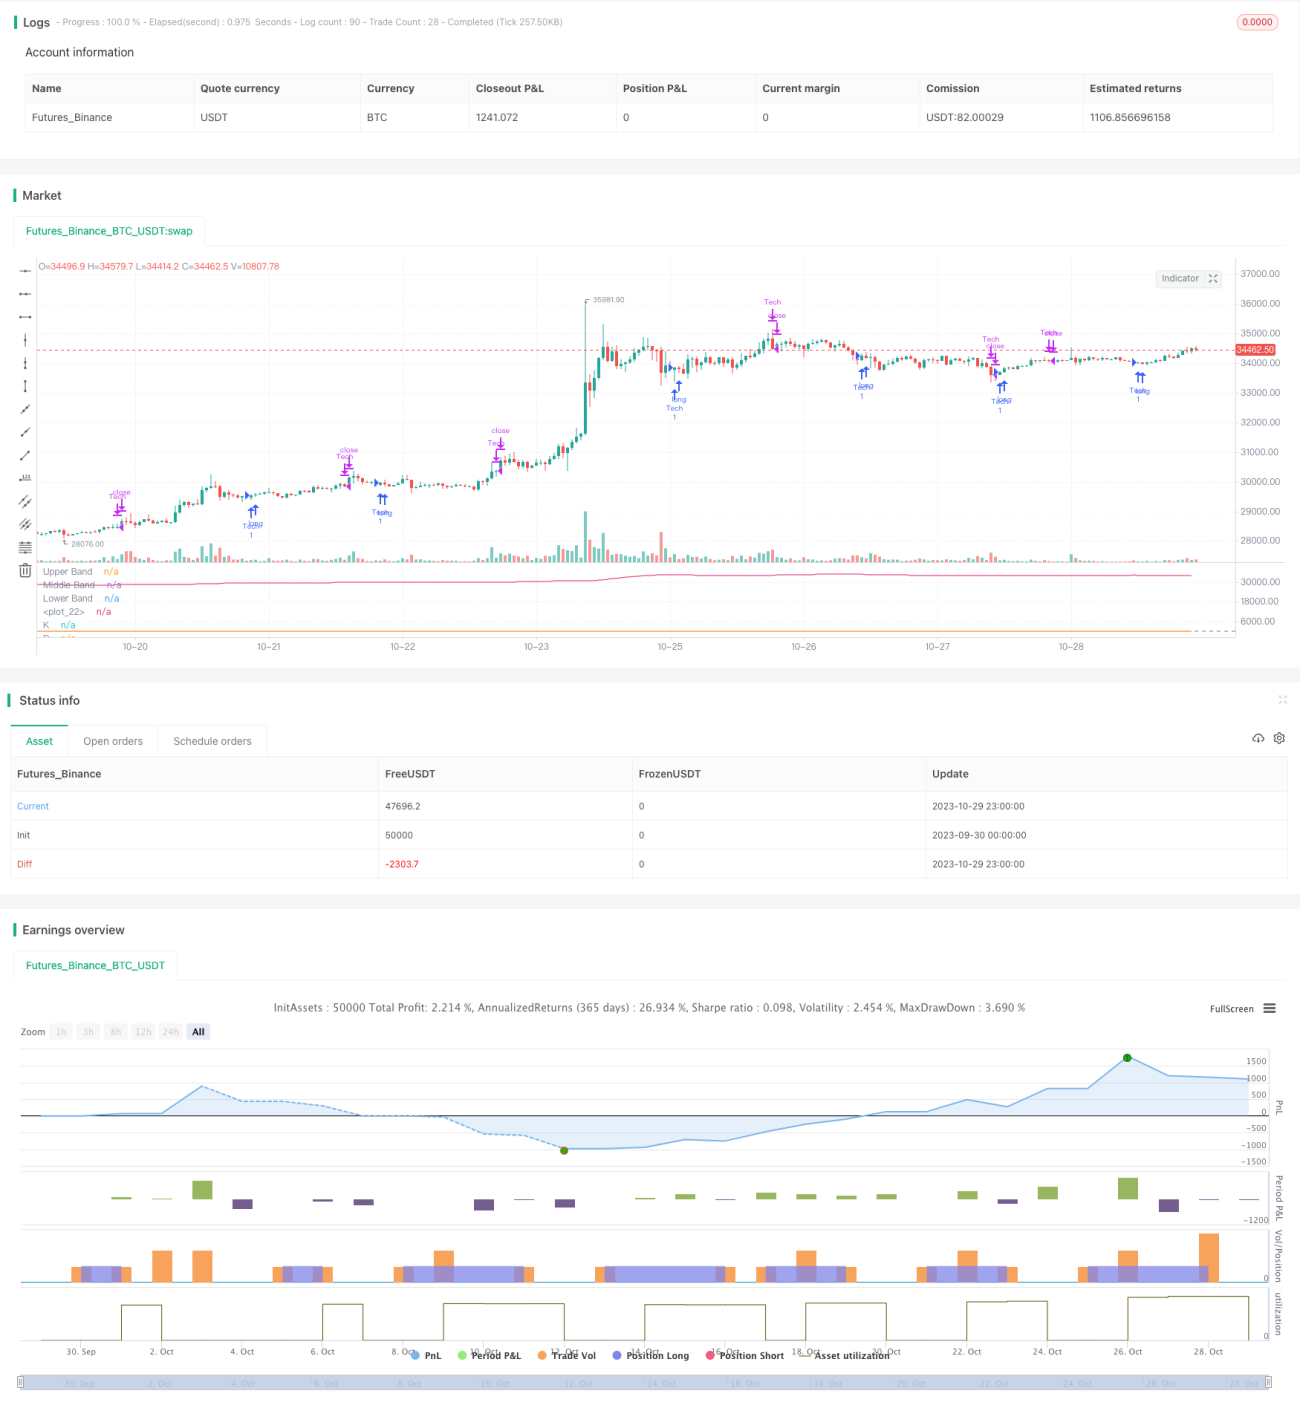
/*backtest
start: 2023-09-30 00:00:00
end: 2023-10-30 00:00:00
period: 1h
basePeriod: 15m
exchanges: [{"eid":"Futures_Binance","currency":"BTC_USDT"}]
*/

//@version=5
strategy(title="Stochastic RSI W Auto Buy Scalper Scirpt III ", shorttitle="Stoch RSI_III", format=format.price, precision=2)
smoothK = input.int(3, "K", minval=1)
smoothD = input.int(3, "D", minval=1)- 1