মোমেন্টাম ট্রেন্ড অনুসরণ কৌশল


সৃষ্টির তারিখ: 2023-11-07 16:49:49 অবশেষে সংশোধন করুন: 2023-11-07 16:49:49
অনুলিপি: 0 ক্লিকের সংখ্যা: 650
1
ফোকাস
1617
অনুসারী

মোমেন্টাম ট্রেন্ড অনুসরণ কৌশল

ওভারভিউ

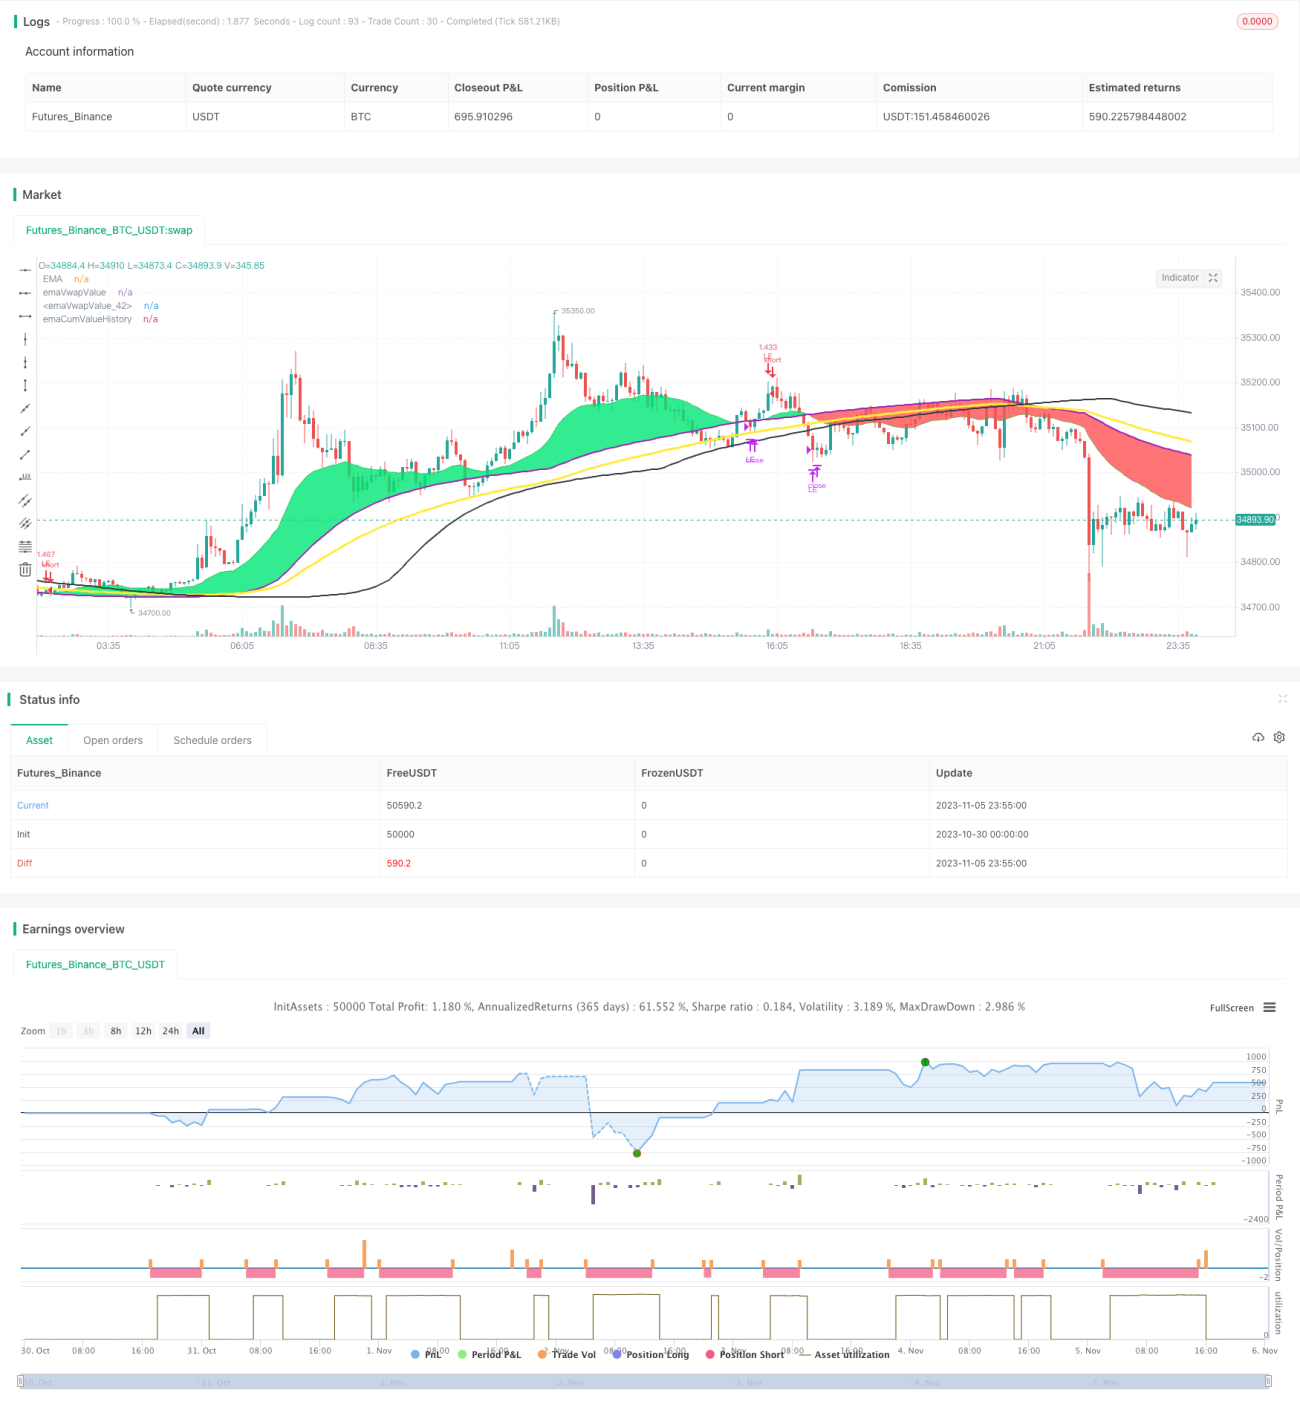
এই কৌশলটি চলমান গড় এবং লেনদেনের পরিমাণের উপর ভিত্তি করে প্রবণতা বিশ্লেষণ করে, গতিশীলতার সূচক নির্ধারণ করে এবং ট্রেন্ড ট্র্যাকিং পদ্ধতিতে ক্রয়-বিক্রয় পরিচালনা করে।

কৌশল নীতি

  1. ক্লোজ প্রাইসের EMA গড় এবং ক্রয়-বিক্রয় পরিমাণের EMA গড় গণনা করুন
  2. EMA-তে ক্লোজ করার সময় এটিকে উচ্চতর ট্রেন্ড হিসাবে বিবেচনা করুন এবং একাধিক হেড অপারেশন করুন
  3. ক্রমবর্ধমান হিসাবে, ক্রমবর্ধমান EMA এর দ্বিগুণ গড় লাইন অতিক্রম করার সময় বন্ধ করুন, অতিরিক্ত অবস্থান যোগ করুন
  4. আরএসআই সূচক সেট করুন, আরএসআই 90 এর বেশি হলে 1 / 3 পয়েন্ট মুনাফা বন্ধ করুন
  5. যখন EMA-এর নিচে ক্লোজ হয়, তখন এটিকে একটি নিম্নমুখী ট্রেন্ড হিসাবে বিবেচনা করুন এবং সমস্ত ওভারহেড পজিশনগুলিকে সমতল করুন
  6. যখন EMA-এর নিচে ক্লোজ হয়, তখন এটিকে নিম্নমুখী ট্রেন্ড হিসেবে বিবেচনা করা হয়, এবং একটি ফাঁকা অপারেশন করা হয়
  7. একটি স্টপ লাইন সেট করুন যেখানে স্টপ লাইনটি প্রবেশের দামের একটি নির্দিষ্ট শতাংশ
  8. শূন্য মাথা লাভের উপায়

সামর্থ্য বিশ্লেষণ

এই কৌশলটির প্রধান সুবিধাগুলি হলঃ

  1. EMA গড়ের সাহায্যে ট্রেন্ড নির্ধারণ করা যায়, যা কার্যকরভাবে ট্রেন্ড ট্র্যাক করতে সাহায্য করে
  2. ট্রেন্ডের প্রকৃত পরিবর্তনের জন্য ক্রমবর্ধমান EMA ব্যবহার করা হয়
  3. আরএসআই-এর গতিশীলতার উপর নজর রেখে মুনাফা অর্জন করা
  4. ঝুঁকি নিয়ন্ত্রণে, স্টপ লিন্ড
  5. প্যারামিটারগুলিকে নমনীয়ভাবে সামঞ্জস্য করতে পারে

ঝুঁকি বিশ্লেষণ

এই কৌশলটির প্রধান ঝুঁকিগুলো হলঃ

  1. ইএমএ গড় লাইন পিছিয়ে আছে, সম্ভবত পাল্টা পয়েন্ট মিস করেছে
  2. ট্রান্সফার ডেস্কঃ ট্রান্সফার ডেস্কঃ ট্রান্সফার ডেস্কঃ
  3. ফিক্সড শতাংশ ক্ষতি খুব যান্ত্রিক হতে পারে
  4. প্যারামেটারের সংখ্যা অনেক বেশি
  5. লেনদেনের ঘনত্ব, লেনদেনের খরচ বেশি

ঝুঁকি মোকাবেলার উপায়ঃ

  1. ইএমএ প্যারামিটার অপ্টিমাইজ করুন এবং পিছিয়ে পড়া হ্রাস করুন
  2. অন্যান্য সূচকগুলির সাথে মিলিত ট্রানজিট নিশ্চিতকরণ সংকেত
  3. বাজারের অবস্থার উপর ভিত্তি করে স্টপ লস অপ্টিমাইজ করুন
  4. প্যারামিটার সরল করুন, শুধুমাত্র প্রাথমিক সেটিংস সংরক্ষণ করুন
  5. যথাযথভাবে স্টপ লোন এবং ট্রেডিং ফ্রিকোয়েন্সি শিথিল করুন

অপ্টিমাইজেশান দিক

এই কৌশলটি নিম্নলিখিত দিকগুলি থেকে উন্নত করা যেতে পারেঃ

  1. বিভিন্ন EMA প্যারামিটার সেটিং পরীক্ষা করুন এবং সর্বোত্তম প্যারামিটার সমন্বয় খুঁজুন
  2. ইনপুট সংকেত শক্তিশালী বা দুর্বল হিসাবে VOLUME গুণক বৃদ্ধি
  3. এমএসিডি, কেডি ইত্যাদির মতো অন্যান্য সূচকগুলির সাথে ভর্তি নিশ্চিতকরণ
  4. নির্দিষ্ট শেয়ারের বৈশিষ্ট্য অনুসারে অপ্টিমাইজড স্টপ লস শতাংশ
  5. ট্রেডিং ফ্রিকোয়েন্সি অপ্টিমাইজ করুন, ট্রেডিং খরচ কমিয়ে আনুন

সারসংক্ষেপ

এই কৌশলটি সামগ্রিকভাবে একটি সমান্তরাল সিস্টেমের উপর ভিত্তি করে একটি প্রবণতা ট্র্যাকিং কৌশল। মূল ধারণাটি হ’ল ইএমএ ব্যবহার করে প্রবণতার দিকনির্দেশনা নির্ধারণ করা এবং ভলিউম গতিশীলতার সূচকগুলির সাথে মিলিত হয়ে প্রবেশের বিষয়টি নিশ্চিত করা। প্যারামিটার অপ্টিমাইজেশনের মাধ্যমে ক্রমাগত অপ্টিমাইজ করা যেতে পারে এবং অন্যান্য সূচকগুলিকে আরও নিশ্চিত করতে সহায়তা করে। সামগ্রিকভাবে একটি নমনীয় প্রবণতা ট্র্যাকিং কৌশল, যা দক্ষতার সাথে ব্যবহারের পরে ভাল রিটার্ন অর্জন করতে পারে।

কৌশল সোর্স কোড
/*backtest
start: 2023-10-30 00:00:00
end: 2023-11-06 00:00:00
period: 5m
basePeriod: 1m
exchanges: [{"eid":"Futures_Binance","currency":"BTC_USDT"}]
*/

// This source code is subject to the terms of the Mozilla Public License 2.0 at https://mozilla.org/MPL/2.0/
// © mohanee

//@version=4
strategy("EMA_cumulativeVolume_crossover[Strategy]", overlay=true, pyramiding=5, default_qty_type=strategy.percent_of_equity,  default_qty_value=20, initial_capital=10000)


emaLength= input(25, title="EMA Length", minval=1, maxval=200)
cumulativePeriod = input(100,  title="cumulative volume Period", minval=1, maxval=200)


riskCapital = input(title="Risk % of capital", defval=10, minval=1)
stopLoss=input(8,title="Stop Loss",minval=1)
takePartialProfits=input(true, title="take partial profits  (percentage same as stop loss)")

tradeDirection=input(title="Trade Direction", defval="LONG", options=["LONG", "SHORT"])

avgPrice = (high + low + close) / 3
avgPriceVolume = avgPrice * volume

cumulPriceVolume = sum(avgPriceVolume, cumulativePeriod)
cumulVolume = sum(volume, cumulativePeriod)

cumValue = cumulPriceVolume / cumulVolume

emaVal=ema(close, emaLength)

emaCumValue1=ema(cumValue, emaLength)
emaCumValue2=ema(cumValue, emaLength*2)

emaCumValueHistory=ema(cumValue[emaLength], emaLength)


//vwapVal1=vwap(hlc3)

rsiVal=rsi(close,5)

plotEma=plot(emaVal, title="EMA", color=color.green,  transp=25)
//plot(vwapValue, title="Cumulate Volumne", color=color.orange,  linewidth=2, transp=25)
//plot(vwapVal1, title="vwapVal1", color=color.purple,  linewidth=1, transp=25)
plotCum=plot(emaCumValue1, title="emaVwapValue", color=color.purple,  linewidth=2, transp=35)
plot(emaCumValue2, title="emaVwapValue", color=color.yellow,  linewidth=3, transp=25)
fill(plotEma,plotCum, color=emaVal>emaCumValue1 ? color.lime : color.red, transp=35, title="ema and cum area")

plot(emaCumValueHistory, title="emaCumValueHistory", color=color.black,  linewidth=2, transp=25)


//bgcolor(emaVal>vwapValue?color.blue:color.purple)    

//Entry--
//Echeck how many units can be purchased based on risk manage ment and stop loss
qty1 = (strategy.equity  * riskCapital / 100 ) /  (close*stopLoss/100)  

//check if cash is sufficient  to buy qty1  , if capital not available use the available capital only
qty1:= (qty1 * close >= strategy.equity ) ? (strategy.equity / close) : qty1

//strategy.entry(id="LE",comment="LE", long=true, qty=qty1, when=crossover(emaVal, vwapValue)  and (tradeDirection=="LONG") )    //emaVal>vwapValue and crossover(close , emaVal)

strategy.entry(id="LE",comment="LE", long=true, qty=qty1, when=strategy.position_size==0 and crossover(emaVal, emaCumValue1)  and (tradeDirection=="LONG") )    //emaVal>vwapValue and crossover(close , emaVal)

//re-entry
rentryCondition1=strategy.position_size>1 and emaVal > emaCumValue1 and emaCumValue1>emaCumValue2 and crossover(close, emaCumValue2) and close>open and  (tradeDirection=="LONG")
strategy.entry(id="LE",comment="LE RE", long=true, qty=qty1, when=rentryCondition1 )

rentryCondition2=strategy.position_size>1 and emaVal > emaCumValue1 and emaCumValue1>emaCumValueHistory and crossover(close, emaCumValueHistory) and close>open and  (tradeDirection=="LONG")
//strategy.entry(id="LE",comment="LE RE", long=true, qty=qty1, when=rentryCondition2 )    


//stoploss
stopLossVal=  strategy.position_size>=1 ?  (strategy.position_avg_price * (1-(stopLoss*0.01) )) : 0.00

//draw initil stop loss
//plot(strategy.position_size>=1 ? stopLossVal : na, color = color.purple , style=plot.style_linebr,  linewidth = 2, title = "stop loss")

//partial exits
takeProfit=  strategy.position_size>=1 ?  (strategy.position_avg_price * (1+(1*0.01) )) : ( close[1] * 2 )
//if(takePartialProfits==true)
    //strategy.close(id="LE", comment="Partial"+tostring(close-strategy.position_avg_price, "###.##") , qty=strategy.position_size/3 , when = (tradeDirection=="LONG" ) and close>takeProfit and crossunder(close, emaVal) )    //close<close[1] and close[1]<close[2] and close[2]<close[3])

strategy.close(id="LE", comment="PExit Points=>"+tostring(close-strategy.position_avg_price, "###.##") , qty=strategy.position_size/3 , when = (tradeDirection=="LONG" ) and  takePartialProfits == true and close>=takeProfit and crossunder(rsiVal,90) )

profitVal=    strategy.position_size>=1 ?  (strategy.position_avg_price * (1+(1*0.01) )) : ( close[1] * 2 )

//strategy.close(id="LE" , comment="LE Exit Points="+tostring(close-strategy.position_avg_price, "###.##"), when=crossunder(emaVal, vwapValue) and (tradeDirection=="LONG") )

strategy.close(id="LE" , comment="Exit Points=>"+tostring(close-strategy.position_avg_price, "###.##"), when=  crossunder(emaVal, emaCumValue1) and (tradeDirection=="LONG") )


strategy.close(id="LE" , comment="SL Exit Loss="+tostring(close-strategy.position_avg_price, "###.##"), when= close < stopLossVal   and (tradeDirection=="LONG") )


//for short  you dont have to wait crossodown of ema, falling is speed , so just check if close crossing down vwapVal
strategy.entry(id="SE",comment="SE", long=false, qty=qty1, when=crossunder(emaVal, emaCumValue1) and (tradeDirection=="SHORT") )    //emaVal>vwapValue and crossover(close , emaVal)


//stoploss
stopLossValUpside=  abs(strategy.position_size)>=1 and tradeDirection=="SHORT" ?  (strategy.position_avg_price * (1+(stopLoss*0.01) )) : 0.00

//draw initil stop loss
//plot(abs(strategy.position_size)>=1 and tradeDirection=="SHORT" ? stopLossValUpside : na, color = color.purple , style=plot.style_linebr,  linewidth = 2, title = "stop loss")

//partial exits
shortTakeProfit=  abs(strategy.position_size)>=1 and tradeDirection=="SHORT" ?  (strategy.position_avg_price * (1-(stopLoss*0.01) )) : 0.00
if(takePartialProfits==true)
    strategy.close(id="SE", comment="Partial" , qty=strategy.position_size/3 , when = (tradeDirection=="SHORT"   ) and  crossover(rsiVal,15) )  //close<takeProfit and (emaVal - close)>8 )
  
//strategy.close(id="SE" , comment="SE Exit Points="+tostring(close-strategy.position_avg_price, "###.##"), when=crossover(emaVal, vwapValue) and (tradeDirection=="SHORT") )
//strategy.close(id="SE" , comment="SE Exit Points="+tostring(close-strategy.position_avg_price, "###.##"), when= abs(strategy.position_size)>=1 and ( (emaVal<emaCumValue1 and close>emaCumValue1 and open>emaCumValue1 and close>open )   or (crossover(emaVal,emaCumValue1))  ) and (tradeDirection=="SHORT") )

//strategy.close(id="SE" , comment="SL Exit Loss="+tostring(close-strategy.position_avg_price, "###.##"), when= abs(strategy.position_size)>=1 and  close > stopLossValUpside   and (tradeDirection=="SHORT"   ) )
strategy.close(id="SE" , comment="SL Exit Loss="+tostring(close-strategy.position_avg_price, "###.##"), when= abs(strategy.position_size)>=1 and  crossover(emaVal, emaCumValue1)   and (tradeDirection=="SHORT"   ) )