
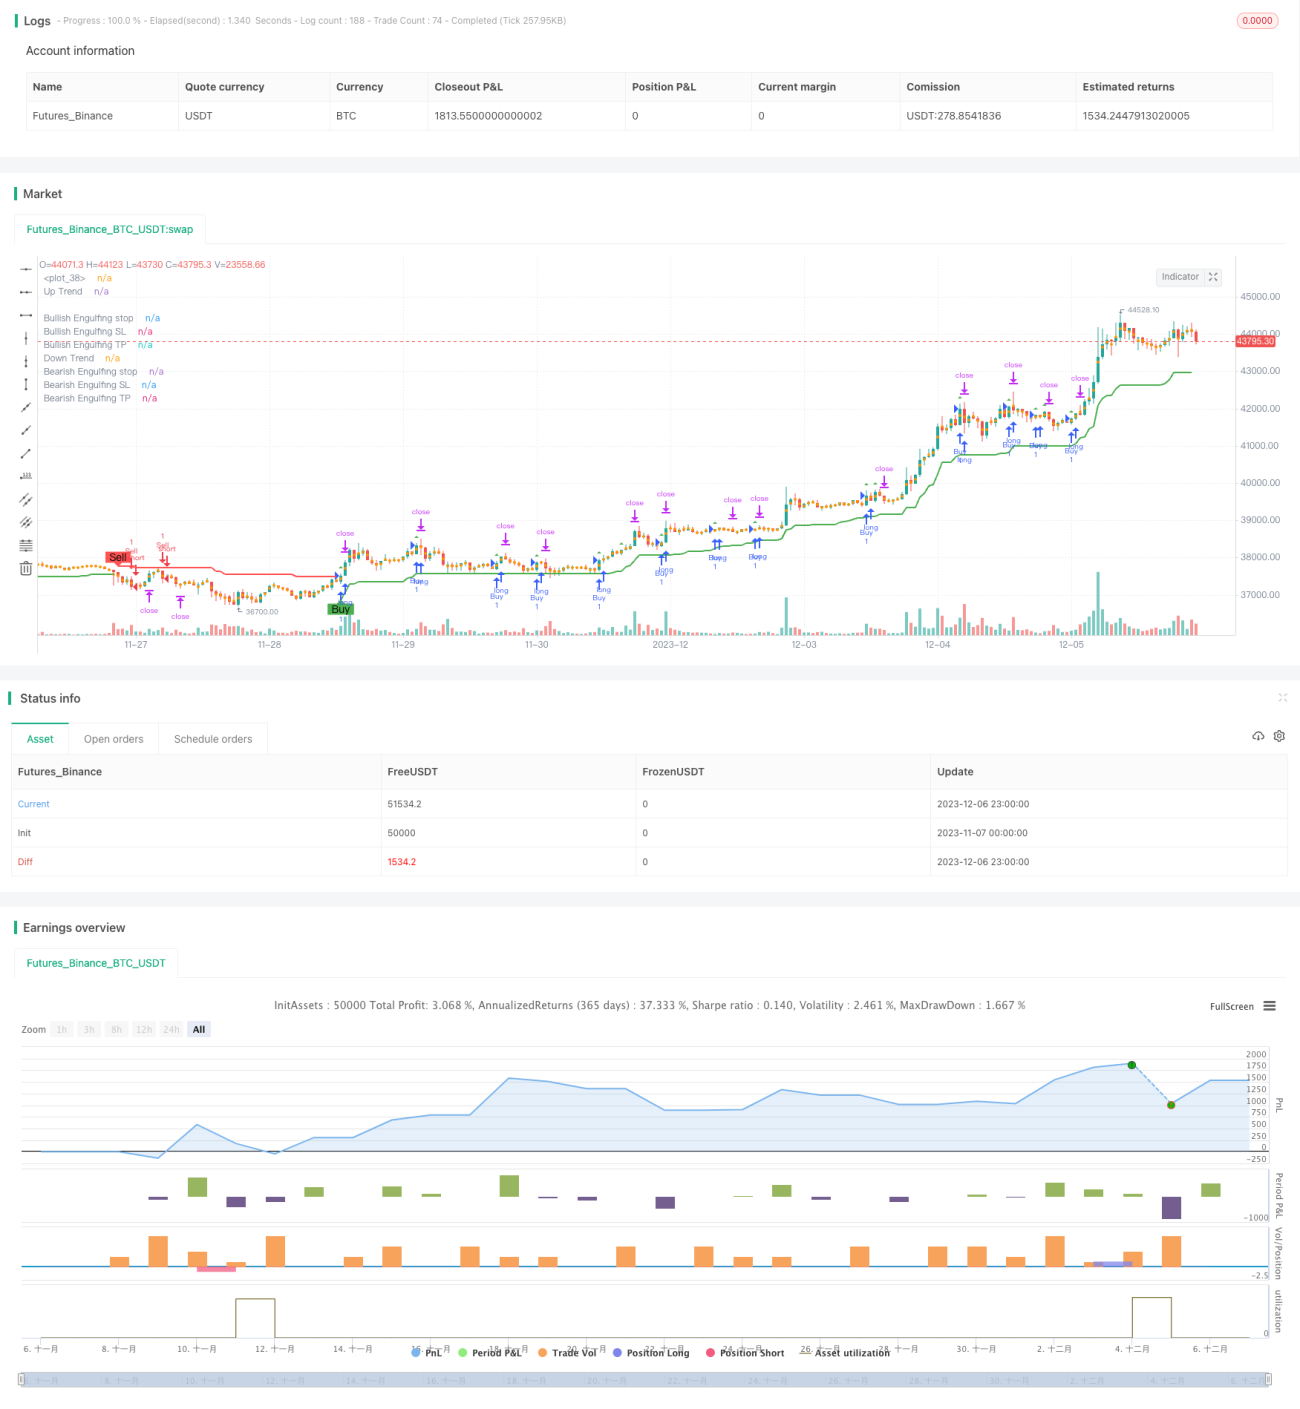
একটি সুপারট্রেন্ডেড গ্রাস বোলিং কৌশল হল একটি ট্রেন্ড ট্র্যাকিং কৌশল যা গড় বাস্তব তরঙ্গদৈর্ঘ্য (এটিআর), সুপারট্রেন্ডেড সূচক এবং গ্রাস মোডগুলিকে ট্রেন্ডের দিকনির্দেশনা সনাক্ত করতে এবং ট্রেন্ডটি নিশ্চিত করার সময় সুপারট্রেন্ডেড মোডগুলিকে স্বীকৃতি দেওয়ার জন্য অনুকূল অনুপাতের প্রবেশের সুযোগগুলি সন্ধান করে।
এই কৌশলটি প্রথমে এটিআর এবং সুপারট্রেন্ডিং সূচক ব্যবহার করে বর্তমান বাজার প্রবণতার দিকটি নির্ধারণ করে। বিশেষত, যখন দামগুলি উপরের ট্র্যাকের নীচে থাকে তখন এটি একটি নিম্নমুখী প্রবণতা হিসাবে সংজ্ঞায়িত করা হয় এবং যখন দামগুলি নীচের ট্র্যাকের উপরে থাকে তখন এটি একটি উত্থান হিসাবে সংজ্ঞায়িত করা হয়।
ট্রেন্ডের দিকনির্দেশ নিশ্চিত করার সময়, কৌশলটি সিদ্ধান্ত নেবে যে কে লাইনটি গ্রাসের আকার তৈরি করেছে কিনা। কোড লজিক অনুসারে, একটি উত্থানের প্রবণতায়, পূর্ববর্তী কে লাইনের সমাপ্তির দাম বর্তমান কে লাইনের খোলার দামের চেয়ে বেশি এবং বর্তমান কে লাইনের সমাপ্তির দাম খোলার দামের চেয়ে কম হলে একাধিক শিরোনাম গ্রাস করা হবে; একটি পতনের প্রবণতায়, পূর্ববর্তী কে লাইনের সমাপ্তির দাম বর্তমান কে লাইনের খোলার দামের চেয়ে কম এবং বর্তমান কে লাইনের সমাপ্তির দাম খোলার দামের চেয়ে বেশি হলে শিরোনাম গ্রাস করা হবে।
ট্রেডিং সিগন্যাল তৈরি হয় যখন গ্রাসের আকৃতিটি প্রবণতার দিকের সাথে সামঞ্জস্যপূর্ণ হয়। উপরন্তু, কৌশলটি গ্রাসের আকৃতির উপর ভিত্তি করে স্টপ প্রাইস এবং স্টপ প্রাইস গণনা করে। প্রবেশের পরে, যদি দামটি স্টপ প্রাইস বা স্টপ প্রাইস স্পর্শ করে তবে বর্তমান অবস্থান থেকে বেরিয়ে আসে।
এই কৌশলটি প্রবণতা ট্র্যাকিং এবং প্যাটার্ন সনাক্তকরণের সুবিধাগুলি একত্রিত করে, যা প্রবণতা পরিস্থিতিতে বিপরীত সংকেত সনাক্ত করতে পারে, যাতে বাজারের বিপরীত অবস্থার সময়ে বড় পরিস্থিতি ধরা যায়। এছাড়াও, স্টপ লস মেকানিজম ক্ষতির ঝুঁকি কার্যকরভাবে নিয়ন্ত্রণ করতে পারে।
এই কৌশলটির সবচেয়ে বড় ঝুঁকি হ’ল গ্রাসকারী আকৃতিটি মিথ্যা ভাঙ্গন হতে পারে, যার ফলে ভুল সংকেত তৈরি হয়। উপরন্তু, স্টপ এবং স্টপ সেটিংগুলিও খুব অবাধ্য হতে পারে, লাভ-ক্ষতি ভারসাম্য অর্জন করতে পারে না। প্যারামিটার সমন্বয়টি অনুকূলিতকরণের পরামর্শ দেওয়া হয় এবং স্টপ স্টপ অবস্থানটি যথাযথভাবে সামঞ্জস্য করা হয়।
এটিআর এর প্যারামিটারগুলিকে রিয়েল-টাইমে অপ্টিমাইজ করার কথা বিবেচনা করা যেতে পারে যাতে বাজারের অস্থিরতার পরিবর্তনগুলি আরও ভালভাবে ধরা যায়। এছাড়াও, অন্যান্য সূচকগুলি ট্রেন্ড সনাক্তকরণের জন্য গবেষণা করা যেতে পারে, কৌশলটির স্থিতিশীলতা আরও বাড়িয়ে তুলতে পারে। স্টপ লস স্টপ থেকে, গতিশীল ট্র্যাকিংও একটি কার্যকর অপ্টিমাইজেশন ধারণা।
সুপার ট্রেন্ড গ্রাস বোল্ট কৌশলটি ট্রেন্ড ট্র্যাকিং এবং প্যাটার্ন সনাক্তকরণের সুবিধাগুলিকে সংহত করে, বিপণনের বিপরীত সিগন্যাল হিসাবে প্যাটার্ন গ্রাস করার কৌশলটি উচ্চ কার্যকারিতা অর্জন করতে পারে। তবে এই কৌশলটি একটি নির্দিষ্ট মিথ্যা সংকেত ঝুঁকিও রয়েছে যা ঝুঁকি নিয়ন্ত্রণের জন্য আরও পরীক্ষা এবং অপ্টিমাইজেশনের প্রয়োজন।
/*backtest
start: 2023-11-07 00:00:00
end: 2023-12-07 00:00:00
period: 1h
basePeriod: 15m
exchanges: [{"eid":"Futures_Binance","currency":"BTC_USDT"}]
*/
// This source code is subject to the terms of the Mozilla Public License 2.0 at https://mozilla.org/MPL/2.0/
// © Armanhammer
//@version=5
strategy("Engulfing with Trend", overlay=true)
Periods = input.int(title="ATR Period", defval=10)
src = input(hl2, title="Source")
Multiplier = input.float(title="ATR Multiplier", step=0.1, defval=3.0)
changeATR= input.bool(title="Change ATR Calculation Method ?", defval=true)
showsignals = input.bool(title="Show Buy/Sell Signals ?", defval=true)
highlighting = input.bool(title="Highlighter On/Off ?", defval=true)
atr2 = ta.sma(src, Periods)
atr= changeATR ? ta.atr(Periods) : atr2
up=src-(Multiplier*atr)
up1 = nz(up[1],up)
up := close[1] > up1 ? math.max(up,up1) : up
dn=src+(Multiplier*atr)
dn1 = nz(dn[1], dn)
dn := close[1] < dn1 ? math.min(dn, dn1) : dn
var trend = 1
trend := nz(trend[1], trend)
trend := trend == -1 and close > dn1 ? 1 : trend == 1 and close < up1 ? -1 : trend
upPlot = plot(trend == 1 ? up : na, title="Up Trend", style=plot.style_linebr, linewidth=2, color=color.green)
buySignal = trend == 1 and trend[1] == -1
plotshape(buySignal and showsignals ? up : na, title="Buy", style=shape.labelup, location=location.absolute, color=color.new(color.green, 0), text="Buy")
//plotshape(buySignal ? up : na, title="UpTrend Begins", location=location.absolute, style=shape.circle, size=size.tiny, color=color.green, transp=0)
//plotshape(buySignal and showsignals ? up : na, title="Buy", text="Buy", location=location.absolute, style=shape.labelup, size=size.tiny, color=color.green, textcolor=color.white, transp=0)
dnPlot = plot(trend == 1 ? na : dn, title="Down Trend", style=plot.style_linebr, linewidth=2, color=color.red)
sellSignal = trend == -1 and trend[1] == 1
plotshape(sellSignal and showsignals ? dn : na, title="Sell", style=shape.labeldown, location=location.absolute, color=color.new(color.red, 0), text="Sell")
//plotshape(sellSignal ? dn : na, title="DownTrend Begins", location=location.absolute, style=shape.circle, size=size.tiny, color=color.red, transp=0)
//plotshape(sellSignal and showsignals ? dn : na, title="Sell", text="Sell", location=location.absolute, style=shape.labeldown, size=size.tiny, color=color.red, textcolor=color.white, transp=0)
mPlot = plot(ohlc4, title="", style=plot.style_circles, linewidth=0)
longFillColor = highlighting and trend == 1 ? color.new(color.green, 0) : na
shortFillColor = highlighting and trend == -1 ? color.new(color.red, 0) : na
fill(upPlot, dnPlot, color=longFillColor)
fill(dnPlot, upPlot, color=shortFillColor)
alertcondition(buySignal, title="SuperTrend Buy", message="SuperTrend Buy!")
alertcondition(sellSignal, title="SuperTrend Sell", message="SuperTrend Sell!")
changeCond = trend != trend[1]
alertcondition(changeCond, title="SuperTrend Direction Change", message="SuperTrend has changed direction!")
// Define Downtrend and Uptrend conditions
downtrend = trend == -1
uptrend = trend == 1
// Engulfing
boringThreshold = input.float(25, title="Boring Candle Threshold (%)", minval=1, maxval=100)
engulfingThreshold = input.float(50, title="Engulfing Candle Threshold (%)", minval=1, maxval=100)
stopLevel = input.int(200, title="Stop Level (Pips)", minval=1)
// Boring Candle (Inside Bar) and Engulfing Candlestick Conditions
isBoringCandle = math.abs(open[1] - close[1]) * 100 / math.abs(high[1] - low[1]) <= boringThreshold
isEngulfingCandle = math.abs(open - close) * 100 / math.abs(high - low) <= engulfingThreshold
// Bullish and Bearish Engulfing Conditions
bullEngulfing = uptrend and close[1] < open[1] and close > open[1] and not isBoringCandle and not isEngulfingCandle
bearEngulfing = downtrend and close[1] > open[1] and close < open[1] and not isBoringCandle and not isEngulfingCandle
// Stop Loss, Take Profit, and Entry Price Calculation
bullStop = close + (stopLevel * syminfo.mintick)
bearStop = close - (stopLevel * syminfo.mintick)
bullSL = low
bearSL = high
bullTP = bullStop + (bullStop - low)
bearTP = bearStop - (high - bearStop)
// Entry Conditions
enterLong = bullEngulfing and uptrend
enterShort = bearEngulfing and downtrend
// Exit Conditions
exitLong = ta.crossover(close, bullTP) or ta.crossover(close, bullSL)
exitShort = ta.crossover(close, bearTP) or ta.crossover(close, bearSL)
// Check if exit conditions are met by the next candle
exitLongNextCandle = exitLong and (ta.crossover(close[1], bullTP[1]) or ta.crossover(close[1], bullSL[1]))
exitShortNextCandle = exitShort and (ta.crossover(close[1], bearTP[1]) or ta.crossover(close[1], bearSL[1]))
// Strategy Execution
if enterLong
strategy.entry("Buy", strategy.long)
if enterShort
strategy.entry("Sell", strategy.short)
// Exit Conditions for Long (Buy) Positions
if bullEngulfing and not na(bullTP) and not na(bullSL)
strategy.exit("Exit Long", from_entry="Buy", stop=bullSL, limit=bullTP)
// Exit Conditions for Short (Sell) Positions
if bearEngulfing and not na(bearTP) and not na(bearSL)
strategy.exit("Exit Short", from_entry="Sell", stop=bearSL, limit=bearTP)
// Plot Shapes and Labels
plotshape(series=bullEngulfing, style=shape.triangleup, location=location.abovebar, color=color.green)
plotshape(series=bearEngulfing, style=shape.triangledown, location=location.abovebar, color=color.red)
// Determine OP, SL, and TP
plot(series=bullEngulfing ? bullStop : na, title="Bullish Engulfing stop", color=color.red, linewidth=3, style=plot.style_linebr)
plot(series=bearEngulfing ? bearStop : na, title="Bearish Engulfing stop", color=color.red, linewidth=3, style=plot.style_linebr)
plot(series=bullEngulfing ? bullSL : na, title="Bullish Engulfing SL", color=color.red, linewidth=3, style=plot.style_linebr)
plot(series=bearEngulfing ? bearSL : na, title="Bearish Engulfing SL", color=color.red, linewidth=3, style=plot.style_linebr)
plot(series=bullEngulfing ? bullTP : na, title="Bullish Engulfing TP", color=color.green, linewidth=3, style=plot.style_linebr)
plot(series=bearEngulfing ? bearTP : na, title="Bearish Engulfing TP", color=color.green, linewidth=3, style=plot.style_linebr)
// Create labels if the condition for bullEngulfing or bearEngulfing is met
//if bullEngulfing
// label.new(x=bar_index, y=bullSL, text="SL: " + str.tostring(bullSL), color=color.red, textcolor=color.white, style=label.style_labelup, size=size.tiny)
//if bearEngulfing
// label.new(x=bar_index, y=bearSL, text="SL: " + str.tostring(bearSL), color=color.red, textcolor=color.white, style=label.style_labeldown, size=size.tiny)
//if bullEngulfing
// label.new(x=bar_index, y=bullTP, text="TP: " + str.tostring(bullTP), color=color.green, textcolor=color.white, style=label.style_labeldown, size=size.tiny)
//if bearEngulfing
// label.new(x=bar_index, y=bearTP, text="TP: " + str.tostring(bearTP), color=color.green, textcolor=color.white, style=label.style_labelup, size=size.tiny)