
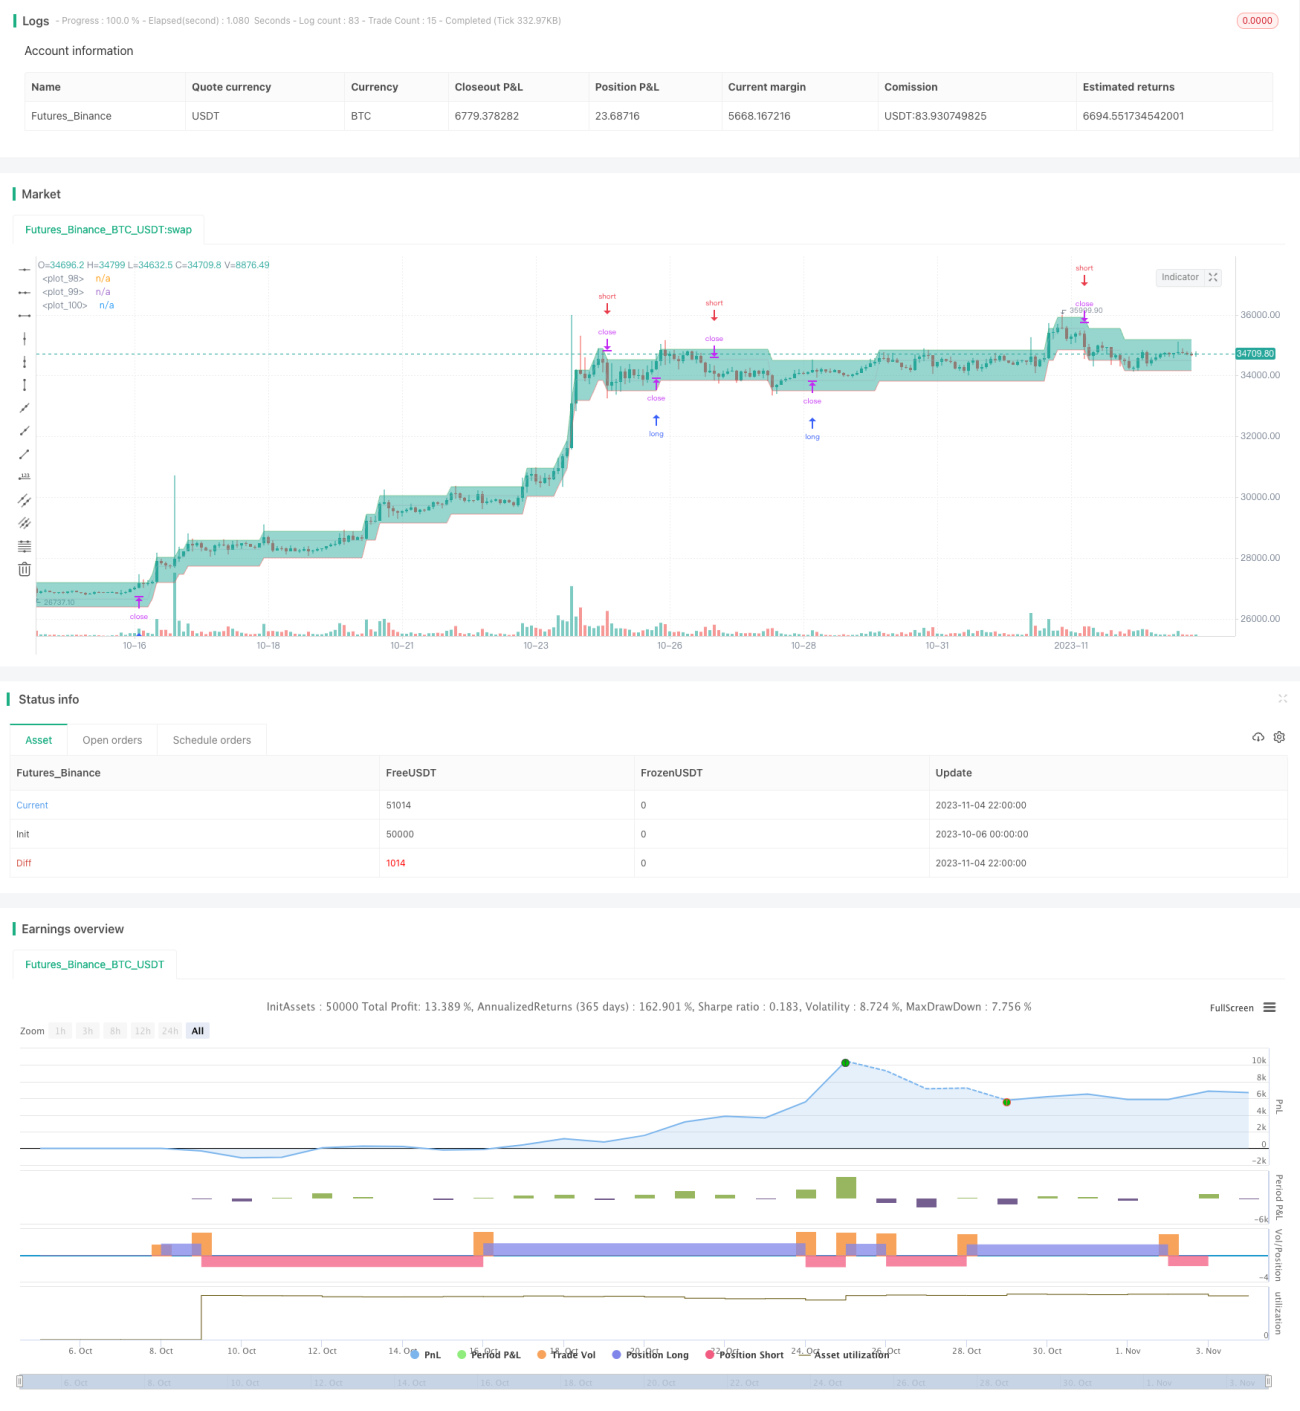
Die Trendblock-Strategie ist eine Handelsstrategie, die sich auf die prozentuale Veränderung des Preises oder auf die Anzahl der Sprungpunkte bezieht. Sie zeigt die lokalen Trends und Wendepunkte deutlich auf der Grafik. Es ist ein sehr nützliches Werkzeug, um die Preisrichtung zu verfolgen.
Die Berechnung der Strategie basiert auf der prozentualen Preisänderung oder der Punktabweichung (in den Parametern des Antennendefizits) und wird in Form von diagonalen Linien auf der Grafik dargestellt.
Jede Zeile besteht aus einer mittleren, einer oberen und einer unteren Grenze der Benchmark:
Die mittlere Referenzlinie ist gleich der oberen oder unteren Grenze der vorherigen oder der folgenden Zeile (wenn sich der Preis innerhalb eines Zeitraums schnell ändert, ist die mittlere Referenzlinie der aktuellen Zeile größer als die obere Grenze der vorherigen Zeile oder kleiner als die untere Grenze der nächsten Zeile, je nachdem, in welche Richtung sich der Preis bewegt). Die mittlere Referenzlinie ist gleich der Anfangswerte der ersten Zeile zum Beginn der Berechnung.
Die Parameter für die Anzahl der Antennen bestimmen die Abweichung von der oberen oder unteren Grenze der Kursänderung, die Parameter für die Umkehrung der Antennen bestimmen die Abweichung, die die Kursänderung verändert.
Regeln für die Erstellung neuer Zeilen:
Wenn der Schlusskurs über der Obergrenze liegt und der Schlusskurs über dem Eröffnungskurs liegt, wird die Obergrenze nach oben bewegt, die Untergrenze wird ebenfalls nach oben bewegt, jedoch mit geringerer Breite.
Wenn der Mindestpreis ≤ die Untergrenze ist und der Schlusskurs < den Eröffnungskurs ist, verschiebt sich die Untergrenze allmählich nach unten, die Obergrenze auch, aber weniger stark.
Durch die Anpassung der Abweichungen können lokale Trends und Wendepunkte deutlich auf den Diagrammen sichtbar gemacht werden.
Die visuelle Anzeige der Preisentwicklung und die klare Identifizierung von Resistenzen und Unterstützungen.
Die diagonale Linie zeigt deutlich die Stärke des Durchbruchs und den Umfang der Rückschaltung.
Trends mit unterschiedlicher Intensität können erkannt werden, je nachdem, ob die Schräglage der Winkellinie angepasst werden muss.
Es gibt eine Reihe von Möglichkeiten, wie man eine größere Resistenz finden kann und sie durchbrechen kann.
Das ist eine sehr einfache Methode, um den Preis zu erkennen und seine Position zu korrigieren.
Die Kurve ist nicht vollständig in der Lage, die nachfolgenden Kursbewegungen zu prognostizieren.
Es ist notwendig, auf Abweichungen im Trend zu achten, da die Kurve von den tatsächlichen Preisen abweichen kann.
Es ist nicht möglich, die Trends als eine Strategie im Alleingang zu beurteilen, sondern in Kombination mit anderen Indikatoren.
Es ist darauf zu achten, dass eine falsche Anpassung der Parameter zu häufigen Transaktionen führen kann.
Die Möglichkeit, dass ein Alarm bei einem Rückruf erforderlich ist, kann nicht mechanisch blind verfolgt werden.
Die Größe der Positionen kann entsprechend verkleinert werden, wobei andere Indikatoren als Hilfsmittel herangezogen werden können, um unter großen Trends zu handeln.
Positionsmanagement-Module können hinzugefügt werden, um die Positionen in verschiedenen Phasen des Trends dynamisch anzupassen.
In Kombination mit einem Volatilitätsindikator kann die Position bei steigender Volatilität zurückgenommen werden.
Ein Stop-Loss kann auf Basis des Rücknahmeverhältnisses eingestellt werden, um einzelne Verluste zu kontrollieren.
Es kann ein Filter hinzugefügt werden, um den Handel bei Abweichungen des Preises zu pausieren.
Trends mit unterschiedlicher Intensität können in mehreren Ebenen unterteilt werden.
Durch die dynamische Anpassung der Positionen und die Einstellung von Stop-Loss- und Filterbedingungen kann der Preistrend stabiler verfolgt werden.
Die Trendblock-Strategie nutzt die diagonale Linie, um die Preisentwicklung sichtbar zu machen. Sie identifiziert klar die Unterstützungswiderstände und die Durchbrüche. Sie kann sich jedoch nicht auf die diagonale Linie verlassen und muss mit anderen Indikatoren für eine umfassende Analyse unterstützt werden, während die Risiken kontrolliert werden.
/*backtest
start: 2023-10-06 00:00:00
end: 2023-11-05 00:00:00
period: 2h
basePeriod: 15m
exchanges: [{"eid":"Futures_Binance","currency":"BTC_USDT"}]
*/
//@version=5
// **********************************************************************************
// This code is invented and written by @StCogitans.
// The idea presented in this code and the rights to this code belong to @StCogitans.
// © https://www.tradingview.com/u/StCogitans
//
// Description.
// Sizeblock - a price change strategy in the form of diagonal rows.
// **********************************************************************************
// STRATEGY
string NAME = 'Sizeblock'
string ACRONYM = 'SB'
bool OVERLAY = true
int PYRAMIDING = 0
string QTY_TYPE = strategy.percent_of_equity
float QTY_VALUE = 100
float CAPITAL = 100
string COM_TYPE = strategy.commission.percent
float COM_VALUE = 0.1
bool ON_CLOSE = false
bool BAR_MAGNIFIER = false
bool OHLC = true
strategy(NAME, ACRONYM, OVERLAY, pyramiding=PYRAMIDING, default_qty_type=QTY_TYPE, default_qty_value=QTY_VALUE, initial_capital=CAPITAL, commission_type=COM_TYPE, commission_value=COM_VALUE, process_orders_on_close=ON_CLOSE, use_bar_magnifier=BAR_MAGNIFIER, fill_orders_on_standard_ohlc=OHLC)
// ARGUMENTS
// Datetime
DTstart = input(timestamp("01 Jan 2000 00:00 +0000"), 'Start time', group='Datetime')
DTfinish = input(timestamp("01 Jan 2080 23:59 +0000"), 'Finish time', group='Datetime')
DTperiod = true
// Main
dev_source = input.string('Close', title='Source', options=["Close", "HighLow"], tooltip='Price data for settlement.', group='Main')
dev_type = input.string('Percentage', title='Deviation', options=['Percentage', 'Ticks'], tooltip='The type of deviation to calculate.', group='Main')
dev_value = input.float(1, title='Quantity', minval=0.001, step=0.01, tooltip='Quantity to be calculated.', group='Main')
dev_back = input.float(2, title='U-turn', minval=0.001, step=0.01, tooltip='Quantity for reversal.', group='Main')
mode = input.string('Limit', title='Positions', options=['Limit', 'Market'], tooltip='Limit or market orders.', group='Main')
direct = input.string('All', title='Direction', options=['All', 'Buy', 'Sell'], tooltip='The type of positions to be opened.', group='Main')
swapping = input.bool(false, title='Swapping', tooltip='Swap points to open a new position.', group='Main')
// CALCULATION SYSTEM
Assembling(s, t, v, vb) =>
float a = open
float b = close
float c = s == "HighLow" ? math.round_to_mintick(high) : math.round_to_mintick(b)
float d = s == "HighLow" ? math.round_to_mintick(low) : math.round_to_mintick(b)
float x = math.round_to_mintick(a)
x := nz(x[1], x)
float _v = t == "Ticks" ? syminfo.mintick * v : v
float _vb = t == "Ticks" ? syminfo.mintick * vb : vb
float h = t == "Ticks" ? math.round_to_mintick(x + _v) : math.round_to_mintick(x * (1 + _v / 100))
float l = t == "Ticks" ? math.round_to_mintick(x - _v) : math.round_to_mintick(x * (1 - _v / 100))
h := nz(h[1], h)
l := nz(l[1], l)
if t == "Ticks"
if c >= h and b > a
while c >= h
x := h
h := math.round_to_mintick(h + _v)
l := math.round_to_mintick(x - _vb)
if d <= l and b < a
while d <= l
x := l
l := math.round_to_mintick(l - _v)
h := math.round_to_mintick(x + _vb)
else if t == "Percentage"
if c >= h and b > a
while c >= h
x := h
h := math.round_to_mintick(h * (1 + _v / 100))
l := math.round_to_mintick(x * (1 - _vb / 100))
if d <= l and b < a
while d <= l
x := l
l := math.round_to_mintick(l * (1 - _v / 100))
h := math.round_to_mintick(x * (1 + _vb / 100))
[x, h, l]
[lx, lh, ll] = Assembling(dev_source, dev_type, dev_value, dev_back)
// PLOT
// Lines
plot_up = plot(lh, color=color.new(color.green, 50), style=plot.style_line, linewidth=1)
plot_main = plot(lx, color=color.new(color.silver, 50), style=plot.style_line, linewidth=1)
plot_down = plot(ll, color=color.new(color.red, 50), style=plot.style_line, linewidth=1)
// Areas
fill(plot_up, plot_main, lh, lx, color.new(color.teal, 80), color.new(color.teal, 80))
fill(plot_main, plot_down, lx, ll, color.new(color.maroon, 80), color.new(color.maroon, 80))
// TRADING
// Alert variables
int Action = -1
int PosType = -1
int OrderType = -1
float Price = -1.0
// Direction variables
bool ifBuy = direct == "All" or direct == "Buy" ? true : false
bool ifSell = direct == "All" or direct == "Sell" ? true : false
// Market entries
if (strategy.closedtrades + strategy.opentrades == 0 or mode == "Market") and DTperiod
if ((swapping and lx < nz(lx[1], lx)) or (not swapping and lx > nz(lx[1], lx))) and ifBuy
Action := 1
PosType := 1
OrderType := 1
Price := math.round_to_mintick(close)
strategy.entry('Long', strategy.long)
if ((swapping and lx > nz(lx[1], lx)) or (not swapping and lx < nz(lx[1], lx))) and ifSell
Action := 2
PosType := 2
OrderType := 1
Price := math.round_to_mintick(close)
strategy.entry('Short', strategy.short)
// Closing positions by market
if DTperiod and mode == "Market"
if direct == "Buy" and strategy.position_size > 0
if swapping and lx > nz(lx[1], lx)
Action := 2
PosType := 3
OrderType := 1
Price := math.round_to_mintick(close)
strategy.close('Long', comment='Close')
if not swapping and lx < nz(lx[1], lx)
Action := 2
PosType := 3
OrderType := 1
Price := math.round_to_mintick(close)
strategy.close('Long', comment='Close')
if direct == "Sell" and strategy.position_size < 0
if swapping and lx < nz(lx[1], lx)
Action := 1
PosType := 3
OrderType := 1
Price := math.round_to_mintick(close)
strategy.close('Short', comment='Close')
if not swapping and lx > nz(lx[1], lx)
Action := 1
PosType := 3
OrderType := 1
Price := math.round_to_mintick(close)
strategy.close('Short', comment='Close')
// Limit entries and exits
if swapping and DTperiod and mode == "Limit"
if strategy.position_size < 0
Action := 1
PosType := 1
OrderType := 2
Price := ll
if ifBuy
strategy.entry('Long', strategy.long, limit=ll)
else
PosType := 3
strategy.exit('Exit', limit=ll)
if strategy.position_size > 0
Action := 2
PosType := 2
OrderType := 2
Price := lh
if ifSell
strategy.entry('Short', strategy.short, limit=lh)
else
PosType := 3
strategy.exit('Exit', limit=lh)
if strategy.closedtrades + strategy.opentrades > 0 and strategy.position_size == 0
if ifBuy
Action := 1
PosType := 1
OrderType := 2
Price := ll
strategy.entry('Long', strategy.long, limit=ll)
if ifSell
Action := 2
PosType := 2
OrderType := 2
Price := lh
strategy.entry('Short', strategy.short, limit=lh)
if not swapping and DTperiod and mode == "Limit"
if strategy.position_size < 0
Action := 1
PosType := 1
OrderType := 2
Price := lh
if ifBuy
strategy.entry('Long', strategy.long, stop=lh)
else
PosType := 3
strategy.exit('Exit', stop=lh)
if strategy.position_size > 0
Action := 2
PosType := 2
OrderType := 2
Price := ll
if ifSell
strategy.entry('Short', strategy.short, stop=ll)
else
PosType := 3
strategy.exit('Exit', stop=ll)
if strategy.closedtrades + strategy.opentrades > 0 and strategy.position_size == 0
if ifBuy
Action := 1
PosType := 1
OrderType := 2
Price := lh
strategy.entry('Long', strategy.long, stop=lh)
if ifSell
Action := 2
PosType := 2
OrderType := 2
Price := ll
strategy.entry('Short', strategy.short, stop=ll)
// Everything is closed and canceled
if not DTperiod
strategy.cancel_all()
strategy.close_all(comment='Close')
// Alerts
// Convert to string variables
string Action_Txt = Action == 1 ? "Buy" : Action == 2 ? "Sell" : na
string PosType_Txt = PosType == 1 ? "Long" : PosType == 2 ? "Short" : PosType == 3 ? "Flat" : na
string OrderType_Txt = OrderType == 1 ? "Market" : OrderType == 2 ? "Limit" : na
string Price_Txt = Price > 0 ? str.tostring(Price) : na
// Output
if not (Action == nz(Action[1], Action) and Price == nz(Price[1], Price) and OrderType == nz(OrderType[1], OrderType)) and DTperiod
alert('{"pair": "' + syminfo.ticker + '", "direction": "' + Action_Txt + '", "entertype": "' + OrderType_Txt + '", "position": "' + PosType_Txt + '", "price": "' + Price_Txt + '"}')
// *********************
// Good job, Soldier! ;>
// *********************