Momentum-Trendfolgestrategie


Erstellungsdatum: 2023-11-07 16:49:49 zuletzt geändert: 2023-11-07 16:49:49
Kopie: 0 Klicks: 650
1
konzentrieren Sie sich auf
1617
Anhänger

Momentum-Trendfolgestrategie

Überblick

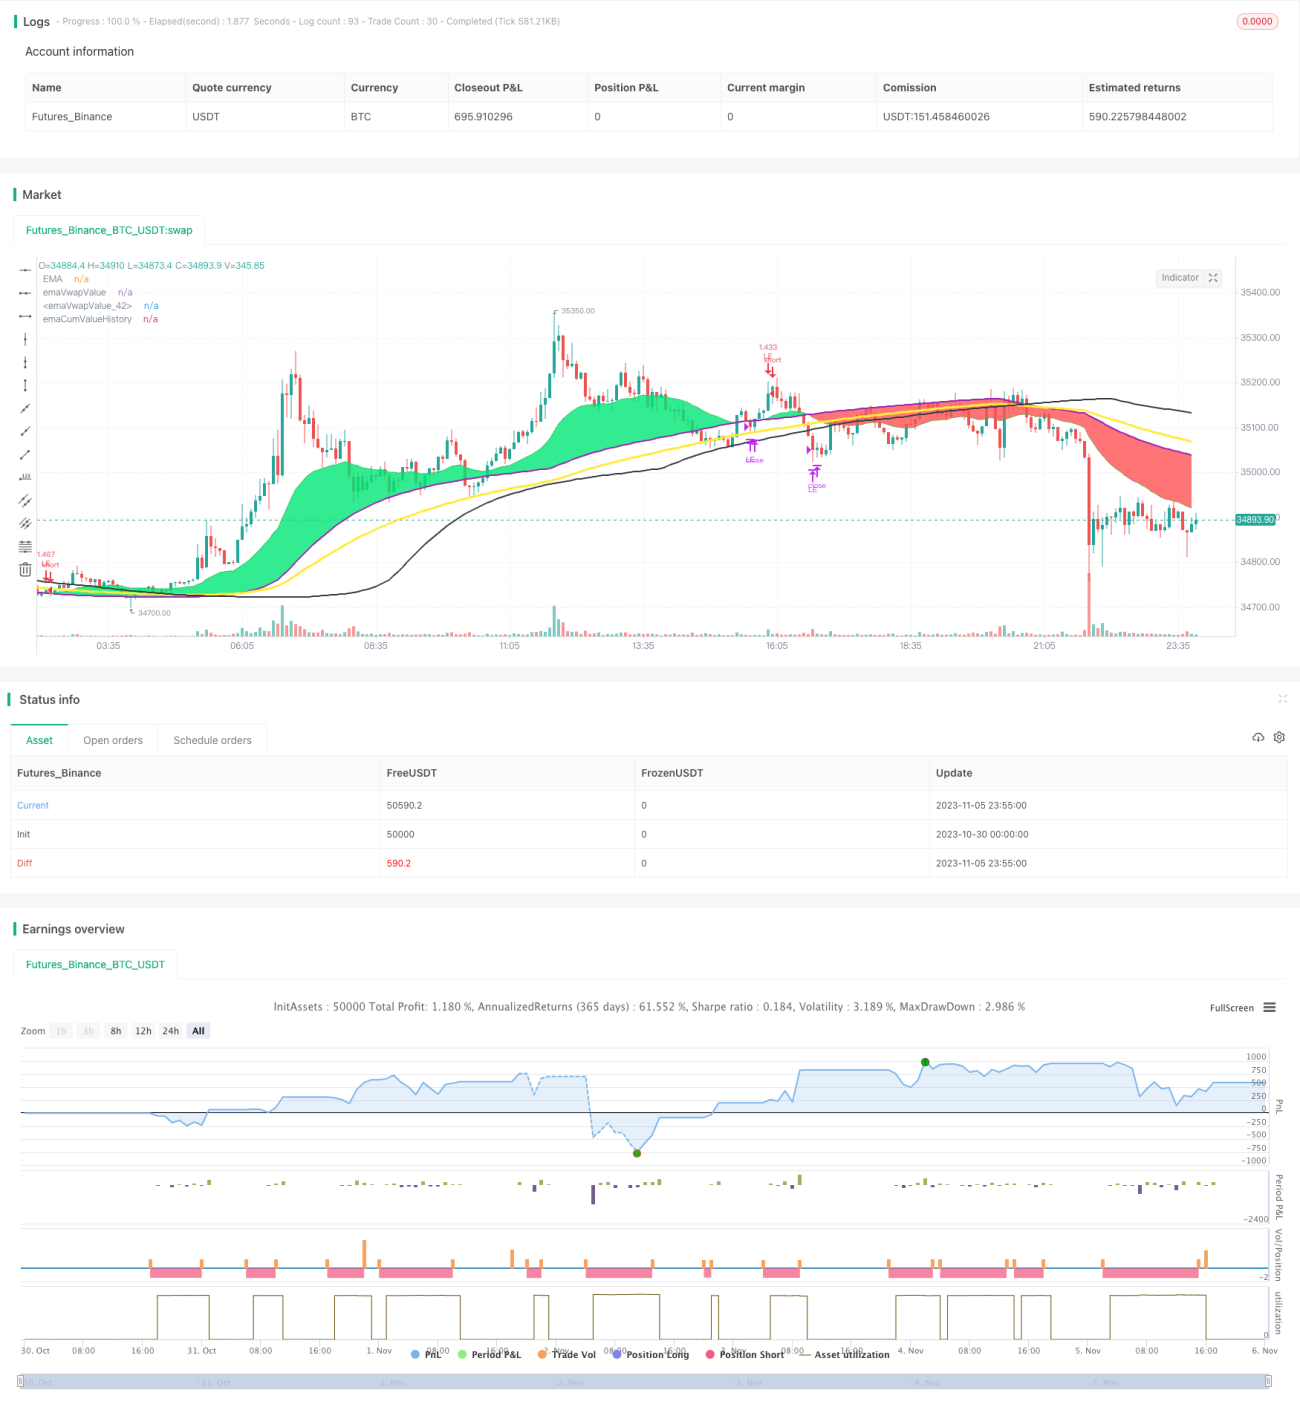
Die Strategie basiert auf der Trendanalyse von Moving Averages und Transaktionsmengen, setzt dynamische Kennzahlen und führt Kauf- und Verkaufsaktionen auf eine Trend-basierte Weise durch.

Strategieprinzip

  1. Berechnen Sie die EMA-Mittellinie für den Schlusspreis und die kumulierte EMA-Mittellinie für den Umsatz
  2. Wenn die EMA bei der Nähe als Aufwärtstrend beurteilt wird, wird eine Mehrkopfoperation durchgeführt.
  3. Wenn der Kurs weiter steigt und die 2-fache Mittellinie der kumulierten EMA überschritten wird, wird ein zusätzlicher Betrag aufgenommen.
  4. Setzen Sie den RSI-Indikator, und wenn der RSI über 90 ist, platzieren Sie 13 der Positionen und gewinnen Sie
  5. Wenn der Close die EMA durchbricht, wird er als Abwärtstrend beurteilt und alle Überschüsse abgewickelt.
  6. Wenn der Close die EMA durchbricht, wird er als Abwärtstrend beurteilt und ein Shorting vorgenommen.
  7. Setzen Sie eine Stop-Loss-Linie, die einen festen Prozentsatz des Eintrittspreises darstellt
  8. Die Profit-Methode ist die gleiche wie bei den Mehrköpfen.

Analyse der Stärken

Die wichtigsten Vorteile dieser Strategie sind:

  1. Die EMA-Durchschnittskurve kann Trends erkennen und effektiv verfolgen.
  2. Der Akkumulativ-EMA wird als Grundlage für die tatsächliche Trendentwicklung verwendet.
  3. Der RSI-Dynamik-Indikator ist ein Gewinn.
  4. Risikokontrolle und Stop Loss
  5. Anpassung an verschiedene Situationen, flexible Anpassung von Parametern

Risikoanalyse

Die wichtigsten Risiken dieser Strategie sind:

  1. Die EMA-Grenze verläuft hinterher und könnte einen Wendepunkt verpassen.
  2. Der Umsatz spiegelt nicht immer die tatsächlichen Trends wider.
  3. Fixed-Percentage-Stop-Loss könnte zu mechanisch sein
  4. Das ist eine sehr schwierige Aufgabe, weil es zu viele Parameter gibt.
  5. Häufige Transaktionen mit hohen Transaktionskosten

Die Risiken sind so unterschiedlich, dass sie sich nicht unterscheiden.

  1. Optimierung der EMA-Parameter zur Verringerung der Rückstände
  2. In Kombination mit anderen Indikatoren bestätigt die Transaktionsmenge
  3. Optimierung der Stop-Loss-Punkte nach Marktsituationen
  4. Vereinfachte Parameter, nur die primären Einstellungen erhalten
  5. Angemessene Lockerung der Stop-Loss-Linien und der Handelsfrequenz

Optimierungsrichtung

Diese Strategie kann in folgenden Bereichen optimiert werden:

  1. Verschiedene EMA-Parameter-Einstellungen testen, um die optimale Kombination zu finden
  2. Erhöhung der VOLUME-Multiplikator als Eintrittssignal-Schwäche
  3. Zulassung in Kombination mit MACD, KD und anderen Indikatoren
  4. Optimierte Stop-Loss-Prozentsätze für bestimmte Aktienmerkmale
  5. Optimierung der Frequenz und Senkung der Transaktionskosten

Zusammenfassen

Die Strategie ist insgesamt eine auf einem Gleichliniensystem basierende Trendverfolgungsstrategie. Die Kernidee besteht darin, die Richtung der Trends mit Hilfe der EMA zu bestimmen und die Eintrittsbestätigung mit Hilfe des VOLUME-Dynamikindikators zu gewährleisten. Sie kann durch Parameteroptimierung kontinuierlich optimiert werden und unterstützt andere Indikatoren bei der weiteren Bestätigung.

Strategiequellcode
/*backtest
start: 2023-10-30 00:00:00
end: 2023-11-06 00:00:00
period: 5m
basePeriod: 1m
exchanges: [{"eid":"Futures_Binance","currency":"BTC_USDT"}]
*/

// This source code is subject to the terms of the Mozilla Public License 2.0 at https://mozilla.org/MPL/2.0/
// © mohanee

//@version=4
strategy("EMA_cumulativeVolume_crossover[Strategy]", overlay=true, pyramiding=5, default_qty_type=strategy.percent_of_equity,  default_qty_value=20, initial_capital=10000)


emaLength= input(25, title="EMA Length", minval=1, maxval=200)
cumulativePeriod = input(100,  title="cumulative volume Period", minval=1, maxval=200)


riskCapital = input(title="Risk % of capital", defval=10, minval=1)
stopLoss=input(8,title="Stop Loss",minval=1)
takePartialProfits=input(true, title="take partial profits  (percentage same as stop loss)")

tradeDirection=input(title="Trade Direction", defval="LONG", options=["LONG", "SHORT"])

avgPrice = (high + low + close) / 3
avgPriceVolume = avgPrice * volume

cumulPriceVolume = sum(avgPriceVolume, cumulativePeriod)
cumulVolume = sum(volume, cumulativePeriod)

cumValue = cumulPriceVolume / cumulVolume

emaVal=ema(close, emaLength)

emaCumValue1=ema(cumValue, emaLength)
emaCumValue2=ema(cumValue, emaLength*2)

emaCumValueHistory=ema(cumValue[emaLength], emaLength)


//vwapVal1=vwap(hlc3)

rsiVal=rsi(close,5)

plotEma=plot(emaVal, title="EMA", color=color.green,  transp=25)
//plot(vwapValue, title="Cumulate Volumne", color=color.orange,  linewidth=2, transp=25)
//plot(vwapVal1, title="vwapVal1", color=color.purple,  linewidth=1, transp=25)
plotCum=plot(emaCumValue1, title="emaVwapValue", color=color.purple,  linewidth=2, transp=35)
plot(emaCumValue2, title="emaVwapValue", color=color.yellow,  linewidth=3, transp=25)
fill(plotEma,plotCum, color=emaVal>emaCumValue1 ? color.lime : color.red, transp=35, title="ema and cum area")

plot(emaCumValueHistory, title="emaCumValueHistory", color=color.black,  linewidth=2, transp=25)


//bgcolor(emaVal>vwapValue?color.blue:color.purple)    

//Entry--
//Echeck how many units can be purchased based on risk manage ment and stop loss
qty1 = (strategy.equity  * riskCapital / 100 ) /  (close*stopLoss/100)  

//check if cash is sufficient  to buy qty1  , if capital not available use the available capital only
qty1:= (qty1 * close >= strategy.equity ) ? (strategy.equity / close) : qty1

//strategy.entry(id="LE",comment="LE", long=true, qty=qty1, when=crossover(emaVal, vwapValue)  and (tradeDirection=="LONG") )    //emaVal>vwapValue and crossover(close , emaVal)

strategy.entry(id="LE",comment="LE", long=true, qty=qty1, when=strategy.position_size==0 and crossover(emaVal, emaCumValue1)  and (tradeDirection=="LONG") )    //emaVal>vwapValue and crossover(close , emaVal)

//re-entry
rentryCondition1=strategy.position_size>1 and emaVal > emaCumValue1 and emaCumValue1>emaCumValue2 and crossover(close, emaCumValue2) and close>open and  (tradeDirection=="LONG")
strategy.entry(id="LE",comment="LE RE", long=true, qty=qty1, when=rentryCondition1 )

rentryCondition2=strategy.position_size>1 and emaVal > emaCumValue1 and emaCumValue1>emaCumValueHistory and crossover(close, emaCumValueHistory) and close>open and  (tradeDirection=="LONG")
//strategy.entry(id="LE",comment="LE RE", long=true, qty=qty1, when=rentryCondition2 )    


//stoploss
stopLossVal=  strategy.position_size>=1 ?  (strategy.position_avg_price * (1-(stopLoss*0.01) )) : 0.00

//draw initil stop loss
//plot(strategy.position_size>=1 ? stopLossVal : na, color = color.purple , style=plot.style_linebr,  linewidth = 2, title = "stop loss")

//partial exits
takeProfit=  strategy.position_size>=1 ?  (strategy.position_avg_price * (1+(1*0.01) )) : ( close[1] * 2 )
//if(takePartialProfits==true)
    //strategy.close(id="LE", comment="Partial"+tostring(close-strategy.position_avg_price, "###.##") , qty=strategy.position_size/3 , when = (tradeDirection=="LONG" ) and close>takeProfit and crossunder(close, emaVal) )    //close<close[1] and close[1]<close[2] and close[2]<close[3])

strategy.close(id="LE", comment="PExit Points=>"+tostring(close-strategy.position_avg_price, "###.##") , qty=strategy.position_size/3 , when = (tradeDirection=="LONG" ) and  takePartialProfits == true and close>=takeProfit and crossunder(rsiVal,90) )

profitVal=    strategy.position_size>=1 ?  (strategy.position_avg_price * (1+(1*0.01) )) : ( close[1] * 2 )

//strategy.close(id="LE" , comment="LE Exit Points="+tostring(close-strategy.position_avg_price, "###.##"), when=crossunder(emaVal, vwapValue) and (tradeDirection=="LONG") )

strategy.close(id="LE" , comment="Exit Points=>"+tostring(close-strategy.position_avg_price, "###.##"), when=  crossunder(emaVal, emaCumValue1) and (tradeDirection=="LONG") )


strategy.close(id="LE" , comment="SL Exit Loss="+tostring(close-strategy.position_avg_price, "###.##"), when= close < stopLossVal   and (tradeDirection=="LONG") )


//for short  you dont have to wait crossodown of ema, falling is speed , so just check if close crossing down vwapVal
strategy.entry(id="SE",comment="SE", long=false, qty=qty1, when=crossunder(emaVal, emaCumValue1) and (tradeDirection=="SHORT") )    //emaVal>vwapValue and crossover(close , emaVal)


//stoploss
stopLossValUpside=  abs(strategy.position_size)>=1 and tradeDirection=="SHORT" ?  (strategy.position_avg_price * (1+(stopLoss*0.01) )) : 0.00

//draw initil stop loss
//plot(abs(strategy.position_size)>=1 and tradeDirection=="SHORT" ? stopLossValUpside : na, color = color.purple , style=plot.style_linebr,  linewidth = 2, title = "stop loss")

//partial exits
shortTakeProfit=  abs(strategy.position_size)>=1 and tradeDirection=="SHORT" ?  (strategy.position_avg_price * (1-(stopLoss*0.01) )) : 0.00
if(takePartialProfits==true)
    strategy.close(id="SE", comment="Partial" , qty=strategy.position_size/3 , when = (tradeDirection=="SHORT"   ) and  crossover(rsiVal,15) )  //close<takeProfit and (emaVal - close)>8 )
  
//strategy.close(id="SE" , comment="SE Exit Points="+tostring(close-strategy.position_avg_price, "###.##"), when=crossover(emaVal, vwapValue) and (tradeDirection=="SHORT") )
//strategy.close(id="SE" , comment="SE Exit Points="+tostring(close-strategy.position_avg_price, "###.##"), when= abs(strategy.position_size)>=1 and ( (emaVal<emaCumValue1 and close>emaCumValue1 and open>emaCumValue1 and close>open )   or (crossover(emaVal,emaCumValue1))  ) and (tradeDirection=="SHORT") )

//strategy.close(id="SE" , comment="SL Exit Loss="+tostring(close-strategy.position_avg_price, "###.##"), when= abs(strategy.position_size)>=1 and  close > stopLossValUpside   and (tradeDirection=="SHORT"   ) )
strategy.close(id="SE" , comment="SL Exit Loss="+tostring(close-strategy.position_avg_price, "###.##"), when= abs(strategy.position_size)>=1 and  crossover(emaVal, emaCumValue1)   and (tradeDirection=="SHORT"   ) )