
Die Strategie verwendet den doppelten RSI-Indikator für den langen und kurzen Zwei-Wege-Handel und ist in Kombination mit dem Gleichgewicht-System, um die Trendrichtung zu bestimmen. Die Strategie gehört zu der doppelten RSI-Quantifizierungsstrategie. Die Strategie verwendet zuerst den RSI-Indikator, um das Überholsignal zu bestimmen, und in Kombination mit dem Gleichgewicht, um die Trendrichtung zu bestimmen.
Die Strategie setzt zunächst zwei RSI-Parameter ein, einen längeren Zeitraum als Haupthandelsentscheidung und einen kürzeren Zeitraum als Hilfsfilter. Wenn der längere Zeitraum unter der RSI-Linie die Verkaufslinie überschreitet, wird ein Mehrwertsignal erzeugt, und wenn der kurze Zeitraum unter der RSI-Linie die Kauflinie überschreitet, wird ein Kurzwertsignal erzeugt, was eine kurze Kreuzhandelsmöglichkeit für die Länge des Doppel-RSI-Indikators bildet.
Um falsche Signale zu filtern, führt die Strategie auch SMA und EMA-Mittel ein, um Trends zu beurteilen. RSI-Mehrsignale werden nur berücksichtigt, wenn die kurzfristige SMA-Linie die langfristige EMA-Linie durchbricht, und RSI-Kürzungssignale werden nur berücksichtigt, wenn die kurzfristige SMA-Linie die langfristige EMA-Linie durchbricht, um sicherzustellen, dass die doppelte RSI-Signal mit der Trendrichtung übereinstimmt, und um einen Gegentrend zu vermeiden.
Die Strategie setzt außerdem eine Stop-Loss-Stop-Logik ein. Nach dem Eröffnen der Position werden zwei verschiedene Stop-Off-Karten gleichzeitig abgegeben und eine Stop-Loss-Position gesetzt.
Die Dual-RSI-Quantifizierung hat folgende Vorteile:
Der RSI mit zwei Zeitperioden kann die Mehrraumsignale genauer beurteilen. Die lang- und kurze RSI-Kreuzkombination kann einige falsche Signale filtern und die Signalqualität verbessern.
Das Gleichgewicht-System hilft bei der Bestimmung der Richtung des großen Trends, verhindert den Trendwiderhandel und filtert den größten Teil des Noise-Tradings und erhöht die Gewinnrate.
Flexible Stop-Loss-Mechanismen, die durch verschiedene Stop-Settings einen höheren Gewinn erzielen können, aber auch Risiken kontrollieren können.
Die Strategie-Trading-Logik ist einfach und klar, leicht zu verstehen und zu optimieren, geeignet für das Lernen von Quantitative Traders.
Trotz der Vorteile der Dual-RSI-Quantifizierung gibt es folgende Risiken:
Der RSI ist selbst unwirksam bei der Beurteilung von Erschütterungen und Trendwechseln, und die Strategie kann in diesen Märkten nicht effektiv sein.
Ein lineares System filtert zwar geringe Geräusche, ist jedoch nicht sehr effektiv bei der Beurteilung von Trendänderungen im Zwischenzyklus und kann einen Trendwendepunkt verpassen.
Eine falsche Einstellung des Stop-Loss-Systems kann zu einem zu breiten Stop-Loss oder zu kleinen Stop-Loss führen und die Effektivität der Strategie beeinträchtigen.
Massive Depositionierung und Übernahme von Positionen kann zu einer Vergrößerung der Verluste führen und die Größe der Positionen muss kontrolliert werden.
Die Risiken können durch Anpassung der RSI-Parameter, Einführung von fortgeschritteneren Trend- und Umkehrindikatoren, Optimierung der Stop-Loss-Logik und Kontrolle der Positionen verringert werden.
Die Dual-RSI-Quantifizierungsstrategie kann in folgenden Richtungen weiter optimiert werden:
Versuche verschiedene Parameterkombinationen, optimiere die RSI-Zyklusparameter und finde die optimale Kombination aus langen und kurzen RSI-Indikatoren.
Verschiedene Mittelwert-Indikatoren werden getestet, Indikatoren wie MACD werden eingeführt, um Trends und Chancen auf Umkehrung zu beurteilen.
Optimieren Sie Ihre Stop-Loss-Strategie, indem Sie einen Stop-Loss-Tracker einrichten oder den Stop-Loss bewegen, um den Stop-Loss flexibler zu gestalten.
Positionskontrollmodul hinzugefügt, um mehr Leerpositionen in verschiedenen Phasen des großen Periodentrends zu steuern.
Die Zunahme der Genauigkeit von Eingängen und Ausgängen durch die Einführung von maschinellen Lernmodellen.
Es ist wichtig, dass die Optimierung der Rückmeldungen durchgeführt wird, um die beste Handelsvariante und die beste Zeitspanne zu finden.
Die Dual RSI Quantitative Strategie ist eine typische Trend-Tracking-Strategie insgesamt. Die Strategie, die die Dual RSI-Indikatoren kombiniert, um die Handelssignale zu beurteilen und die Geräusche des Gleichgewicht-Systems zu filtern, ist sehr klassisch und praktisch. Obwohl die Strategie auch einen gewissen Raum für Verbesserungen hat, ist die Gesamtbetriebslogik klar, leicht zu verstehen und zu optimieren.
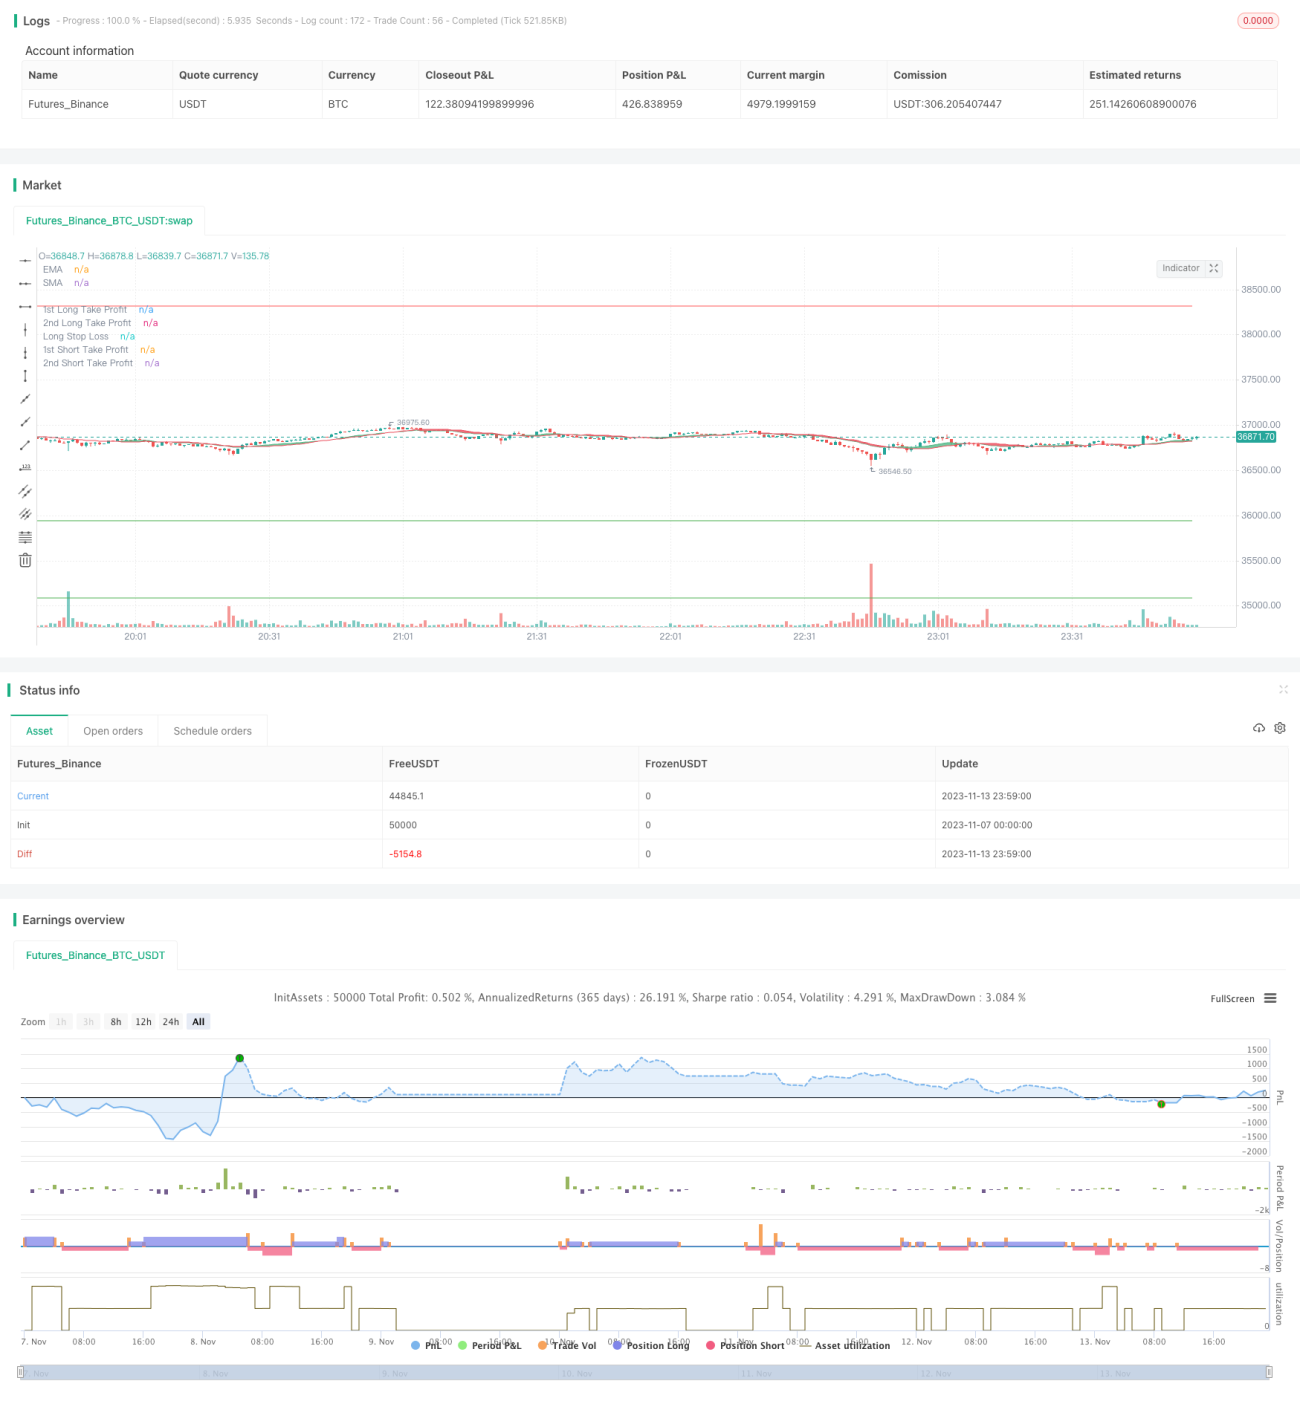
/*backtest
start: 2023-11-07 00:00:00
end: 2023-11-14 00:00:00
period: 1m
basePeriod: 1m
exchanges: [{"eid":"Futures_Binance","currency":"BTC_USDT"}]
*/
//@version=4
strategy("Growth Producer", overlay=true, initial_capital = 1000, currency = "USD", pyramiding = 2, commission_type=strategy.commission.percent, commission_value=0.07, default_qty_type = strategy.percent_of_equity, default_qty_value = 100)
//Functions
Atr(p) =>
atr = 0.
Tr = max(high - low, max(abs(high - close[1]), abs(low - close[1])))
atr := nz(atr[1] + (Tr - atr[1])/p,Tr)
/// TREND
ribbon_period = input(19, "Period", step=1)
leadLine1 = ema(close, ribbon_period)
leadLine2 = sma(close, ribbon_period)
p1 = plot(leadLine1, color= #53b987, title="EMA", transp = 50, linewidth = 1)
p2 = plot(leadLine2, color= #eb4d5c, title="SMA", transp = 50, linewidth = 1)
fill(p1, p2, transp = 60, color = leadLine1 > leadLine2 ? #53b987 : #eb4d5c)
// Relative volatility index
length = input(120,"RVI period", minval=1), src = close
len = 14
stddev = stdev(src, length)
upper = ema(change(src) <= 0 ? 0 : stddev, len)
lower = ema(change(src) > 0 ? 0 : stddev, len)
rvi = upper / (upper + lower) * 100
benchmark = input(35, "RVI benchmark", minval=10, maxval=100, step=0.1)
// Plot RVI
// h0 = hline(80, "Upper Band", color=#C0C0C0)
// h1 = hline(20, "Lower Band", color=#C0C0C0)
// fill(h0, h1, color=#996A15, title="Background")
// offset = input(0, "Offset", type = input.integer, minval = -500, maxval = 500)
// plot(rvi, title="RVI", color=#008000, offset = offset)
/// MFI input
mfi_source = hlc3
mfi_length = input(19, "MFI Length", minval=1)
mfi_lower = input(15, "MFI Lower level", minval=0, maxval=50)
mfi_upper = input(90, "MFI Higher level", minval=50, maxval=100)
// MFI
upper_s = sum(volume * (change(mfi_source) <= 0 ? 0 : mfi_source), mfi_length)
lower_s = sum(volume * (change(mfi_source) >= 0 ? 0 : mfi_source), mfi_length)
mf = rsi(upper_s, lower_s)
// mfp = plot(mf, color=color.new(color.gray,0), linewidth=1)
// top = hline(mfi_upper, color=color.new(color.gray, 100), linewidth=1, editable=false)
// bottom = hline(mfi_lower, color=color.new(color.gray,100), linewidth=1, editable=false)
// hline(0, color=color.new(color.black,100), editable=false)
// hline(100, color=color.new(color.black,100), editable=false)
// Breaches
// b_color = (mf > mfi_upper) ? color.new(color.red,70) : (mf < mfi_lower) ? color.new(color.green,60) : na
// bgcolor(HighlightBreaches ? b_color : na)
// fill(top, bottom, color=color.gray, transp=75)
// Initial inputs
Act_RSI_VWAP_long = input(true, "RSI VOLUME WEIGHTED AVERAGE PRICE LONG")
RSI_VWAP_length_long = input(16, "RSI-VWAP LENGTH LONG")
RSI_VWAP_overSold_long = input(13, "RSI-VWAP OVERSOLD LONG", type=input.float)
RSI_VWAP_overBought_long = input(68, "RSI-VWAP OVERBOUGHT LONG", type=input.float)
Act_RSI_VWAP_short = input(true, "RSI VOLUME WEIGHTED AVERAGE PRICE SHORT")
RSI_VWAP_length_short = input(14, "RSI-VWAP LENGTH SHORT")
RSI_VWAP_overSold_short = input(7, "RSI-VWAP OVERSOLD SHORT", type=input.float)
RSI_VWAP_overBought_short = input(68, "RSI-VWAP OVERBOUGHT SHORT", type=input.float)
// RSI with VWAP as source
RSI_VWAP_long = rsi(vwap(close), RSI_VWAP_length_long)
RSI_VWAP_short = rsi(vwap(close), RSI_VWAP_length_short)
// Plot Them Separately.
// Plotting LONG, Put overlay=false
// r=plot(RSI_VWAP_long, color = RSI_VWAP_long > RSI_VWAP_overBought_long ? color.red : RSI_VWAP_lnog < RSI_VWAP_overSold_long ? color.lime : color.blue, title="rsi", linewidth=2, style=plot.style_line)
// h1=plot(RSI_VWAP_overBought_long, color = color.gray, style=plot.style_stepline)
// h2=plot(RSI_VWAP_overSold_long, color = color.gray, style=plot.style_stepline)
// fill(r,h1, color = RSI_VWAP_long > RSI_VWAP_overBought_long ? color.red : na, transp = 60)
// fill(r,h2, color = RSI_VWAP_long < RSI_VWAP_overSold_long ? color.lime : na, transp = 60)
// Plotting SHORT, Put overlay=false
// r=plot(RSI_VWAP_short, color = RSI_VWAP_short > RSI_VWAP_overBought_short ? color.red : RSI_VWAP_short < RSI_VWAP_overSold_short ? color.lime : color.blue, title="rsi", linewidth=2, style=plot.style_line)
// h1=plot(RSI_VWAP_overBought_short, color = color.gray, style=plot.style_stepline)
// h2=plot(RSI_VWAP_overSold_short, color = color.gray, style=plot.style_stepline)
// fill(r,h1, color = RSI_VWAP_short > RSI_VWAP_overBought_short ? color.red : na, transp = 60)
// fill(r,h2, color = RSI_VWAP_short < RSI_VWAP_overSold_short ? color.lime : na, transp = 60)
/////// STRATEGY Take Profit / Stop Loss ////////
////// LONG //////
long_tp1_inp = input(3.3, title='Long Take Profit 1 %', step=0.1)/100
long_tp1_qty = input(15, title="Long Take Profit 1 Qty", step=1)
long_tp2_inp = input(12, title='Long Take Profit 2%', step=0.1)/100
long_tp2_qty = input(100, title="Long Take Profit 2 Qty", step=1)
long_sl_inp = input(3.3, title='Long Stop Loss %', step=0.1)/100
long_take_level_1 = strategy.position_avg_price * (1 + long_tp1_inp)
long_take_level_2 = strategy.position_avg_price * (1 + long_tp2_inp)
long_stop_level = strategy.position_avg_price * (1 - long_sl_inp)
////// SHORT //////
short_tp1_inp = input(3.2, title='Short Take Profit 1 %', step=0.1)/100
short_tp1_qty = input(20, title="Short Take Profit 1 Qty", step=1)
short_tp2_inp = input(5.5, title='Short Take Profit 2%', step=0.1)/100
short_tp2_qty = input(100, title="Short Take Profit 2 Qty", step=1)
short_sl_inp = input(3.2, title='Short Stop Loss %', step=0.1)/100
short_take_level_1 = strategy.position_avg_price * (1 - short_tp1_inp)
short_take_level_2 = strategy.position_avg_price * (1 - short_tp2_inp)
short_stop_level = strategy.position_avg_price * (1 + short_sl_inp)
///Strategy_Conditions
/// LONG ///
entry_long =(crossover(RSI_VWAP_long, RSI_VWAP_overSold_long) and leadLine2<leadLine1) or (crossunder(mf,mfi_lower) and leadLine2<leadLine1)
entry_price_long=valuewhen(entry_long,close,0)
exit_long =crossunder(RSI_VWAP_long, RSI_VWAP_overBought_long)
/// SHORT ///
entry_short =crossunder(RSI_VWAP_short, RSI_VWAP_overBought_short) and leadLine2>leadLine1 or (crossover(mf,mfi_upper) and leadLine2>leadLine1)
entry_price_short=valuewhen(entry_short,close,0)
exit_short =crossover(RSI_VWAP_short, RSI_VWAP_overSold_short)
////// BACKTEST PERIOD ///////
testStartYear = input(2019, "Backtest Start Year")
testStartMonth = input(1, "Backtest Start Month")
testStartDay = input(1, "Backtest Start Day")
testPeriodStart = timestamp(testStartYear,testStartMonth,testStartDay,0,0)
testStopYear = input(2020, "Backtest Stop Year")
testStopMonth = input(12, "Backtest Stop Month")
testStopDay = input(31, "Backtest Stop Day")
testPeriodStop = timestamp(testStopYear,testStopMonth,testStopDay,0,0)
testPeriod() => true
if testPeriod()
if strategy.position_size == 0 or strategy.position_size > 0 and rvi>benchmark
strategy.entry("long", true, when = entry_long, comment="Insert Enter Long Comment")
strategy.exit("TP1","long", qty_percent=long_tp1_qty, limit=long_take_level_1, stop=long_stop_level)
strategy.exit("TP2","long", qty_percent=long_tp2_qty, limit=long_take_level_2, stop=long_stop_level)
strategy.close("long", when=exit_long, comment = "Insert Exit Long Comment")
if strategy.position_size == 0 or strategy.position_size < 0 and rvi>benchmark
strategy.entry("short", false, when = entry_short, comment="Insert Enter Short Comment")
strategy.exit("TP1","short", qty_percent=short_tp1_qty, limit=short_take_level_1, stop=short_stop_level)
strategy.exit("TP2","short", qty_percent=short_tp2_qty, limit=short_take_level_2, stop=short_stop_level)
strategy.close("short", when=exit_short, comment = "Insert Exit Short Comment")
// LONG POSITION
plot(strategy.position_size > 0 ? long_take_level_1 : na, style=plot.style_linebr, color=color.green, linewidth=1, title="1st Long Take Profit")
plot(strategy.position_size > 0 ? long_take_level_2 : na, style=plot.style_linebr, color=color.green, linewidth=1, title="2nd Long Take Profit")
plot(strategy.position_size > 0 ? long_stop_level : na, style=plot.style_linebr, color=color.red, linewidth=1, title="Long Stop Loss")
// SHORT POSITION
plot(strategy.position_size < 0 ? short_take_level_1 : na, style=plot.style_linebr, color=color.green, linewidth=1, title="1st Short Take Profit")
plot(strategy.position_size < 0 ? short_take_level_2 : na, style=plot.style_linebr, color=color.green, linewidth=1, title="2nd Short Take Profit")
plot(strategy.position_size < 0 ? short_stop_level : na, style=plot.style_linebr, color=color.red, linewidth=1, title="Long Stop Loss")