
Es handelt sich um eine Schlüsselpunkte-Strategie für den Handel innerhalb eines Tages in Indien, bei der die wichtigsten Unterstützungs- und Widerstandspunkte mit Hilfe des Eröffnungs- und Höchstpreises, des Tiefpreises und des Schlusspreises berechnet werden, um bei einem Preisbruch an diesen Punkten zu handeln.
Die wichtigsten Schwerpunkte werden wie folgt berechnet:
PP = (最高价+最低价+收盘价)/3
R1 = 2*PP - 最低价
S1 = 2*PP - 最高价
Die Risiken können auf folgende Weise gelöst werden:
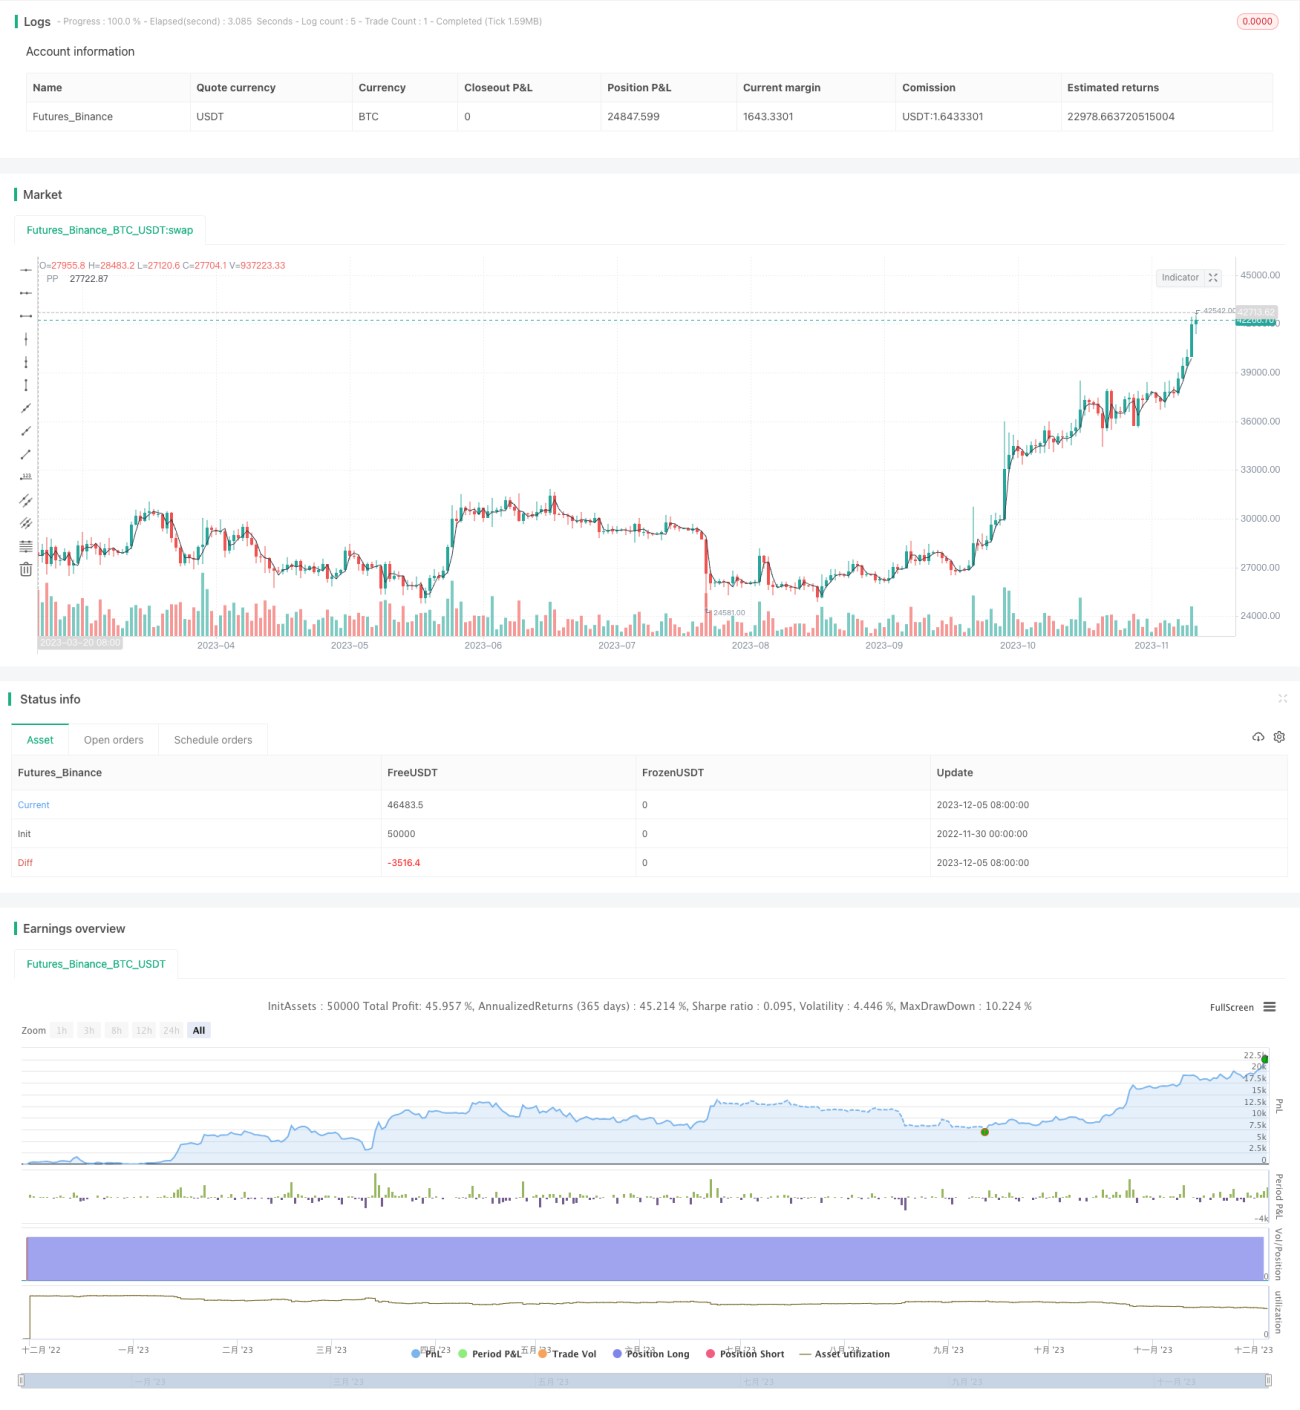
Die Strategie ist insgesamt relativ einfach und direkt, die Wirksamkeit kann leicht durch historische Daten überprüft werden. Als Intraday-Handelsstrategie bietet sie eine hohe Wahrscheinlichkeit für einen Durchbruch an den Schlüsselpunkten und kann gute Ergebnisse erzielen. Da sie jedoch auf die Schlüsselpunkte angewiesen ist, besteht auch ein gewisses Risiko für einen falschen Durchbruch, das weiter optimiert werden muss.
/*backtest
start: 2022-11-30 00:00:00
end: 2023-12-06 00:00:00
period: 1d
basePeriod: 1h
exchanges: [{"eid":"Futures_Binance","currency":"BTC_USDT"}]
*/
// This source code is subject to the terms of the Mozilla Public License 2.0 at https://mozilla.org/MPL/2.0/
// © arameshraju
//Reference credit goes to All
//@version=4
strategy("ARR-Pivote-India-Stategy",shorttitle="ARR-PP-Ind", overlay=true)
// This source code is subject to the terms of the Mozilla Public License 2.0 at https://mozilla.org/MPL/2.0/
// © arameshraju
//User Input
showPrevDayHighLow = input(false, title="Show previous day's High & Low(PDH/PDL)", type=input.bool)
showPivoteLine = input(true, title="Show Pivot Point(PP)", type=input.bool)
showPivoteR1Line = input(false, title="Show Pivot Point Resistance (R1)", type=input.bool)
showPivoteS1Line = input(false, title="Show Pivot Point Support (S1)", type=input.bool)
tradeLong = input(true, title="Trade on Long Entry", type=input.bool)
tradeShort = input(false, title="Trade on Short Entry", type=input.bool)
maxLoss = input(0.5, title="Max Loss on one Trade", type=input.float)
tradeOn=input(title="Trade base Level", type=input.string,
options=["PP", "PDH", "PDL","R1","S1"], defval="PP")
sessSpec = input("0915-1530", title="Session time", type=input.session)
// Defaults
// Colors
cColor = color.black
rColor = color.red
sColor = color.green
// Line style & Transparency
lStyle = plot.style_line
lTransp = 35
// Get High & Low
getSeries(_e, _timeFrame) => security(syminfo.tickerid, _timeFrame, _e, lookahead=barmerge.lookahead_on)
is_newbar(res, sess) =>
t = time(res, sess)
na(t[1]) and not na(t) or t[1] < t
newbar = is_newbar("375", sessSpec)
// Today's Session Start timestamp
y = year(timenow)
m = month(timenow)
d = dayofmonth(timenow)
// Start & End time for Today
start = timestamp(y, m, d, 09, 15)
end = start + 86400000
PrevDayHigh = getSeries(high[1], 'D')
PrevDayLow = getSeries(low[1], 'D')
PrevDayClose = getSeries(close[1], 'D')
PivoteLine=(PrevDayHigh+PrevDayLow+PrevDayClose) /3
PivoteR1=(PivoteLine*2) -PrevDayLow
PivoteS1=(PivoteLine*2) -PrevDayHigh
orbPrevDayOpen = getSeries(open[1], 'D')
orbPrevDayClose = getSeries(close[1], 'D')
// //Preview Day High line
// _pdh = line.new(start, PrevDayHigh, end, PrevDayHigh, xloc.bar_time, color=color.red, style=line.style_solid, width=2)
// line.delete(_pdh[1])
// _pdl = line.new(start, PrevDayLow, end, PrevDayLow, xloc.bar_time, color=color.green, style=line.style_solid, width=2)
// line.delete(_pdl[1])
// _Pp = line.new(start, PrevDayLow, end, PrevDayLow, xloc.bar_time, color=color.green, style=line.style_dashed, width=2)
// line.delete(_Pp[1])
// //Previous Day Low Line
// l_pdh = label.new(start, PrevDayHigh, text="PD", xloc=xloc.bar_time, textcolor=rColor, style=label.style_none)
// label.delete(l_pdh[1])
// l_pdl = label.new(start, PrevDayLow, text="PD", xloc=xloc.bar_time, textcolor=sColor, style=label.style_none)
// label.delete(l_pdl[1])
// //Pivote Line
// l_pp = label.new(start, PivoteLine, text="PP", xloc=xloc.bar_time, textcolor=color.black, style=label.style_none)
// label.delete(l_pp[1])
// l_R1 = label.new(start, PivoteR1, text="R1", xloc=xloc.bar_time, textcolor=color.fuchsia, style=label.style_none)
// label.delete(l_pp[1])
// l_SR = label.new(start, PivoteS1, text="S2", xloc=xloc.bar_time, textcolor=color.navy, style=label.style_none)
// label.delete(l_pp[1])
plot(showPrevDayHighLow?PrevDayHigh:na , title=' PDH', color=rColor)
plot(showPrevDayHighLow?PrevDayLow:na, title=' PDL', color=sColor)
plot(showPivoteLine?PivoteLine:na, title=' PP', color=color.black)
plot(showPivoteR1Line?PivoteR1:na, title=' R1', color=color.fuchsia)
plot(showPivoteS1Line?PivoteS1:na, title=' S1', color=color.navy)
// Today's Session Start timestamp
// Start & End time for Today
//endTime = timestamp(t, m, d, 15, 00)
tradeEventPrice= if string("PDH")==tradeOn
PrevDayHigh
else if string("PDL")==tradeOn
PrevDayLow
else if string("R1")==tradeOn
PivoteR1
else if string("S1")==tradeOn
PivoteS1
else
PivoteLine
//tradeEventPrice=PrevDayHigh
if (open < tradeEventPrice) and ( close >tradeEventPrice ) and ( hour < 13 ) and tradeLong
strategy.entry("buy", strategy.long, 1, when=strategy.position_size <= 0)
if (open > tradeEventPrice) and ( close <tradeEventPrice ) and ( hour < 13 ) and tradeShort
strategy.entry("Sell", strategy.short, 1, when=strategy.position_size <= 0)
mxloss=orbPrevDayClose*maxLoss
strategy.exit("exit", "buy", loss = mxloss)
strategy.exit("exit", "Sell", loss = mxloss)
strategy.close_all(when = hour == 15 , comment = "close all entries")