
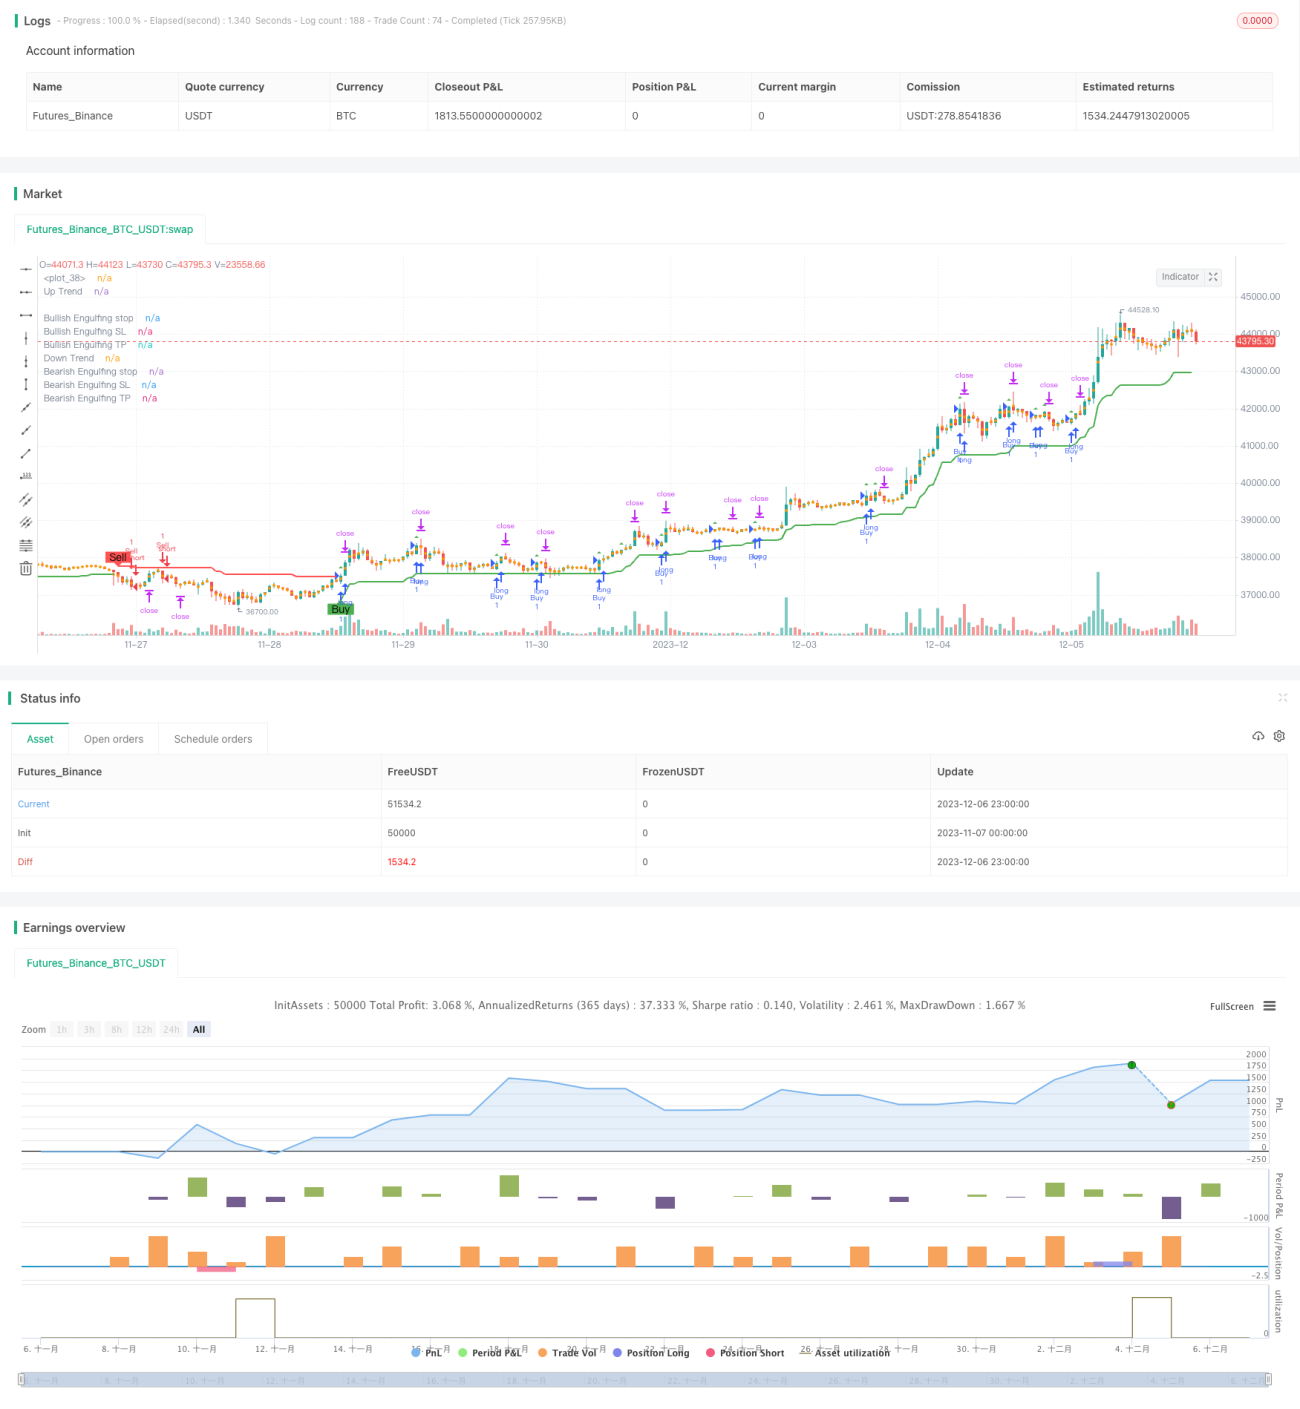
Die Übertrend-Sopplung-Strategie ist eine Trend-Tracking-Strategie, die die durchschnittliche tatsächliche Wellenlänge (ATR), die Übertrend-Indikatoren und die Sopplung-Form kombiniert, um die Richtung des Trends zu identifizieren und gleichzeitig nach Zugangsmöglichkeiten mit günstigen Quoten zu suchen, während die Sopplung-Form den Trend bestätigt.
Die Strategie nutzt zunächst die ATR und die Hypertrend-Indikatoren, um die Richtung der CURRENT-Markttrend zu bestimmen. Insbesondere wird sie als Abwärtstrend definiert, wenn der Preis unterhalb der Oberbahn liegt, und als Aufwärtstrend, wenn der Preis über der Unterbahn liegt.
Die Strategie entscheidet, ob die K-Linie eine Abnahmeform entwickelt. Laut der Code-Logik wird in einem Aufwärtstrend ein Mehrkopf-Abnahme ausgelöst, wenn der vorherige K-Linie-Abschlusspreis höher ist als der aktuelle K-Linie-Eröffnungspreis und der aktuelle K-Linie-Abschlusspreis niedriger ist als der Eröffnungspreis. In einem Abwärtstrend wird ein Leerkopf-Abnahme ausgelöst, wenn der vorherige K-Linie-Abschlusspreis niedriger ist als der aktuelle K-Linie-Eröffnungspreis und der aktuelle K-Linie-Abschlusspreis höher ist als der Eröffnungspreis.
Die Strategie berechnet außerdem den Stop-Loss- und den Stop-Off-Preis basierend auf der Absorptionsform. Nach dem Eintritt wird die aktuelle Position verlassen, wenn der Preis den Stop-Loss- oder den Stop-Off-Preis erreicht.
Die Strategie kombiniert die Vorzüge der Trendverfolgung und der Formerkennung, um Rückschlagsignale in Trendbewegungen zu erkennen und so die größeren Bewegungen an den Marktwendepunkten zu erfassen. Darüber hinaus kann der Stop-Loss-Mechanismus das Verlustrisiko effektiv kontrollieren.
Das größte Risiko dieser Strategie besteht darin, dass die Schluckform möglicherweise falsch gebrochen wird, was zu falschen Signalen führt. Darüber hinaus können die Stop-Loss- und Stop-Stop-Einstellungen zu arbiträr sein, um eine Gewinn- und Verlustbilanz zu erreichen. Es wird empfohlen, die Parameterkombination zu optimieren und die Stop-Loss-Stop-Position entsprechend anzupassen.
Es kann in Betracht gezogen werden, die Parameter des ATR in Echtzeit zu optimieren, um die Veränderungen der Marktvolatilität besser zu erfassen. Darüber hinaus können Trends in anderen Indikatoren untersucht werden, um die Stabilität der Strategie weiter zu verbessern.
Die Strategie des Übertrend-Sopfers kombiniert die Vorteile des Trend-Trackings und der Gestalterkennung, und die Strategie des Sopfers als Umkehrsignal ist an den Wendepunkten des Marktes sehr effektiv. Die Strategie birgt jedoch auch ein gewisses Risiko für falsche Signale, die weiter getestet und optimiert werden müssen, um das Risiko zu kontrollieren.
/*backtest
start: 2023-11-07 00:00:00
end: 2023-12-07 00:00:00
period: 1h
basePeriod: 15m
exchanges: [{"eid":"Futures_Binance","currency":"BTC_USDT"}]
*/
// This source code is subject to the terms of the Mozilla Public License 2.0 at https://mozilla.org/MPL/2.0/
// © Armanhammer
//@version=5
strategy("Engulfing with Trend", overlay=true)
Periods = input.int(title="ATR Period", defval=10)
src = input(hl2, title="Source")
Multiplier = input.float(title="ATR Multiplier", step=0.1, defval=3.0)
changeATR= input.bool(title="Change ATR Calculation Method ?", defval=true)
showsignals = input.bool(title="Show Buy/Sell Signals ?", defval=true)
highlighting = input.bool(title="Highlighter On/Off ?", defval=true)
atr2 = ta.sma(src, Periods)
atr= changeATR ? ta.atr(Periods) : atr2
up=src-(Multiplier*atr)
up1 = nz(up[1],up)
up := close[1] > up1 ? math.max(up,up1) : up
dn=src+(Multiplier*atr)
dn1 = nz(dn[1], dn)
dn := close[1] < dn1 ? math.min(dn, dn1) : dn
var trend = 1
trend := nz(trend[1], trend)
trend := trend == -1 and close > dn1 ? 1 : trend == 1 and close < up1 ? -1 : trend
upPlot = plot(trend == 1 ? up : na, title="Up Trend", style=plot.style_linebr, linewidth=2, color=color.green)
buySignal = trend == 1 and trend[1] == -1
plotshape(buySignal and showsignals ? up : na, title="Buy", style=shape.labelup, location=location.absolute, color=color.new(color.green, 0), text="Buy")
//plotshape(buySignal ? up : na, title="UpTrend Begins", location=location.absolute, style=shape.circle, size=size.tiny, color=color.green, transp=0)
//plotshape(buySignal and showsignals ? up : na, title="Buy", text="Buy", location=location.absolute, style=shape.labelup, size=size.tiny, color=color.green, textcolor=color.white, transp=0)
dnPlot = plot(trend == 1 ? na : dn, title="Down Trend", style=plot.style_linebr, linewidth=2, color=color.red)
sellSignal = trend == -1 and trend[1] == 1
plotshape(sellSignal and showsignals ? dn : na, title="Sell", style=shape.labeldown, location=location.absolute, color=color.new(color.red, 0), text="Sell")
//plotshape(sellSignal ? dn : na, title="DownTrend Begins", location=location.absolute, style=shape.circle, size=size.tiny, color=color.red, transp=0)
//plotshape(sellSignal and showsignals ? dn : na, title="Sell", text="Sell", location=location.absolute, style=shape.labeldown, size=size.tiny, color=color.red, textcolor=color.white, transp=0)
mPlot = plot(ohlc4, title="", style=plot.style_circles, linewidth=0)
longFillColor = highlighting and trend == 1 ? color.new(color.green, 0) : na
shortFillColor = highlighting and trend == -1 ? color.new(color.red, 0) : na
fill(upPlot, dnPlot, color=longFillColor)
fill(dnPlot, upPlot, color=shortFillColor)
alertcondition(buySignal, title="SuperTrend Buy", message="SuperTrend Buy!")
alertcondition(sellSignal, title="SuperTrend Sell", message="SuperTrend Sell!")
changeCond = trend != trend[1]
alertcondition(changeCond, title="SuperTrend Direction Change", message="SuperTrend has changed direction!")
// Define Downtrend and Uptrend conditions
downtrend = trend == -1
uptrend = trend == 1
// Engulfing
boringThreshold = input.float(25, title="Boring Candle Threshold (%)", minval=1, maxval=100)
engulfingThreshold = input.float(50, title="Engulfing Candle Threshold (%)", minval=1, maxval=100)
stopLevel = input.int(200, title="Stop Level (Pips)", minval=1)
// Boring Candle (Inside Bar) and Engulfing Candlestick Conditions
isBoringCandle = math.abs(open[1] - close[1]) * 100 / math.abs(high[1] - low[1]) <= boringThreshold
isEngulfingCandle = math.abs(open - close) * 100 / math.abs(high - low) <= engulfingThreshold
// Bullish and Bearish Engulfing Conditions
bullEngulfing = uptrend and close[1] < open[1] and close > open[1] and not isBoringCandle and not isEngulfingCandle
bearEngulfing = downtrend and close[1] > open[1] and close < open[1] and not isBoringCandle and not isEngulfingCandle
// Stop Loss, Take Profit, and Entry Price Calculation
bullStop = close + (stopLevel * syminfo.mintick)
bearStop = close - (stopLevel * syminfo.mintick)
bullSL = low
bearSL = high
bullTP = bullStop + (bullStop - low)
bearTP = bearStop - (high - bearStop)
// Entry Conditions
enterLong = bullEngulfing and uptrend
enterShort = bearEngulfing and downtrend
// Exit Conditions
exitLong = ta.crossover(close, bullTP) or ta.crossover(close, bullSL)
exitShort = ta.crossover(close, bearTP) or ta.crossover(close, bearSL)
// Check if exit conditions are met by the next candle
exitLongNextCandle = exitLong and (ta.crossover(close[1], bullTP[1]) or ta.crossover(close[1], bullSL[1]))
exitShortNextCandle = exitShort and (ta.crossover(close[1], bearTP[1]) or ta.crossover(close[1], bearSL[1]))
// Strategy Execution
if enterLong
strategy.entry("Buy", strategy.long)
if enterShort
strategy.entry("Sell", strategy.short)
// Exit Conditions for Long (Buy) Positions
if bullEngulfing and not na(bullTP) and not na(bullSL)
strategy.exit("Exit Long", from_entry="Buy", stop=bullSL, limit=bullTP)
// Exit Conditions for Short (Sell) Positions
if bearEngulfing and not na(bearTP) and not na(bearSL)
strategy.exit("Exit Short", from_entry="Sell", stop=bearSL, limit=bearTP)
// Plot Shapes and Labels
plotshape(series=bullEngulfing, style=shape.triangleup, location=location.abovebar, color=color.green)
plotshape(series=bearEngulfing, style=shape.triangledown, location=location.abovebar, color=color.red)
// Determine OP, SL, and TP
plot(series=bullEngulfing ? bullStop : na, title="Bullish Engulfing stop", color=color.red, linewidth=3, style=plot.style_linebr)
plot(series=bearEngulfing ? bearStop : na, title="Bearish Engulfing stop", color=color.red, linewidth=3, style=plot.style_linebr)
plot(series=bullEngulfing ? bullSL : na, title="Bullish Engulfing SL", color=color.red, linewidth=3, style=plot.style_linebr)
plot(series=bearEngulfing ? bearSL : na, title="Bearish Engulfing SL", color=color.red, linewidth=3, style=plot.style_linebr)
plot(series=bullEngulfing ? bullTP : na, title="Bullish Engulfing TP", color=color.green, linewidth=3, style=plot.style_linebr)
plot(series=bearEngulfing ? bearTP : na, title="Bearish Engulfing TP", color=color.green, linewidth=3, style=plot.style_linebr)
// Create labels if the condition for bullEngulfing or bearEngulfing is met
//if bullEngulfing
// label.new(x=bar_index, y=bullSL, text="SL: " + str.tostring(bullSL), color=color.red, textcolor=color.white, style=label.style_labelup, size=size.tiny)
//if bearEngulfing
// label.new(x=bar_index, y=bearSL, text="SL: " + str.tostring(bearSL), color=color.red, textcolor=color.white, style=label.style_labeldown, size=size.tiny)
//if bullEngulfing
// label.new(x=bar_index, y=bullTP, text="TP: " + str.tostring(bullTP), color=color.green, textcolor=color.white, style=label.style_labeldown, size=size.tiny)
//if bearEngulfing
// label.new(x=bar_index, y=bearTP, text="TP: " + str.tostring(bearTP), color=color.green, textcolor=color.white, style=label.style_labelup, size=size.tiny)