Cross-Moving-Average-Multiindikator-Handelsstrategie
Überblick
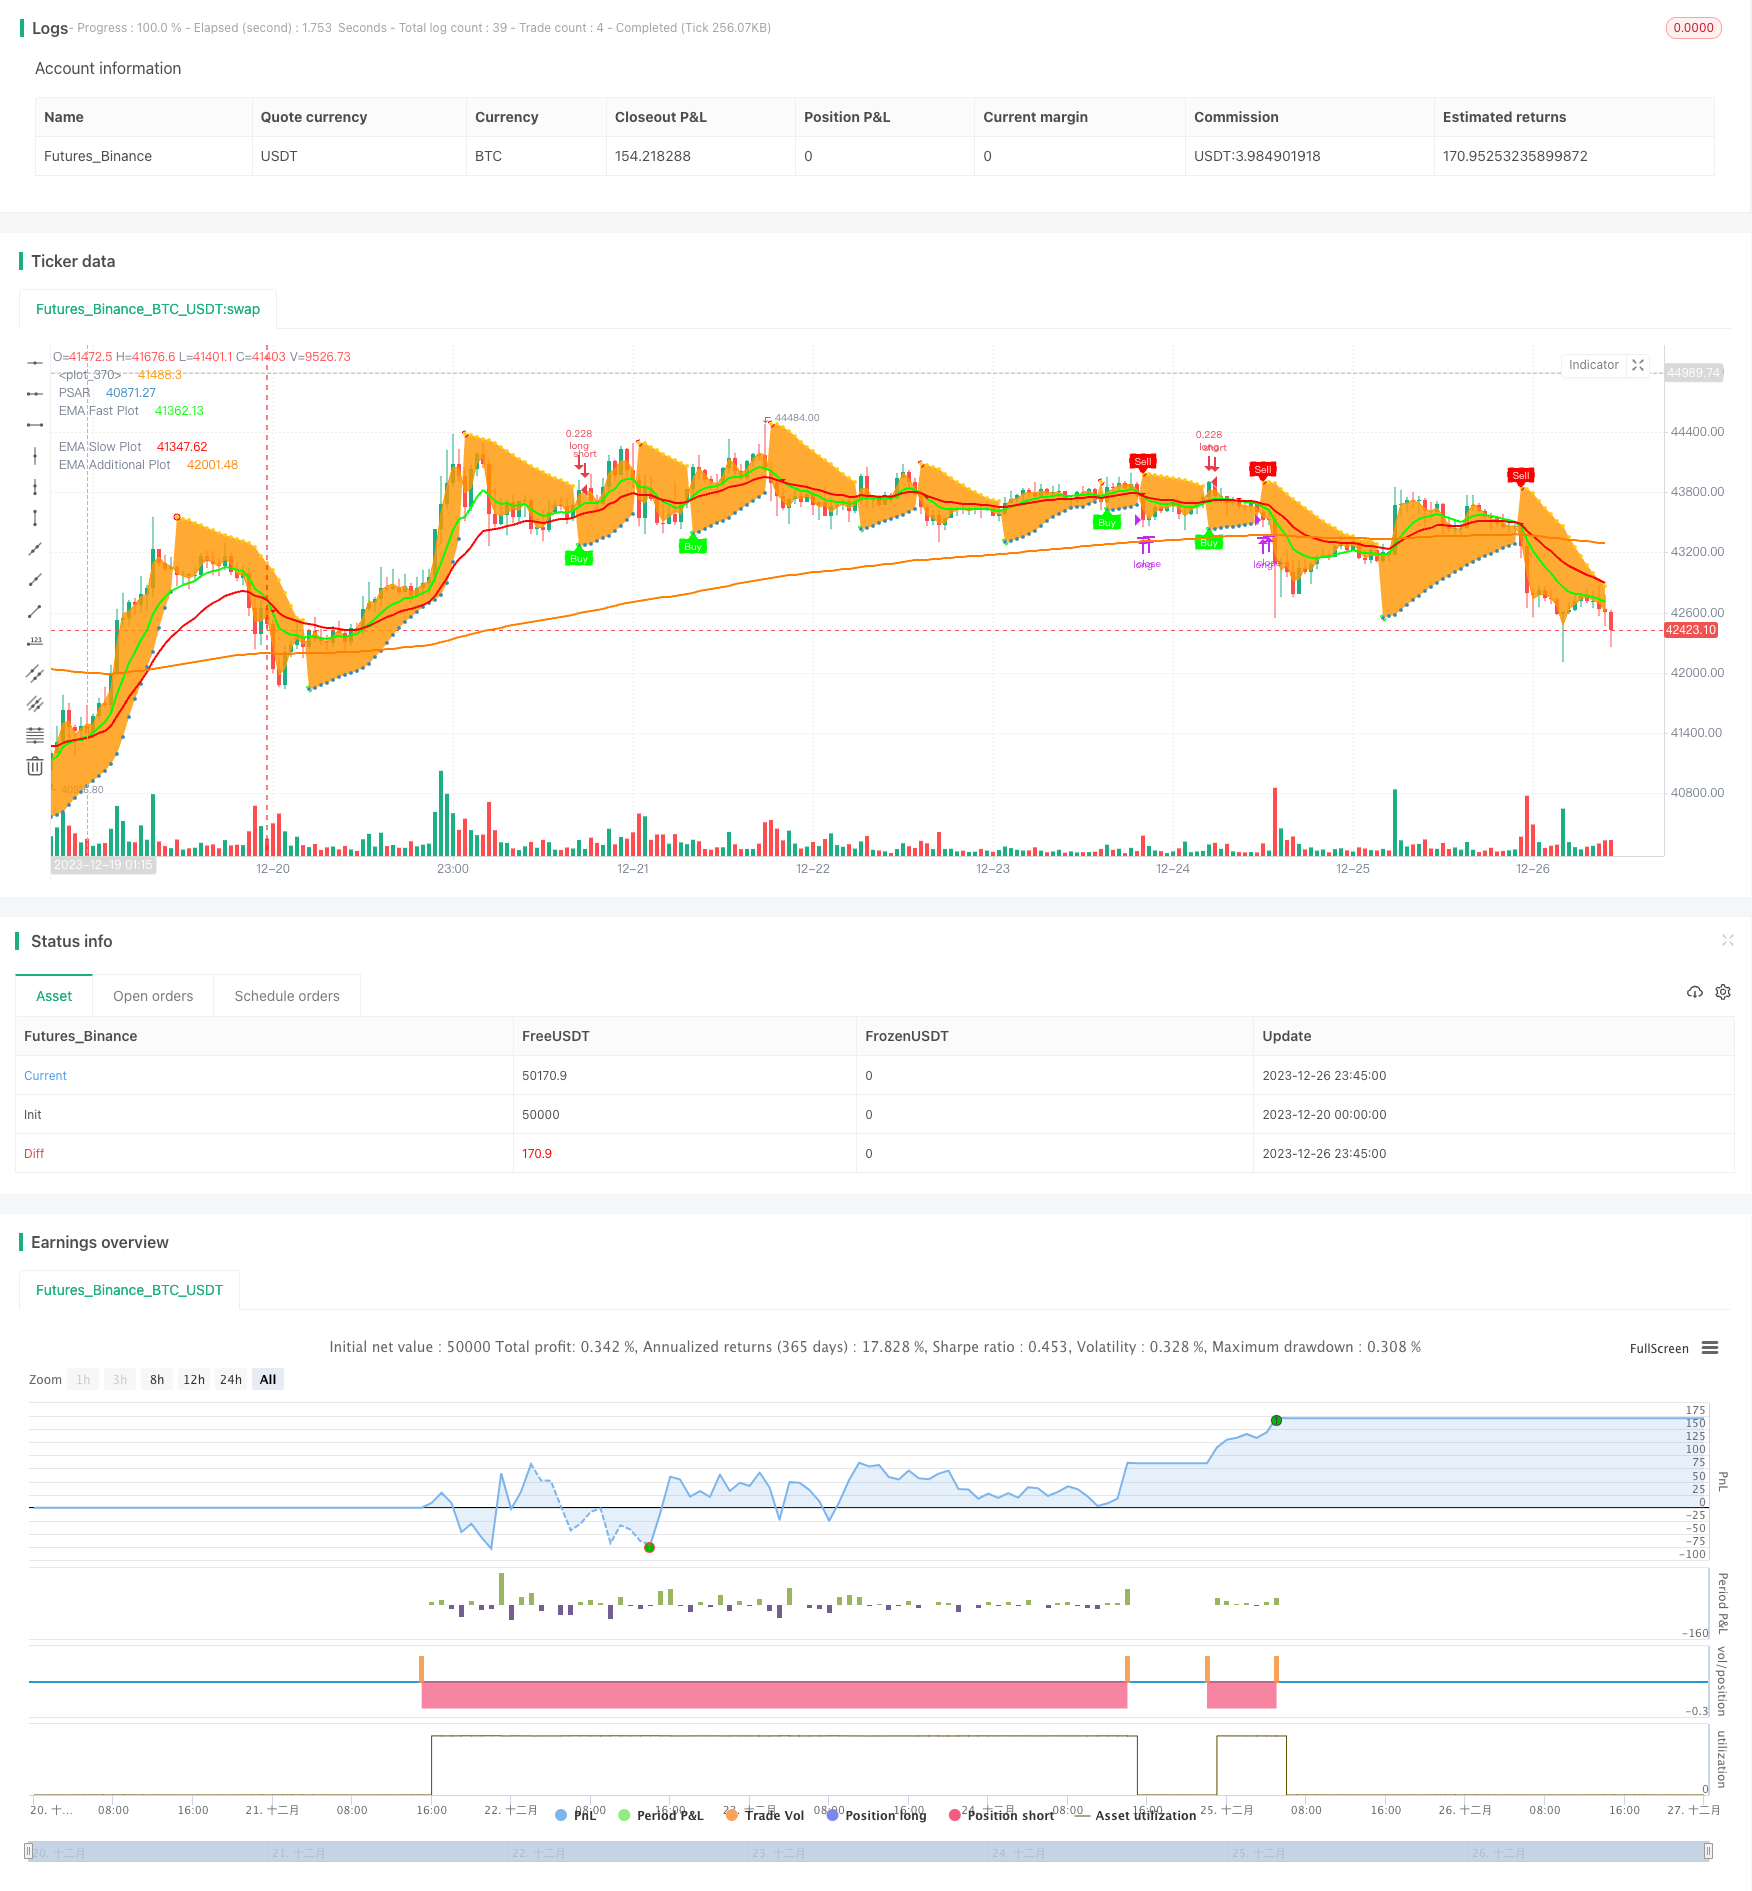
Diese Strategie kombiniert mehrere technische Indikatoren, darunter die Parabolic SAR, den Triple Index Moving Average (TEMA), den Ordinary Index Moving Average (EMA), den Relative Strength Index (RSI), den Balance Sheet Index (OBV) usw., um Rückschlagsignale für die Aktienpreise zu identifizieren, und kombiniert Trendfilter und Stop-Loss-Einstellungen, um Kauf- und Verkaufssignale zu erzeugen.
Strategieprinzip
Die Strategie nutzt die parapole SAR als Hauptindikator für die Preisumkehrung. SAR zeigt sich oberhalb des Preises in einem mehrköpfigen Zustand und unterhalb des Preises in einem leeren Zustand. SAR erzeugt ein Verkaufssignal, wenn es von unten nach oben geht, und ein Kaufsignal, wenn es von oben nach unten geht.
Um falsche Signale zu filtern, verwendet die Strategie TEMA- oder EMA-Technik als Bestätigungssignal. Ein Kaufsignal wird nur erzeugt, wenn das SAR-Signal und TEMA (langsam durch die Schnellleine) oder EMA (langsam durch die Schnellleine) gleichzeitig auftreten. Ein Verkaufsignal wird nur erzeugt, wenn das SAR-Signal und TEMA (langsam durch die Schnellleine) oder EMA (langsam durch die Schnellleine) gleichzeitig auftreten.
Die Strategie bietet auch die RSI- und OBV-Indikatoren als Bestätigungssignale für die Option.
Zusätzlich bietet die Strategie eine dreifache Darstellung der technischen EMA-Indikatoren, um die Preisentwicklung klarer zu beobachten; die Darstellung des modischen Indikators eMAMA, um die Trendwende zu beurteilen.
Die Strategie bietet außerdem eine Tabelle mit zusammengefassten Kennzahlen unterhalb der Tabelle, die einen schnellen Überblick über die aktuellen Entwicklungen in mehreren Kennzahlen ermöglicht.
Analyse der Stärken
Die Strategie kombiniert mehrere Indikatoren wie SAR, EMA/TEMA, RSI und OBV, um effektiv Preisumkehrsignale zu erkennen und falsche Durchbrüche zu vermeiden. Die Hinzufügung von dreifachen EMAs und dem Modelldurchschnitt eMAMA zur Trendbeurteilung kann die Genauigkeit verbessern.
Die Diagramme zeigen eine Vielzahl von Indikatoren, die einen umfassenden Überblick über die Marktlage bieten. Die hinzugefügte Indikatorenübersicht bietet einen schnellen Zugriff auf den aktuellen Stand mehrerer Indikatoren.
Die Regeln der Handelslogik sind klar, die Parameter sind anpassbar und können an verschiedene Handelsvarianten angepasst werden.
Risikoanalyse
Die Strategie basiert auf der Umwandlung des Indikators, die ein Signal erzeugt, und wenn der Indikator nicht korrekt eingestellt ist, wird eine Menge von Noise-Trading-Signalen erzeugt. Die Indikatorparameter müssen für verschiedene Handelsarten optimiert werden.
In horizontal sortierten Märkten kann der SAR-Indikator häufig falsche Signale erzeugen. In diesem Fall sollte auf die Bestätigung des Trend-Indikators geachtet werden.
Unzureichende Auswahl der Handelssorten kann auch dazu führen, dass die Strategie fehlschlägt. Die Auswahl der Sorten mit deutlichen Trends ist erforderlich, um die Strategie anzuwenden.
Optimierungsrichtung
Die Strategie kann in folgenden Richtungen optimiert werden:
- Optimierung der SAR-Parameter und Verringerung der Geräuschsignale
- Optimierung der Moving Average-Parameter zur Verbesserung der Genauigkeit von Trendbeurteilungen
- Ersetzen Sie die Bestätigungsindikatoren und testen Sie die Wirksamkeit von RSI, OBV und anderen Indikatoren
- Mehr zusätzliche Kennzahlen und eine umfangreiche Analyse der Zeiträume
- Optimierung von Stop-Loss-Strategien und Einschränkung von Einzelschäden
Zusammenfassen
Die Cross-Equilibrium-Multi-Indikator-Trading-Strategie integriert verschiedene häufig verwendete technische Analyse-Indikatoren, um Kauf- und Verkaufssignal zu bilden. Sie kann die Preiswendepunkte effektiv identifizieren. Die Parameter sind anpassbar und leicht zu optimieren.
/*backtest
start: 2023-12-20 00:00:00
end: 2023-12-27 00:00:00
period: 45m
basePeriod: 5m
exchanges: [{"eid":"Futures_Binance","currency":"BTC_USDT"}]
*/

//
// ██╗      █████╗ ███████╗ ██████╗██╗██╗   ██╗██╗ ██████╗ ██╗   ██╗███████╗    ███╗   ███╗ ██████╗ ███╗   ██╗██╗  ██╗
// ██║     ██╔══██╗██╔════╝██╔════╝██║██║   ██║██║██╔═══██╗██║   ██║██╔════╝    ████╗ ████║██╔═══██╗████╗  ██║██║ ██╔╝
// ██║     ███████║███████╗██║     ██║██║   ██║██║██║   ██║██║   ██║███████╗    ██╔████╔██║██║   ██║██╔██╗ ██║█████╔╝
// ██║     ██╔══██║╚════██║██║     ██║╚██╗ ██╔╝██║██║   ██║██║   ██║╚════██║    ██║╚██╔╝██║██║   ██║██║╚██╗██║██╔═██╗
// ███████╗██║  ██║███████║╚██████╗██║ ╚████╔╝ ██║╚██████╔╝╚██████╔╝███████║    ██║ ╚═╝ ██║╚██████╔╝██║ ╚████║██║  ██╗
// ╚══════╝╚═╝  ╚═╝╚══════╝ ╚═════╝╚═╝  ╚═══╝  ╚═╝ ╚═════╝  ╚═════╝ ╚══════╝    ╚═╝     ╚═╝ ╚═════╝ ╚═╝  ╚═══╝╚═╝  ╚═╝
//																		 https://www.tradingview.com/u/LasciviousMonk/
//                                                                                                    © LasciviousMonk
//
//
//  This source code is subject to the terms of the Mozilla Public License 2.0 at https://mozilla.org/MPL/2.0/
//  This script provided freely.  No guarantee of functionality is provided.  You are welcome to use, revise, or modify
//  this code in any way you wish.  However, I kindly request that you publish any scripts originating from this code as
//  'Public'.  Please do not use this code as a basis for "Protected" or "Invite Only" scripts.
//
//
// PSAR + EMA + TEMA combines Parabolic PSAR plus EMA and TEMA trendlines.
//      - EMA and TEMA crossovers have an up or down triangle to indicate direction of cross.  Please note
//          that because these are Moving Averages (MAs), the triangle may not exactly line up with the crossover.
//      - Added MESA Adaptive Moving Average (eMAMA).  Crossovers of the fast and slow eMAMA may be used instead of
// 			EMA or TEMA.
//		- Added third EMA line.  May be used to filter entries.  For example, set the additional EMA to 200.  Buy signals
//			wil only be sent if the price is greater than the additional EMA.
//		- Added RSI and OBV as alternative PSAR confirmations.
//
// "Traffic Light" table: summarizes PSAR, RSI, SRSI, TEMA, EMA, eMAMA, MACD, OBV, and CMF indicators in a table.
//  This is intended as a quick "heads up", not to replace the indicators themselves.
//      - Arrows indicate direction of change since the last bar.
//      - Moving average indicators are indicated as green if the fast MA > slow MA and fast [T]EMA is increasing, red otherwise.
//          [T]EMA will be yellow if fast MA has increased over the last 2 periods but fast MA < slow MA.
//      - PSAR is as green if the PSAR is increasing, red if it is decreasing.
//      - RSI is indicated as green if RSI < oversold, red if RSI > overbought, yellow otherwise.
//      - SRSI is indicated as green K < oversold, and red if K > overbought.  If oversold < K < overbought,
//          green if K > D and red if K < D.
//      - MACD, OBV and CMF are green if bullish, red if bearish.
//
//
//  Suggestions for use:
//      - Use fast EMA crossing above slow EMA as a confirmation for PSAR signals.
//      - TEMA or eMAMA can also be used for confirmation signals insead.
//      - Instead of using a moving average (EMA, TEMA, etc) for confirmation, you may use RSI or OBV.
//      - The "traffic light" table is intended as a "heads up" to call your attention to other indicators
//          you may want to check.  I suggest Cipher B/VMC Cipher_B, Neglected Volume, and/or CM_Ult_MacD_MTF
//          as useful comparions.
//
// Please don't rely solely on the table.  It is intended to alert you to look more closely at a plot, not to
//    provide all the information you need to enter or exit a position.  I find the table to be a nice companion
//    to VMC Cipher_B, which can be overwhelming in its complexity.
//
// Code used:
//      - TEMA With Alert by BerkSay
//      - Parabolic SAR by Alex Orekhov (everget)
//      - Ehlers MESA Adaptive Moving Average [LazyBear]
//      - EMA, RSI and SRSI built-ins.
//@version=4
strategy(overlay=true, title="PSAR + EMA/TEMA/RSI/OBV", currency = 'USD', shorttitle="PSAR+",
 pyramiding = 0, default_qty_type=strategy.percent_of_equity, default_qty_value=20,
 initial_capital=5000, calc_on_every_tick=true, calc_on_order_fills=false,
 commission_type=strategy.commission.percent, commission_value=0.1)

// ------------------------------------------------<[ Color Constants ]>----------------------------------------------

// Color values used from Pine Magic.  https://www.tradingview.com/script/yyDYIrRQ-Pine-Color-Magic-and-Chart-Theme-Simulator/
var transparent = color.new(color.black, 100)
var darkpurple  = #550055, dpurple = darkpurple // Alias for dark purple,  Not recommended for use on "Dark Charts"
var purple      = #990099
var fuchsia     = #FF00FF
var violet      = #AA00FF
var hanpurple   = #6000FF
var blue        = #0000FF
var cichlid     = #0040FF
var azure       = #0080FF
var skyblue     = #00C0FF
var aqua        = #00FFFF // Not recommended for use on "Light Charts" with 1px line thickness
var mint        = #00FF80
var lime        = #00FF00
var chartreuse  = #80FF00
var yellow      = #FFFF00 // Not recommended for use on "Light Charts"
var amber       = #FFCC00
var orange      = #FF8000
var redorange   = #FF4000
var red         = #FF0000
var hotpink     = #FF0080
var pink        = #FF80FF // Not recommended for use on "Light Charts"

// ------------------------------------------------<[ User Input ]>---------------------------------------------------
sourceGlobal = input(title="Source for indicator", defval=close, type=input.source, group="Global")
tradeLong = input(title="Create long positions?", defval=true, type=input.bool, group="Global")
tradeShort = input(title="Create short positions?", defval=false, type=input.bool, group="Global")


showPSAR = input(true, "Show PSAR?", group="PSAR")
psarStart = input(title="PSAR Start", type=input.float, step=0.001, defval=0.02, group="PSAR")
psarIncrement = input(title="PSAR Increment", type=input.float, step=0.001, defval=0.02, group="PSAR")
psarMaximum = input(title="PSAR Maximum", type=input.float, step=0.01, defval=0.2, group="PSAR")
psarConfirmation = input(title="Confirmation signal:", defval="EMA",
     options=["EMA", "TEMA", "eMAMA", "RSI", "OBV"], group="PSAR")
psarHighlightStartPoints = input(title="PSAR Highlight Start Points?", type=input.bool, defval=true, group="PSAR")
psarShowLabels = input(title="PSAR Show Buy/Sell Labels?", type=input.bool, defval=true, group="PSAR")
psarHighlightState = input(title="PSAR Highlight State?", type=input.bool, defval=false, group="PSAR")
colorPSARLong = input(title="Long", type=input.color, defval=lime, group="PSAR", inline="colors")
colorPSARShort = input(title="Short", type=input.color, defval=red, group="PSAR", inline="colors")
useSL = input(defval=false, type=input.bool, title="Set stop loss to PSAR plot?")

showTEMA = input(false, "Show TEMA?", group="Triple EMA", inline="showTEMA")
showTEMAfill = input(title="Shade TEMA?", defval=false, type=input.bool, group="Triple EMA", inline="showTEMA")
lengthTEMAFast = input(title="TEMA Fast length", defval=13, minval=1, group="Triple EMA", inline="TemaFast")
colorTEMAFast = input(title="",type=input.color, defval=lime, inline="TemaFast", group="Triple EMA")
lengthTEMASlow = input(title="TEMA Slow length", defval=34, minval=1, group="Triple EMA", inline="TemaSlow")
colorTEMASlow = input(title="",type=input.color, defval=red, group="Triple EMA", inline="TemaSlow")
thicknessTEMA=input(title="Line thickness", defval=2, type=input.integer, minval=1, maxval=4, step=1, group="Triple EMA")

showEMA = input(defval=true, type=input.bool, title="Show EMA?", group="EMA", inline="showEMA")
showEMAfill = input(title="Shade EMA?", defval=false, type=input.bool, group="EMA", inline="showEMA")
lengthEMAFast = input(9, title='EMA Fast Length', step=1, type=input.integer, group="EMA", inline="EmaFast")
colorEMAFast = input(title="",type=input.color, defval=lime, inline="EmaFast", group="EMA")
lengthEMASlow = input(21, title='EMA Slow Length', step=1, type=input.integer, group="EMA", inline="EmaSlow")
colorEMASlow = input(title="",type=input.color, defval=red, group="EMA", inline="EmaSlow")
lengthEMA200 = input(200, title='EMA Additional Length', step=1, type=input.integer, group="EMA", inline="EMA200")
colorEMA200 = input(title="",type=input.color, defval=orange, group="EMA", inline="EMA200")
filterEMA200 = input(title="Use as filter?", defval=false, type=input.bool, group="EMA", inline="EMA200", tooltip="Buy and sell signals are filtered on the additional EMA line, commonly set to 200.  This takes effect even if the PSAR confirmation is set to something other than EMA.")

thicknessEMA=input(title="Line thickness", defval=2, type=input.integer, minval=1, maxval=4, step=1, group="EMA")

lengthRSI = input(title="RSI Length", type=input.integer, defval=14, group="RSI")
rsiOverbought = input(title="Overbought Level", type=input.integer, defval=60, group="RSI", inline="levels")
rsiOversold = input(title="Oversold Level", type=input.integer, defval=40, group="RSI", inline="levels")

showeMAMA = input(defval=false, title="Show eMAMA?", type=input.bool, group="Ehler's MESA Adaptive Moving Average", inline="fill")
showEMAMAfill = input(title="Shade eMAMA?", defval=false, type=input.bool, group="Ehler's MESA Adaptive Moving Average", inline="fill")
fastlimitEMAMA=input(.5, title="Fast Limit", group="Ehler's MESA Adaptive Moving Average")
slowlimitEMAMA=input(.05, title="Slow Limit", group="Ehler's MESA Adaptive Moving Average")
thicknessEMAMA=input(title="Line thickness", defval=2, type=input.integer, minval=1, maxval=4, step=1, group="Ehler's MESA Adaptive Moving Average")

coloreMAMA = input(title="eMAMA",type=input.color, defval=lime, group="Ehler's MESA Adaptive Moving Average", inline="colors")
coloreFAMA = input(title="eFAMA",type=input.color, defval=red, group="Ehler's MESA Adaptive Moving Average", inline="colors")

lengthOBV = input(defval=20, title="OBV Length", type=input.integer, group="On Balance Volume")
emaOBV    = input(defval=9, title="EMA length", type=input.integer, group="On Balance Volume")

lengthStoch = input(14, "Stochastic Length", minval=1, group="SRSI")
smoothK = input(3, "SRSI K Smoothing", minval=1, group="SRSI")
smoothD = input(3, "SRSI D Smoothing", minval=1, group="SRSI")
srsiOverbought = input(defval=80, title="Overbought level", type=input.integer, group="SRSI", inline="levels")
srsiOversold = input(defval=20, title="Oversold level", type=input.integer, group="SRSI", inline="levels")

lengthMACDfast = input(title="Fast Length", type=input.integer, defval=12, group="MACD")
lengthMACDslow = input(title="Slow Length", type=input.integer, defval=26, group="MACD")
lengthMACDsignal = input(title="Signal Smoothing", type=input.integer, minval = 1, maxval = 50, defval = 9, group="MACD")

lengthCMF = input(20, minval=1, group="Chaiken Money Flow")

showTable = input(defval=false, title="Show summary table?", type=input.bool, group="Summary Table")
tablePosition = input(title="Summary Table Position", defval=position.bottom_left,
     options=[position.bottom_left,
     position.top_left, position.bottom_right, position.top_right], group="Summary Table")
tableTextSize = input(title="Table Text Size", defval=size.tiny,
     options=[size.auto, size.tiny, size.small, size.normal, size.large, size.huge], group="Summary Table")

useDateRange = input(defval=true, title="Limit backtesting by date", type=input.bool, group="Limit by date",
	 tooltip="Limit window for backtesting.  This allows you to compare different TFs over the same period.")
rangeType = input(defval="30 Days", title="Date range:", options=["Custom", "30 Days", "90 Days", "180 Days", "Year to Date"], group="Limit by date")


startDate = input(title="Start Date (DD/MM/YYYY)", type=input.time,
     defval=timestamp("1 Jan 2021 1:01 -0400"), group="Limit by date")
endDate =   input(title="End Date (DD/MM/YYYY)  ", type=input.time,
     defval=timestamp("31 Dec 2100 19:59 -0400"), group="Limit by date", tooltip="You likely want to leave this far in the future.")

startDate := rangeType == "Custom" ? startDate :
     rangeType == "30 Days" ? timenow - 2592000000 :
     rangeType == "90 Days" ? timenow - 7776000000 :
     rangeType == "180 Days" ? timenow - 15552000000 :
     rangeType == "Year to Date" ? timestamp(syminfo.timezone, year(timenow), 01, 01, 00, 01) : na

inDateRange = (time >= startDate) and (time < endDate)
inDateRange := true


// ------------------------------------------------<[  Variable Declarations ]>----------------------------------------------
var bool psarConfirmationBuy = na
var bool psarConfirmationSell = na
var float eMAMA = na
var float eFAMA = na

var float historicalHigh = 0 // for OBV scaling

// -------------------------------------------------------<[ Functions ]>----------------------------------------------------
fDirection(series, length) =>
    rising(series,length) ? "↑" : "↓"

fTEMA(sourceTEMA, length) =>
    Tema1 = ema(sourceTEMA, length)
    Tema2 = ema(Tema1, length)
    Tema3 = ema(Tema2, length)
    3 * Tema1 - 3 * Tema2 + Tema3

fMAMA(sourceEMAMA, slowlimitEMAMA, fastlimitEMAMA) =>
	var float p = na
	var float i2 = na
	var float q2 = na
	var float re = na
	var float im = na
	var float spp = na
	sp = (4*sourceEMAMA + 3*sourceEMAMA[1] + 2*sourceEMAMA[2] + sourceEMAMA[3]) / 10.0
	dt = (.0962*sp + .5769*nz(sp[2]) - .5769*nz(sp[4])- .0962*nz(sp[6]))*(.075*nz(p[1]) + .54)
	q1 = (.0962*dt + .5769*nz(dt[2]) - .5769*nz(dt[4])- .0962*nz(dt[6]))*(.075*nz(p[1]) + .54)
	i1 = nz(dt[3])
	jI = (.0962*i1 + .5769*nz(i1[2]) - .5769*nz(i1[4])- .0962*nz(i1[6]))*(.075*nz(p[1]) + .54)
	jq = (.0962*q1 + .5769*nz(q1[2]) - .5769*nz(q1[4])- .0962*nz(q1[6]))*(.075*nz(p[1]) + .54)
	i2_ = i1 - jq
	q2_ = q1 + jI
	i2 := .2*i2_ + .8*nz(i2[1])
	q2 := .2*q2_ + .8*nz(q2[1])
	re_ = i2*nz(i2[1]) + q2*nz(q2[1])
	im_ = i2*nz(q2[1]) - q2*nz(i2[1])
	re := .2*re_ + .8*nz(re[1])
	im := .2*im_ + .8*nz(im[1])
	p1 = iff(im!=0 and re!=0, 360/atan(im/re), nz(p[1]))
	p2 = iff(p1 > 1.5*nz(p1[1]), 1.5*nz(p1[1]), iff(p1 < 0.67*nz(p1[1]), 0.67*nz(p1[1]), p1))
	p3 = iff(p2<6, 6, iff (p2 > 50, 50, p2))
	p := .2*p3 + .8*nz(p3[1])
	spp := .33*p + .67*nz(spp[1])
	phaseEMAMA = atan(q1 / i1)
	dphase_ = nz(phaseEMAMA[1]) - phaseEMAMA
	dphase = iff(dphase_< 1, 1, dphase_)
	alpha_ = fastlimitEMAMA / dphase
	alpha = iff(alpha_ < slowlimitEMAMA, slowlimitEMAMA, iff(alpha_ > fastlimitEMAMA, fastlimitEMAMA, alpha_))


fOBV(src) =>
    changeOBV = change(src)
    cum(changeOBV > 0 ? volume : changeOBV < 0 ? -volume : 0*volume)

// -------------------------------------------<[ Variable Calculations ]>------------------------------------------
temaSlow = fTEMA(sourceGlobal, lengthTEMASlow)
temaFast = fTEMA(sourceGlobal, lengthTEMAFast)
shortTema = crossover(temaSlow, temaFast)
longTema = crossunder(temaSlow, temaFast)
fillTema = temaFast>temaSlow ? color.new(colorTEMAFast,80) : color.new(colorTEMASlow,80)

emaFast = ema(sourceGlobal, lengthEMAFast)
emaSlow = ema(sourceGlobal, lengthEMASlow)
ema200 = ema(sourceGlobal, lengthEMA200)
longEMA = crossover(emaFast, emaSlow)
shortEMA = crossunder(emaFast , emaSlow)
fillEMA = emaFast>emaSlow ? color.new(colorEMAFast,80) : color.new(colorEMASlow,80)

cumOBV = fOBV(sourceGlobal)
oscOBV = (cumOBV - ema(cumOBV,lengthOBV))
changeOBV = change(sourceGlobal)
shortOBV = ema(cumOBV, lengthOBV)


psar = sar(psarStart, psarIncrement, psarMaximum)
psarDir = psar < close ? 1 : -1
colorPSAR = psarDir == 1 ? color.new(#3388bb,0) : color.new(#fdcc02,0)
colorPSARFill = psarHighlightState ? (psarDir == 1 ? color.new(colorPSARLong,90) : color.new(colorPSARShort,90)) : na
psarChangeCond = psarDir != psarDir[1]

valueRSI = rsi(sourceGlobal, lengthRSI)


if psarConfirmation == "EMA"
    if emaFast > emaSlow
        psarConfirmationBuy := true
        psarConfirmationSell := false
    else if emaFast < emaSlow
        psarConfirmationSell := true
        psarConfirmationBuy := false
else if psarConfirmation == "TEMA"
    if temaFast > temaSlow
        psarConfirmationBuy := true
        psarConfirmationSell := false
    else if temaFast < temaSlow
        psarConfirmationSell := true
        psarConfirmationBuy := false
else if psarConfirmation == "eMAMA"
    if eMAMA > eFAMA
        psarConfirmationBuy := true
        psarConfirmationSell := false
    else if eMAMA < eFAMA
        psarConfirmationSell := true
        psarConfirmationBuy := false
else if psarConfirmation == "RSI"
	if valueRSI < 40
        psarConfirmationBuy := true
        psarConfirmationSell := false
    else if valueRSI > 60
        psarConfirmationSell := true
        psarConfirmationBuy := false
else if psarConfirmation == "OBV"
	if oscOBV > 0
        psarConfirmationBuy := true
        psarConfirmationSell := false
    else if oscOBV < 0
        psarConfirmationSell := true
        psarConfirmationBuy := false

psarBuySignal = psarDir == 1 and psarDir[1] == -1 and (filterEMA200 ? open > ema200 : true) and inDateRange
psarSellSignal = psarDir == -1 and psarDir[1] == 1 and (filterEMA200 ? open < ema200 : true) and inDateRange

eMAMA := fMAMA(sourceGlobal, slowlimitEMAMA, fastlimitEMAMA)*sourceGlobal + (1 - fMAMA(sourceGlobal, slowlimitEMAMA, fastlimitEMAMA))*nz(eMAMA[1])
eFAMA := .5*fMAMA(sourceGlobal, slowlimitEMAMA, fastlimitEMAMA)*eMAMA + (1 - .5*fMAMA(sourceGlobal, slowlimitEMAMA, fastlimitEMAMA))*nz(eFAMA[1])
longMAMA=crossover(eMAMA, eFAMA)
shortMAMA=crossunder(eMAMA,eFAMA)
fillEMAMA = eMAMA>eFAMA ? color.new(coloreMAMA, 80) : color.new(coloreFAMA, 80)

srsiK = sma(stoch(valueRSI, valueRSI, valueRSI, lengthStoch), smoothK)
srsiD = sma(srsiK, smoothD)

fastMACD = ema(sourceGlobal, lengthMACDfast)
slowMACD = ema(sourceGlobal, lengthMACDslow)
macd = fastMACD - slowMACD
signalMACD = ema(macd, lengthMACDsignal)

adCMF = close==high and close==low or high==low ? 0 : ((2*close-low-high)/(high-low))*volume
mfCMF = sum(adCMF, lengthCMF) / sum(volume, lengthCMF)


// ================================== //
// ----> Conditional Parameters <---- //
// ================================== //

// ================================== //
// -------> Risk Mitigation <-------- //
// ================================== //

// ================================== //
// --------> Logical Order <--------- //
// ================================== //


// -------------------------------------------<[ Graphical Display ]>------------------------------------------

// TEMA plots
plotTemaSlow = plot(showTEMA ? temaSlow: na, color=color.new(colorTEMASlow,20), title="TEMA Slow plot", linewidth=thicknessTEMA)
plotTemaFast = plot(showTEMA ? temaFast: na, color=color.new(colorTEMAFast,20), title="TEMA Fast plot", linewidth=thicknessTEMA)

plotshape(showTEMA and longTema ? temaFast: na, style=shape.triangleup, location=location.absolute,
     size=size.tiny, title="TEMA Cross Up", color=color.new(colorTEMAFast,10))
plotshape(showTEMA and shortTema ? temaSlow: na, style=shape.triangledown, location=location.absolute,
     size=size.tiny, title="TEMA Cross Down", color=color.new(colorTEMASlow,10))
fill(plotTemaFast, plotTemaSlow, color=showTEMAfill ? fillTema : transparent, title="TEMA fill")

// EMA plots
plotEmaFast = plot(showEMA ? emaFast: na, title='EMA Fast Plot', color=colorEMAFast, linewidth=thicknessEMA)
plotEmaSlow = plot(showEMA ? emaSlow: na, title='EMA Slow Plot', color=colorEMASlow, linewidth=thicknessEMA)
plotEMA200 = plot(showEMA ? ema200: na, title='EMA Additional Plot', color=colorEMA200, linewidth=thicknessEMA)

plotshape(showEMA and longEMA ? emaFast : na, style=shape.triangleup, location=location.absolute, size=size.tiny,
	 title="EMA Cross Up",color=colorEMAFast)
plotshape(showEMA and shortEMA ? emaFast : na, style=shape.triangledown, location=location.absolute, size=size.tiny,
	 title="EMA Cross Down",color=colorEMASlow)
fill(plotEmaFast, plotEmaSlow, color=showEMAfill ? fillEMA : transparent, title="EMA fill")

// PSAR plots
psarPlot = plot(showPSAR ? psar: na, title="PSAR", style=plot.style_circles, linewidth=1, color=colorPSAR)
plotshape(showPSAR and psarBuySignal and psarHighlightStartPoints ? psar : na, title="PSAR Long Start", location=location.absolute,
	 style=shape.circle, size=size.tiny, color=colorPSARLong)
plotshape(showPSAR and psarBuySignal and psarShowLabels and psarConfirmationBuy ? psar : na, title="PSAR Buy Label", text="Buy", location=location.absolute,
	 style=shape.labelup, size=size.tiny, color=colorPSARLong, textcolor=color.white)
plotshape(showPSAR and psarSellSignal and psarHighlightStartPoints ? psar : na, title="PSAR Short Start", location=location.absolute,
	 style=shape.circle, size=size.tiny, color=colorPSARShort)
plotshape(showPSAR and psarSellSignal and psarShowLabels and psarConfirmationSell ? psar : na, title="PSAR Sell Label", text="Sell", location=location.absolute,
	 style=shape.labeldown, size=size.tiny, color=colorPSARShort, textcolor=color.white)
psarMidPricePlot = plot(ohlc4, title="", display=display.none, editable=false)
fill(psarMidPricePlot, psarPlot, title="PSAR Trade State Filling", color=colorPSARFill)


ploteMAMA = plot(showeMAMA ? eMAMA : na, title="Ehler's MAMA", linewidth=thicknessEMAMA, style=plot.style_line, color=coloreMAMA)
ploteFAMA = plot(showeMAMA ? eFAMA : na, title="Ehler's FAMA", linewidth=thicknessEMAMA, style=plot.style_line, color=coloreFAMA)
plotshape(showeMAMA and longMAMA ? eFAMA: na, style=shape.triangleup, location=location.absolute, size=size.tiny, title="eMAMA Cross Up",
	 color=color.new(coloreMAMA,10))
plotshape(showeMAMA and shortMAMA ? eFAMA: na, style=shape.triangledown, location=location.absolute, size=size.tiny, title="eMAMA Cross Down",
	 color=color.new(coloreFAMA,10))
fill(ploteMAMA, ploteFAMA, color=showEMAMAfill ? fillEMAMA : transparent, title="eMAMA fill")


// ---------------------------------------------------<[ Strategy Execution ]>-------------------------------------------------

strategy.entry(id="long", long=strategy.long, comment="enL", when=psarBuySignal and psarConfirmationBuy and tradeLong)
if useSL
	strategy.exit(id="long", stop=psar, comment="SL")
strategy.close(id="long", comment="exL", when=psarSellSignal and psarConfirmationSell and tradeLong)

strategy.entry(id="short", long=strategy.short, comment="enS", when=psarSellSignal and psarConfirmationSell and tradeShort)
if useSL
	strategy.exit(id="short", stop=psar, comment="SL")
strategy.close(id="short", comment="exS", when=psarBuySignal and psarConfirmationBuy and tradeShort)


// -------------------------------------------------------<[ Tables ]>---------------------------------------------------------

//   Shows red for bearish signals, green for bullish signals.
var table summaryTable = table.new(tablePosition, 3, 3)

if (barstate.islast and showTable)
    table.cell(summaryTable, 0, 0, "PSAR",text_size=tableTextSize, bgcolor = psarDir == 1 ? color.green : color.red)

    rsiDirection = fDirection(valueRSI,1)
    table.cell(summaryTable, 0, 1, "RSI " + tostring(round(valueRSI,0)) + rsiDirection,text_size=tableTextSize,
    	 bgcolor = iff(valueRSI > rsiOverbought, color.red, iff(valueRSI < rsiOversold, color.green, color.yellow)))

    srsiDirection = fDirection(srsiK,1)
    table.cell(summaryTable, 0, 2, "K " + tostring(round(srsiK,0)) + srsiDirection, text_size=tableTextSize,
    	 bgcolor=iff(srsiK > srsiOverbought, color.red, iff(srsiK < srsiOversold, color.green, srsiK > srsiD ? color.green : color.red)))

    emaDirection = fDirection(emaFast,1)
    table.cell(summaryTable, 1, 0, "EMA" + emaDirection,text_size=tableTextSize,
    	 bgcolor = emaFast > emaSlow and emaFast > emaFast[1] ? color.green : color.red)
    // See if emaFast has increased over the last two periods.
    if rising(emaFast,2) and emaFast < emaSlow
        table.cell_set_bgcolor(summaryTable, 1, 0, color.yellow)

    directionTEMA = fDirection(temaFast,1)
    table.cell(summaryTable, 1, 1, "TEMA" + directionTEMA,text_size=tableTextSize,
    	 bgcolor = temaFast > temaSlow and temaFast > temaFast[1] ? color.green : color.red)
    // See if temaFast has increased over the last two periods.
    if rising(temaFast,2) and temaFast < temaSlow
        table.cell_set_bgcolor(summaryTable, 1, 1, color.yellow)

    directionMAMA = fDirection(eMAMA,1)
    table.cell(summaryTable, 1, 2, "eMAMA" + directionMAMA,text_size=tableTextSize,
    	 bgcolor = eMAMA > eFAMA and eMAMA > eFAMA[1] ? color.green : color.red)
    // See if temaFast has increased over the last two periods.
    if rising(eMAMA,2) and eMAMA < eFAMA
        table.cell_set_bgcolor(summaryTable, 1, 2, color.yellow)

    directionMACD = fDirection(macd,2)
    table.cell(summaryTable, 2, 0, "MACD " + directionMACD, text_size=tableTextSize, bgcolor= macd > signalMACD ? color.green : color.red)

    directionOBV = fDirection(shortOBV,2)
    table.cell(summaryTable, 2, 1, "OBV " + directionOBV, text_size=tableTextSize, bgcolor= shortOBV > 0 ? color.green : color.red)

    directionCMF = fDirection(mfCMF,2)
    table.cell(summaryTable, 2, 2, "CMF " + directionCMF + tostring(mfCMF, "#.##"), text_size=tableTextSize, bgcolor= mfCMF > 0 ? color.green : color.red)


// ---------------------------------------------------<[ Alerts ]>-------------------------------------------------
if psarBuySignal and psarConfirmationBuy
	alert("PSAR buy/long signal confirmed for {{ticker}} on {{interval}}.", alert.freq_once_per_bar)

if psarSellSignal and psarConfirmationSell
	alert("PSAR sell/short signal confirmed for {{ticker}} on {{interval}}.", alert.freq_once_per_bar)

if psarChangeCond
	alert("PSAR has changed direction for {{ticker}} on {{interval}}.", alert.freq_once_per_bar)