Langsame RSI-Überkauf- und Überverkaufsstrategie
Überblick
Die Slow RSI-Over-Over-Buy-Strategie eröffnet neue Handelsmöglichkeiten, indem sie den RSI-Rückblick verlängert und die Volatilität der RSI-Kurve verringert. Die Strategie gilt auch für andere technische Indikatoren wie den MACD.
Strategieprinzip
Die Kernidee der Strategie besteht darin, die Länge des RSI-Rückblickungszyklus zu verlängern, und zwar mit 500 Zyklen, und dann die RSI-Kurve durch SMA zu glätten, wobei die Standard-Periode 250 ist. Dadurch kann die Volatilität der RSI-Kurve erheblich reduziert und die Reaktionsgeschwindigkeit des RSI verlangsamt werden, wodurch neue Handelsmöglichkeiten entstehen.
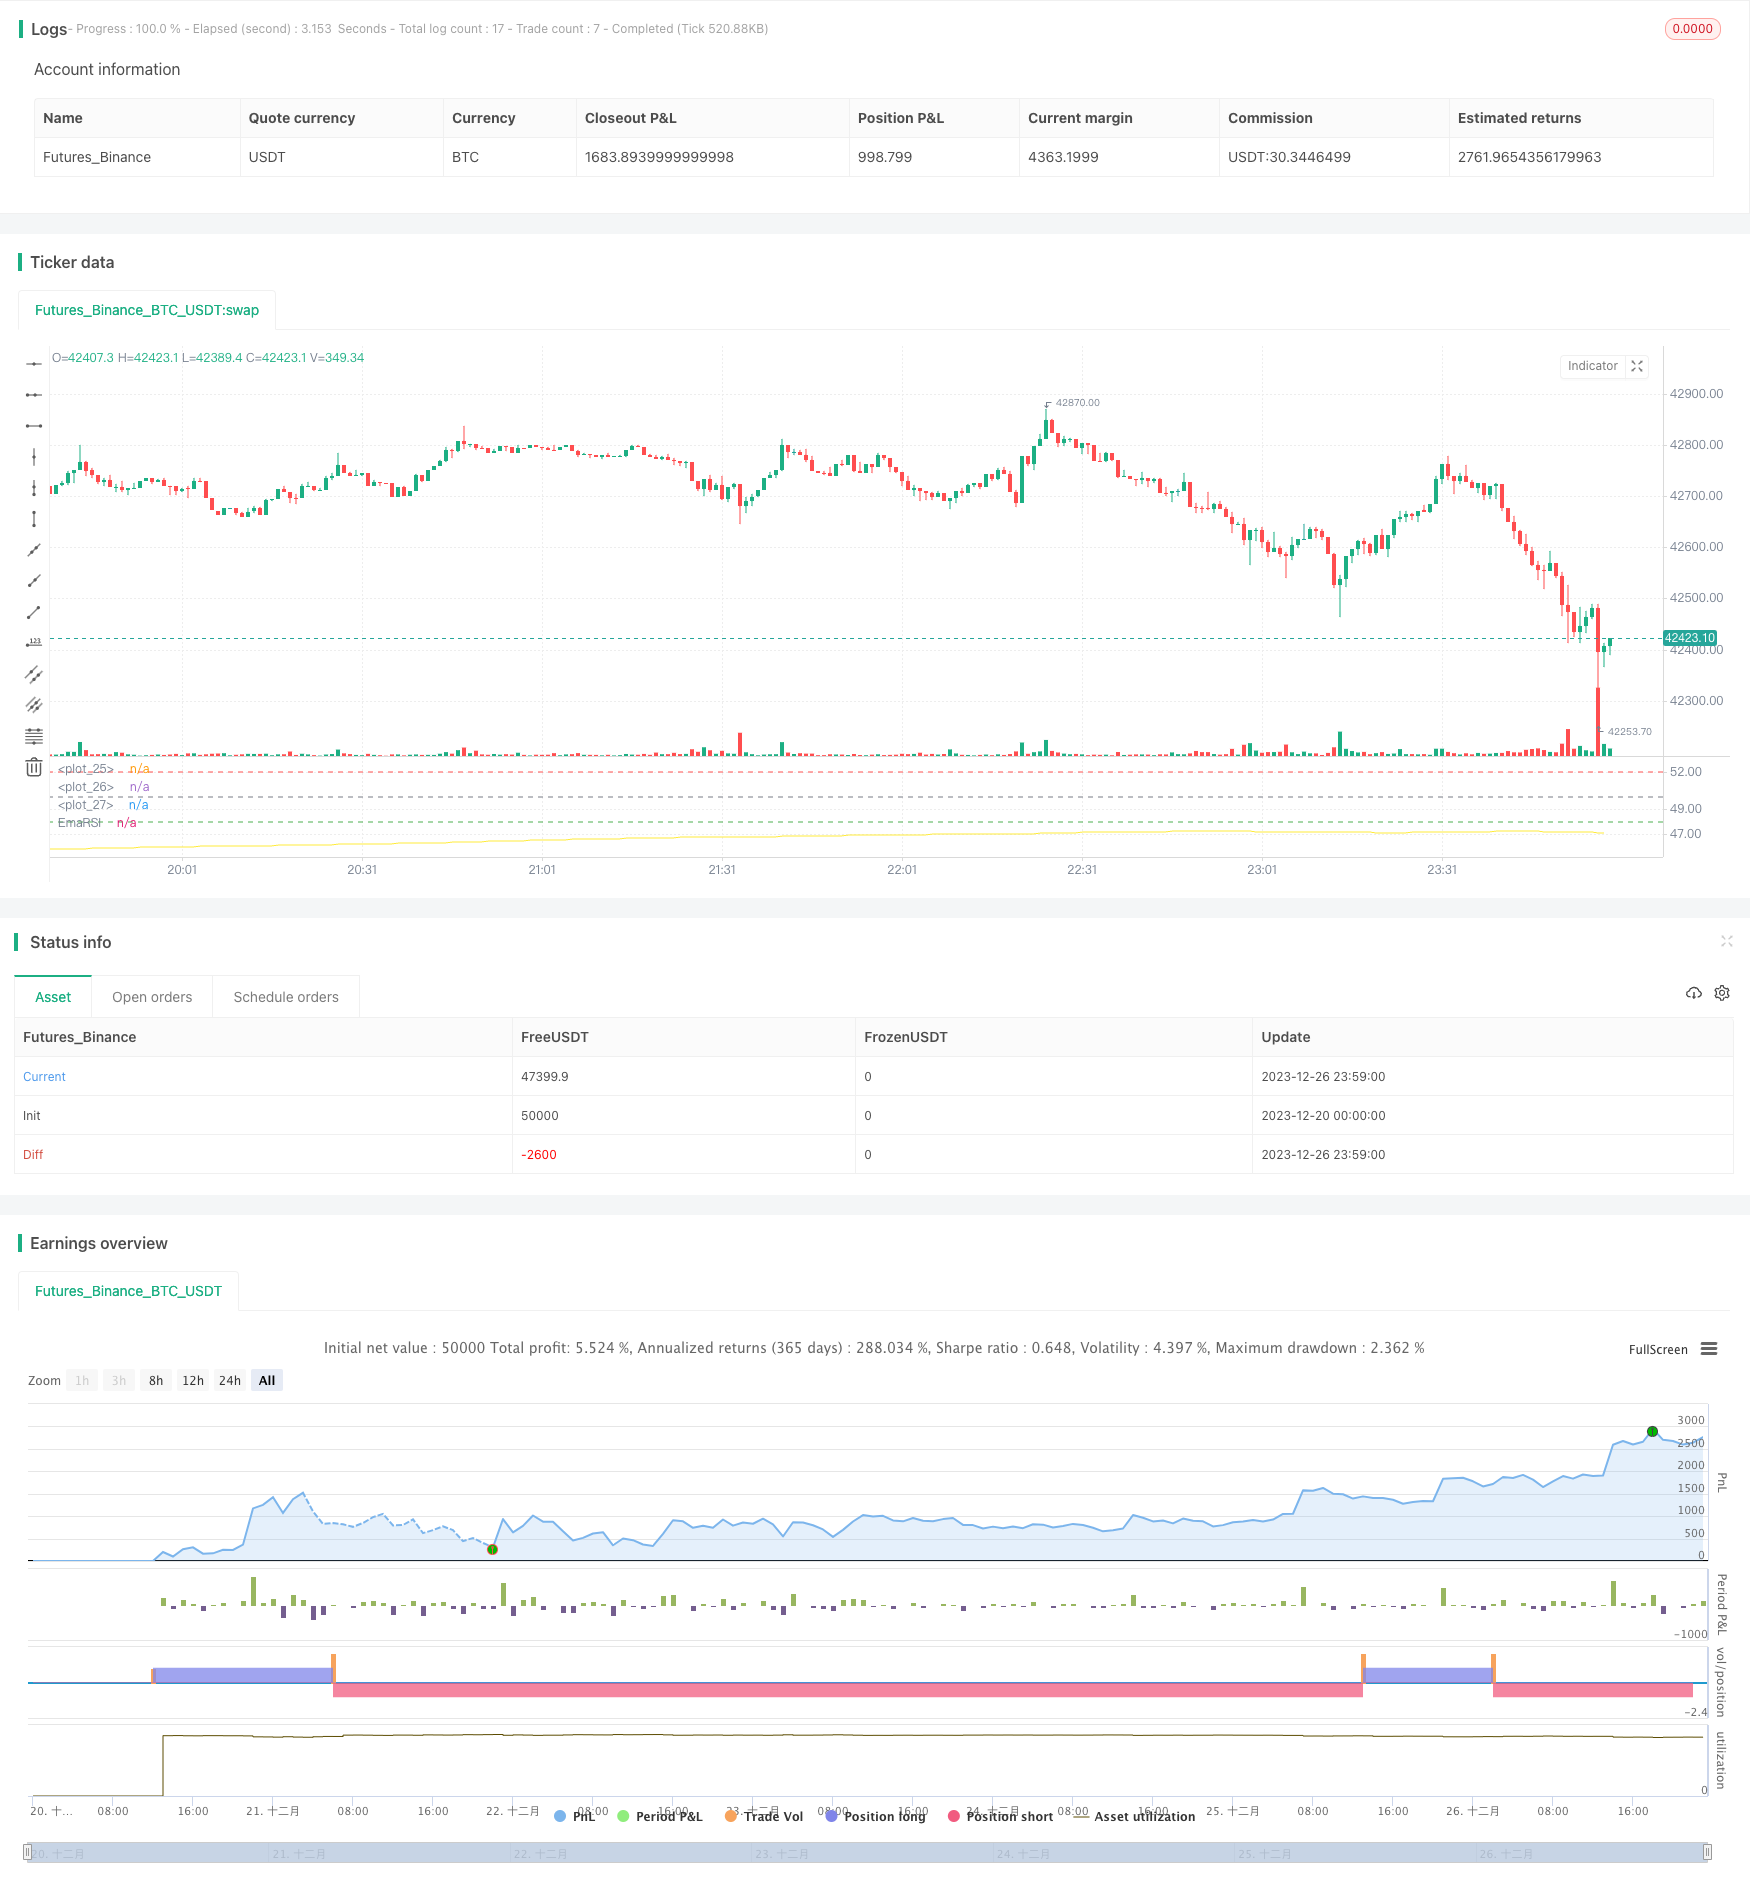
Eine zu lange Rückblick-Periode schwächt die Volatilität der RSI-Kurve, so dass auch die Kriterien für Überkauf und Überverkauf angepasst werden müssen. Die Strategie setzt eine benutzerdefinierte Überkauf-Linie 52 und eine Überverkauf-Linie 48 ein.
Strategische Vorteile
- Innovativ, neue Geschäftsideen durch verlängerte Laufzeiten
- Das bedeutet, dass es weniger Falschmeldungen gibt und die Stabilität verbessert.
- Benutzerdefinierte Überkauf- und Überverkaufsmargen für verschiedene Märkte
- Das ist eine gute Idee, um die Erträge zu steigern.
Strategisches Risiko
- Zu langes Lauf kann eine kurze Linie verpassen
- Es ist notwendig, geduldig zu warten, bis sich eine Chance eröffnet.
- Überkaufen und Überverkaufen: Fehlgelegte Schwellenwerte können zu Verlusten führen
- Risiken von Arbitrage
Die Lösung:
- Um die Zeit zu verkürzen und die Häufigkeit zu erhöhen
- Verschiedene Arten von Lagerhaltung, um Risiken zu verteilen
- Optimierung der Abwertungsparameter für unterschiedliche Marktumstände
- Setzen Sie einen Stop-Loss-Punkt, um große Verluste zu vermeiden
Richtung der Strategieoptimierung
- Optimieren Sie die Parameter des RSI, um die beste Periodenzusammenstellung zu finden
- Verschiedene SMA-Gleichzyklusparameter testen
- Optimierung der Parameter für Überkauf und Überverkauf für verschiedene Märkte
- Die Einführung von Stop-Loss-Strategien zur Kontrolle von Einzelschäden
Zusammenfassen
Die Slow RSI Oversold-Overbuying-Strategie hat erfolgreich neue Handelsideen eröffnet, indem sie die Zyklen verlängert und die Schwankungen durch den Einsatz von Gleichgewichtsunterdrückung unterdrückt. Die Strategie verspricht stabile und effiziente Übergewinne bei Optimierung der Parameter und Risikokontrolle. Insgesamt ist die Strategie sehr innovativ und nutzbar.
/*backtest
start: 2023-12-20 00:00:00
end: 2023-12-27 00:00:00
period: 1m
basePeriod: 1m
exchanges: [{"eid":"Futures_Binance","currency":"BTC_USDT"}]
*/


// Wilder was a very influential man when it comes to TA. However, I'm one to always try to think outside the box.
// While Wilder recommended that the RSI be used only with a 14 bar lookback period, I on the other hand think there is a lot to learn from RSI if one simply slows down the lookback period
// Same applies for MACD.
// Every market has its dynmaics. So don't narrow your mind by thinking my source code input levels are the only levels that work.
// Since the long lookback period weakens the plot volatility, again, one must think outside the box when trying to guage overbought and oversold levels.

// Good luck and don't bash me if some off-the-wall FA spurned divergence causes you to lose money.
// And NO this doesn't repaint and I won't answer those who ask.
//@version=4

strategy("SLOW RSI OB/OS Strategy", overlay=false)
price = input(ohlc4, title="Price Source")
len = input(500, minval=1, step=5,  title="RSI Length")
smoother = input(250, minval=1, step=5, title="RSI SMA")
up = rma(max(change(price), 0), len)
down = rma(-min(change(price), 0), len)
rsi = down == 0 ? 100 : up == 0 ? 0 : 100 - (100 / (1 + up / down))
EmaRSI = ema(rsi,smoother)
plot(EmaRSI, title="EmaRSI", style=line, linewidth=1, color=yellow)


OB = input(52, step=0.1)
OS = input(48, step=0.1)
hline(OB, linewidth=1, color=red)
hline(OS,linewidth=1, color=green)
hline(50,linewidth=1, color=gray)


long = change(EmaRSI) > 0 and EmaRSI <= 50 and crossover(EmaRSI, OS)
short = change(EmaRSI) < 0 and EmaRSI >= 50 and crossunder(EmaRSI, OB)


strategy.entry("Long", strategy.long, when=long) //_signal or long) //or closeshort_signal)
strategy.entry("Short", strategy.short, when=short) //_signal or short) // or closelong_signal)

// If you want to try to play with exits you can activate these!

//closelong = crossunder(EmaRSI, 0) //or crossunder(EmaRSI, OS)
//closeshort = crossover(EmaRSI, 0) //or crossover(EmaRSI, OB)

//strategy.close("Long", when=closelong)
//strategy.close("Short", when=closeshort)